

Analysis results
Maximum demand capacity ratio
When this option is selected, the elements appear in a certain colour according to their use percentage. The colour scale is displayed below the 3D view of the connection.
When clicking on an element in the connection, its checks are displayed on the right. Clicking on an empty space in the 3D view brings up all the checks.
On the right-hand side, above the “Checks” section, a table is displayed with the “Maximum demand capacity ratio” of each type of element.
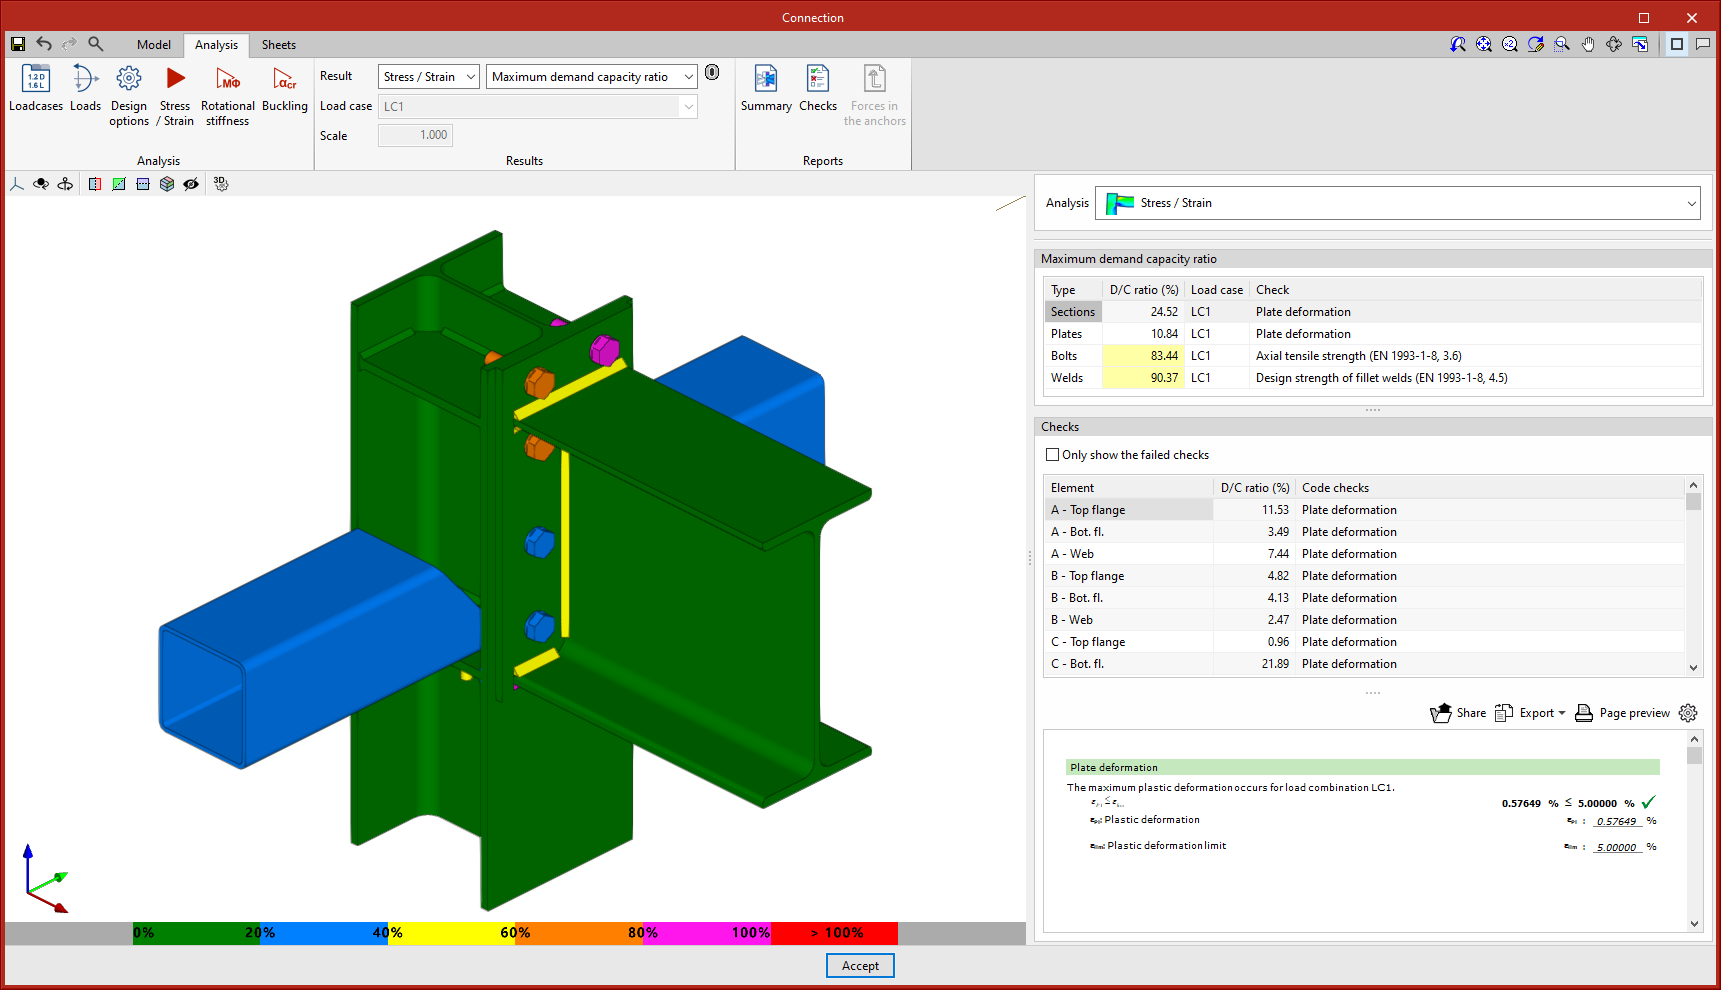
For sections and plates, the deformation is checked by setting a plastic deformation limit of 5 %. For welds, fillet weld strength is checked. For bolts, edge and bolt distance, tensile strength, shear strength and bearing resistance, as well as the interaction between shear and tension are checked. For prestressed bolts, slip resistance is also tested.
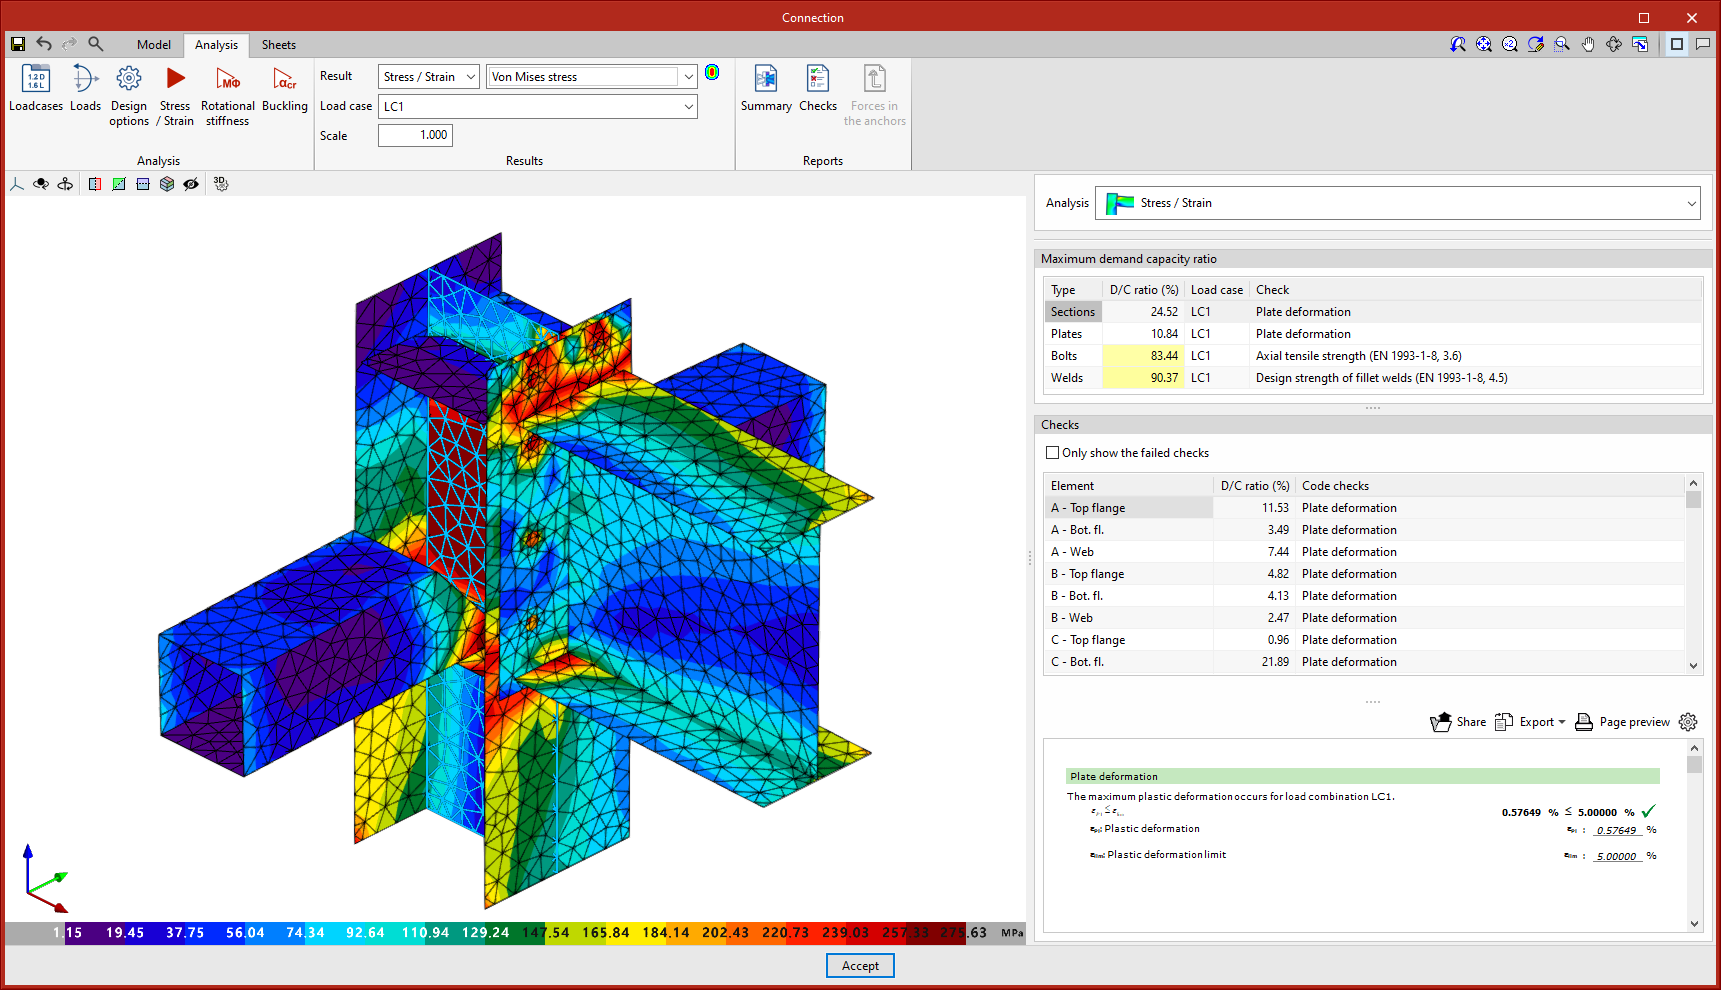
Von Mises stress
This option displays the elements with their discretisation. When clicking on any sheet, its results are displayed in a dialogue box.
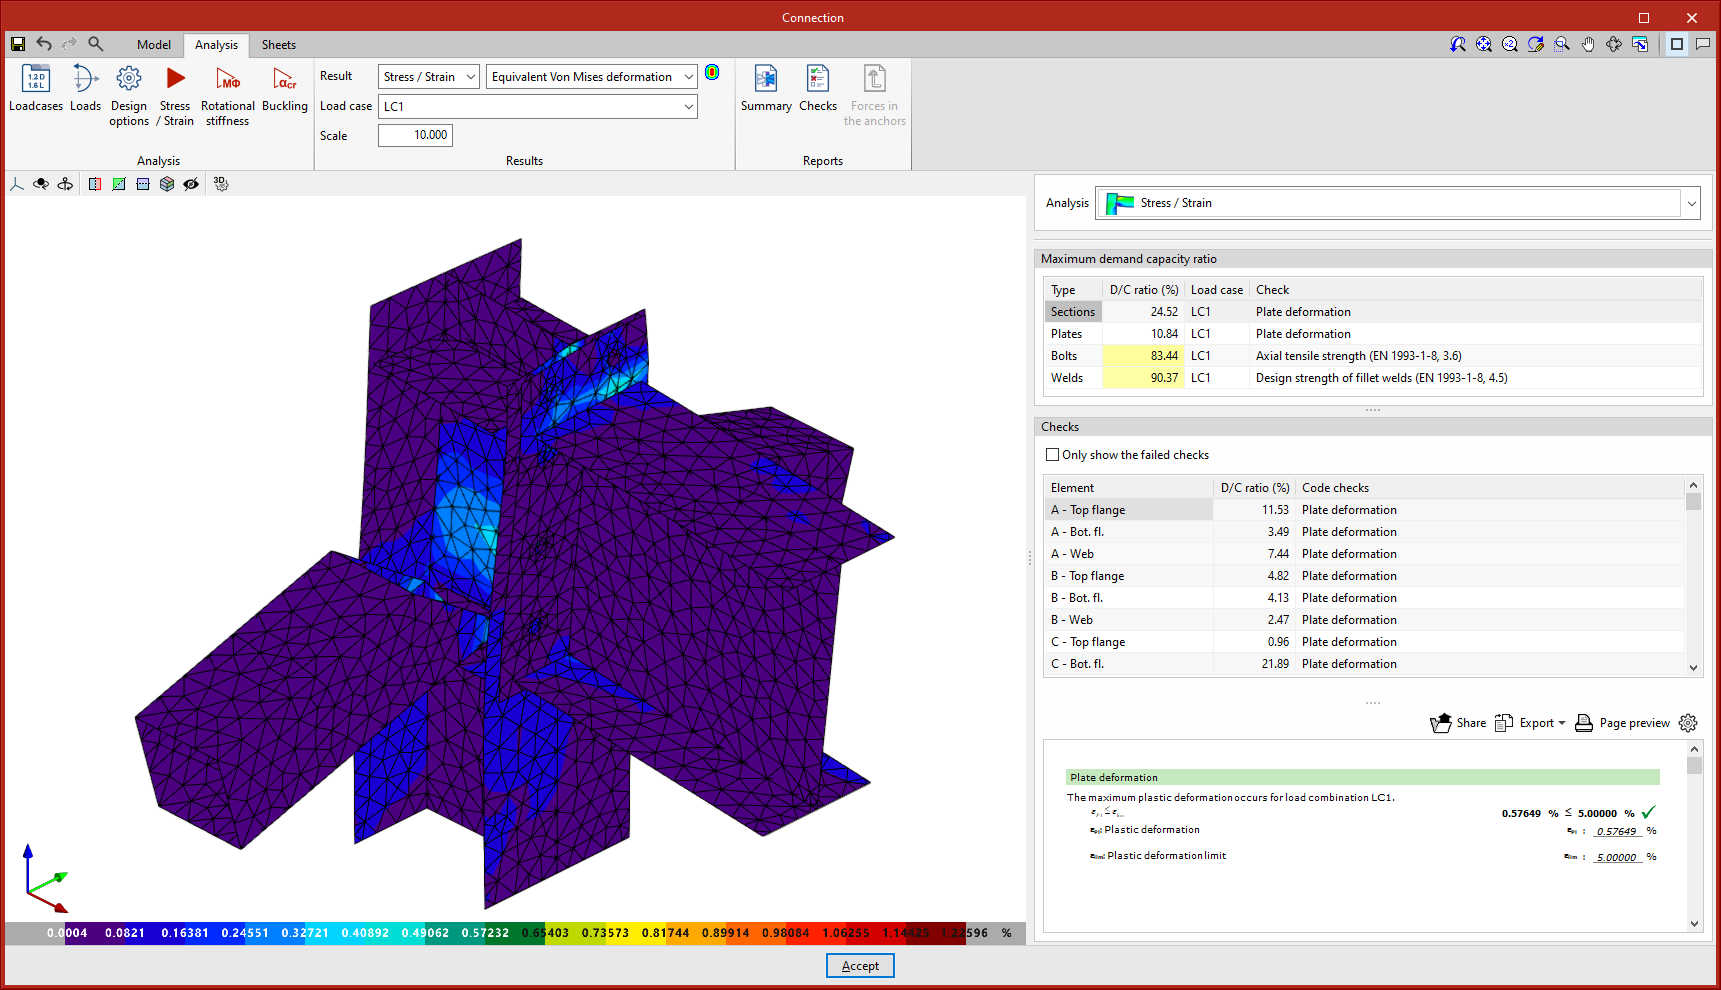
Equivalent Von Mises deformation
This option represents the contour plots of the "Equivalent Von Mises deformation".
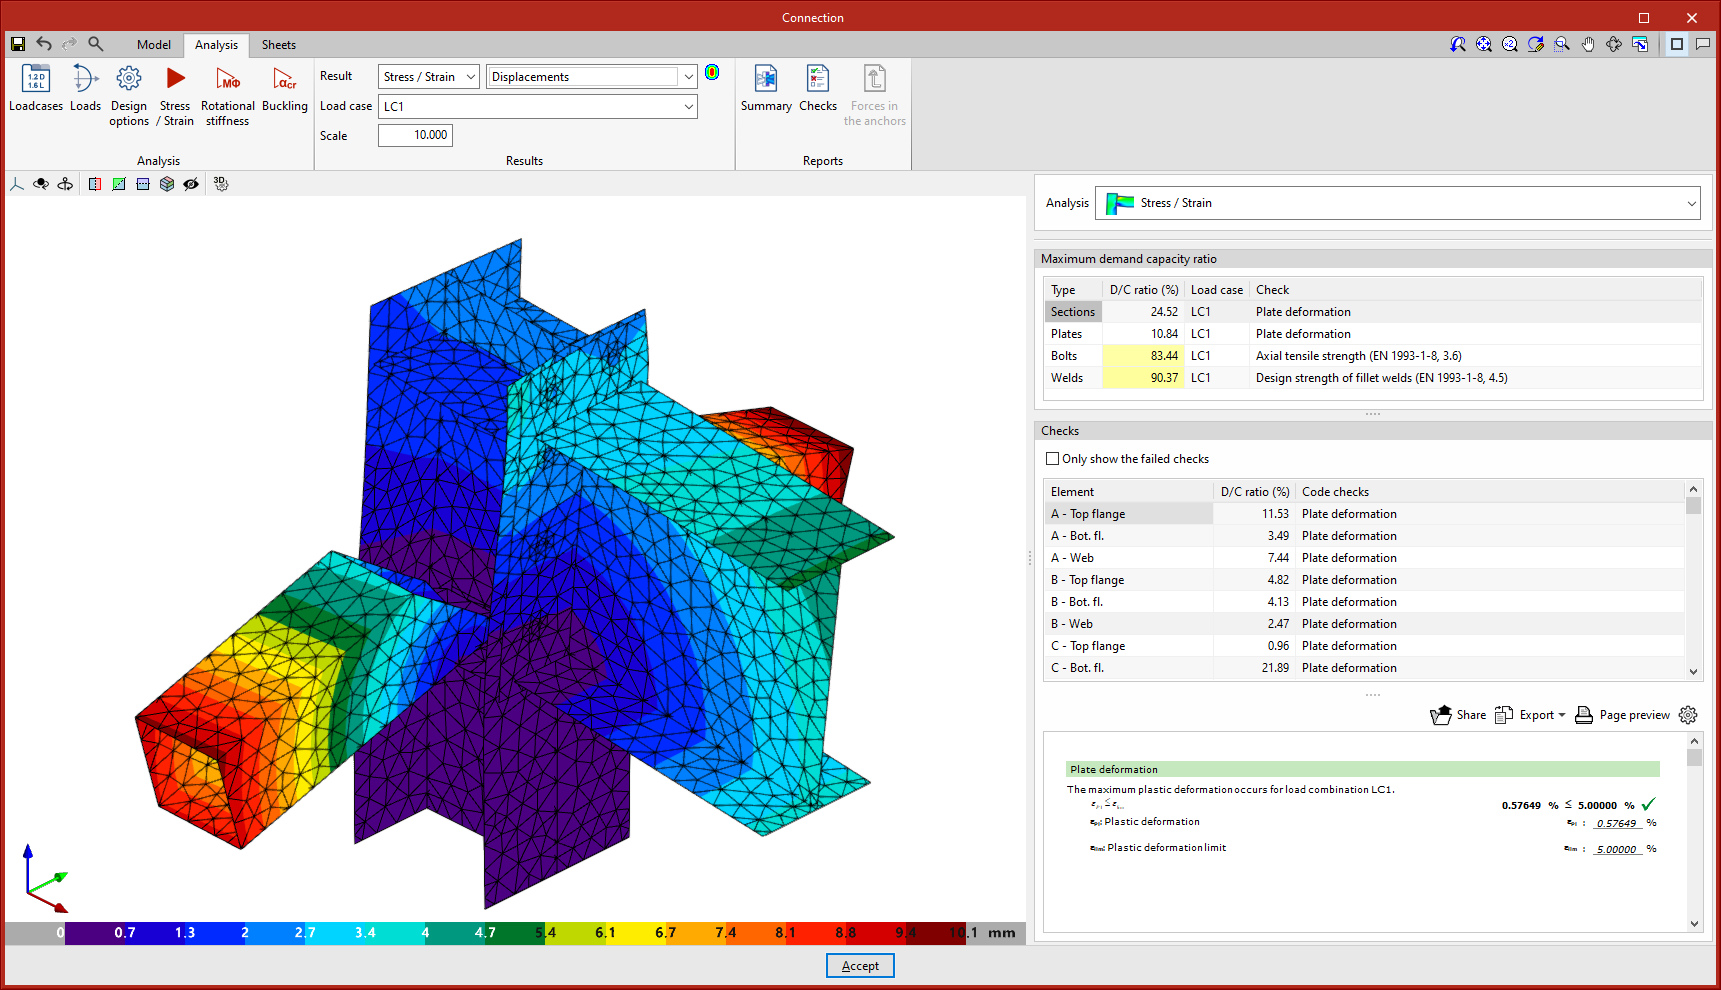
Displacements
With this option, the displacement values are displayed on the analytical model view of the connection.
Connection analysis reports
The results of analyses carried out in CYPE Connect can also be obtained as reports, which can be accessed via the "Reports" group in the top toolbar of the "Analysis" tab. The available reports include the following:
- Summarised report. This can include data on connection components, applied loads, checks and annotations.
- Checks report. This displays the points analysed according to the selected code, together with their numerical result and a warning indicating whether or not they have been verified.
- Forces in the anchors. This shows the resulting forces for each anchor and for each load combination.