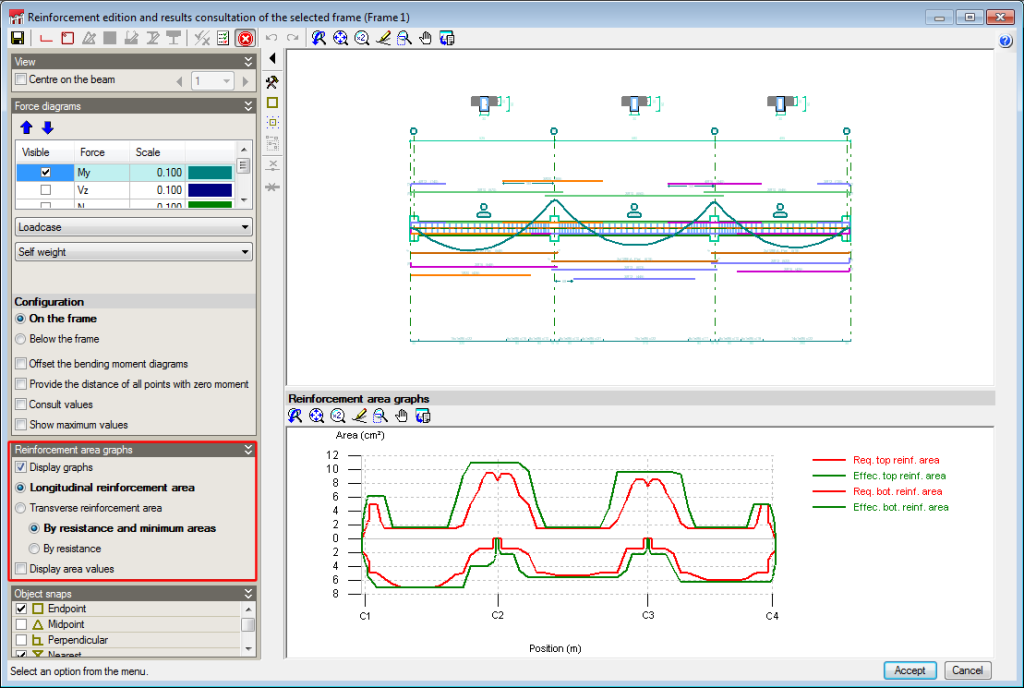
Implemented in Continuous beams are graphs representing the required area of the reinforcement and the effective area of the reinforcement provided in a frame.
These graphs are represented in the reinforcement edition screen (Job data > Reinforcement edition and results consultation of the selected frame). Displayed in the top part of the screen is the reinforcement of the frame (where the force diagrams can be represented) and in the bottom part are the area graphs.
Users can select the longitudinal reinforcement area representation (top and bottom) or that of the transverse reinforcement area. The area required depending on the resistance and minimum required reinforcement can be represented in each representation (longitudinal or transverse) or just the area required depending on the resistance. The numerical values of the areas can also be viewed. These representation options can be configured in the Reinforcement area graphs section, located in the left side menu of the reinforcement edition screen.

The reinforcement area graphs are of great use for when introducing or modifying the reinforcement. Users can see the areas covered by the reinforcement whilst the introduction or modification is taking place (even deducting its anchorage length).


