The definitions of status loadcases were included in the 2018.c version of CYPELEC Networks.
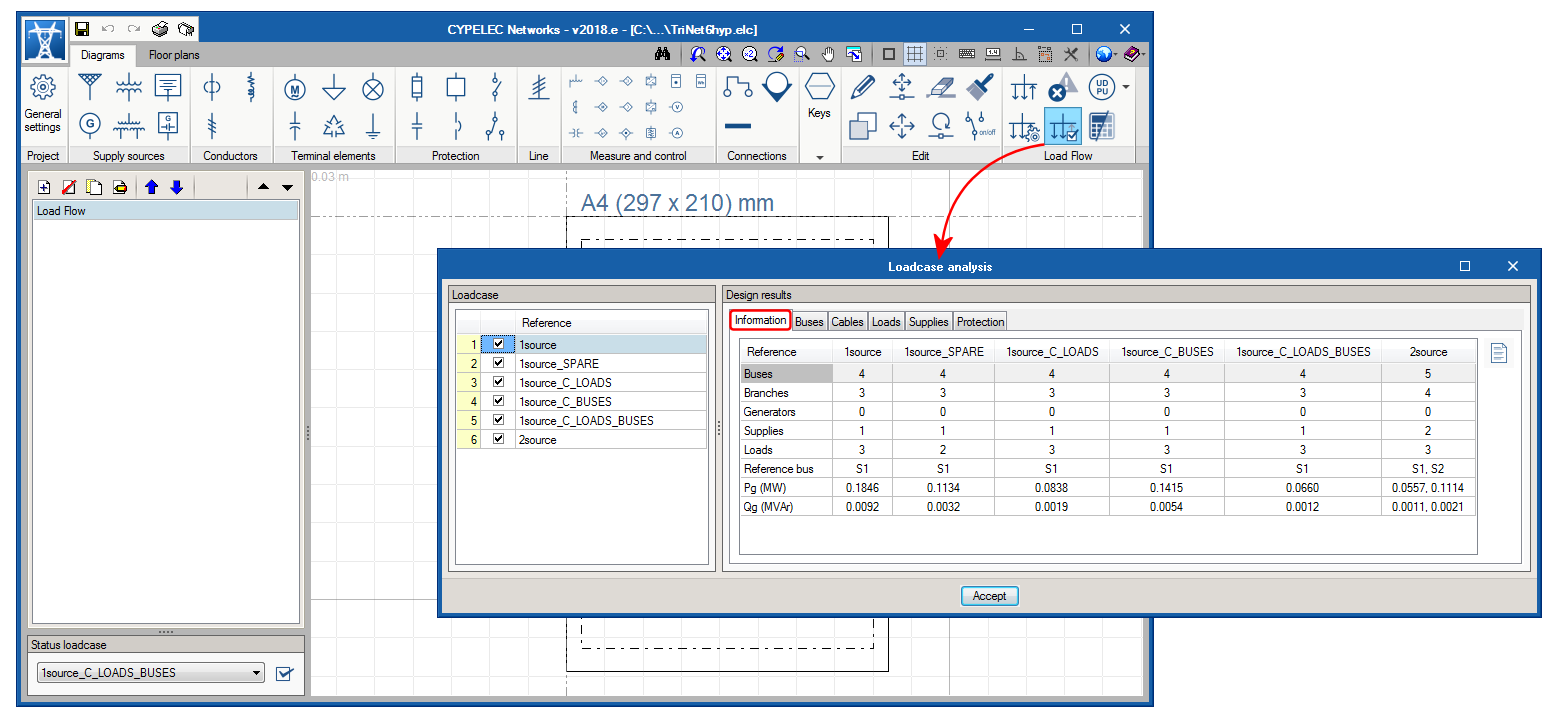
Now, in the 2018.e version, a powerful tool has been introduced to analyse all the loadcases that have been defined, which allows users to view the results of all the loadcases quickly and clearly. This tool allows users to obtain a global view of the results provided by the load flow analysis for all loadcases and aids them to adopt solutions to comply with the corresponding loadcases.
This tool is selected by pressing the “Loadcase analysis” button ![]() located in the “Load flow” section of the toolbar, which opens a panel containing the loadcases that have been defined and their corresponding analysis results, all of which is organised in several tabs:
located in the “Load flow” section of the toolbar, which opens a panel containing the loadcases that have been defined and their corresponding analysis results, all of which is organised in several tabs:
- Information tab
Shown in this tab are the design properties of the loadcases selected on the left, such as the number of buses, branches, generators, supplies and loads each loadcase consists of. The initial reference bus for the analysis of the load flow calculation is also specified as well as the resultant generation power.
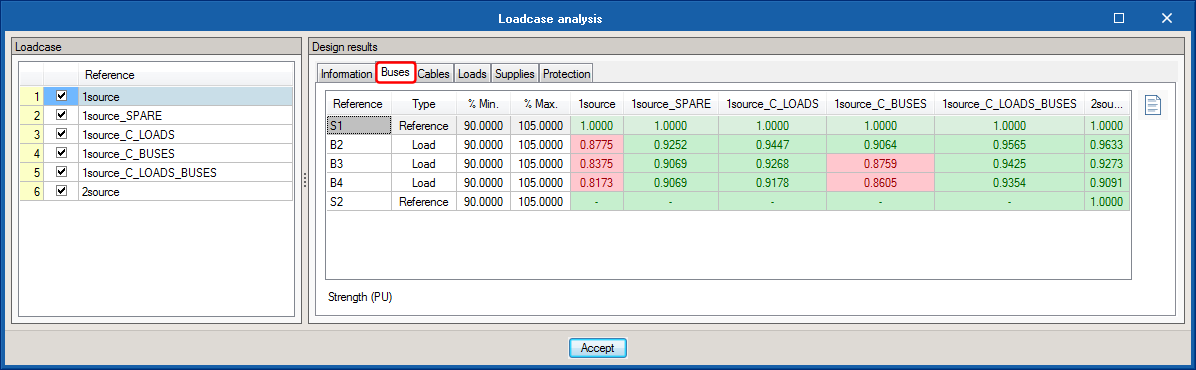
- Buses tab
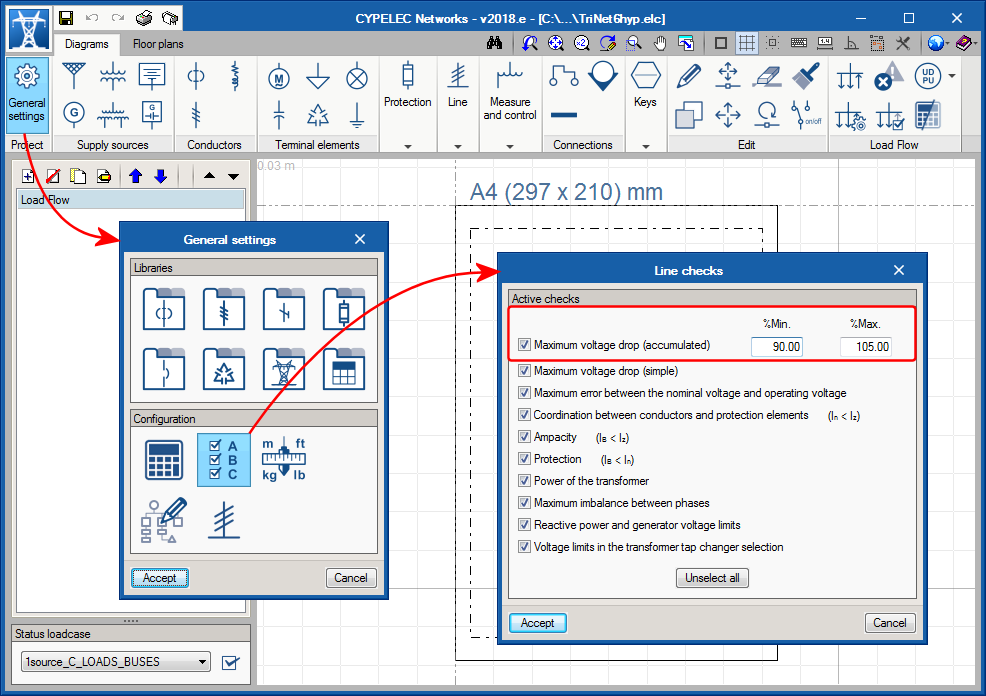
The resultant voltage values in PU in each bus for each loadcase are transferred here and are compared with the allowable accumulated voltage drop values that have been defined in General settings.
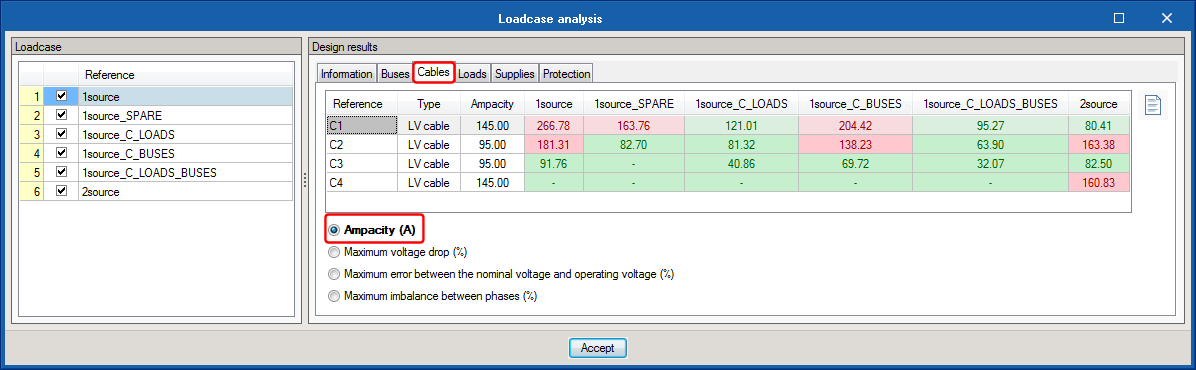
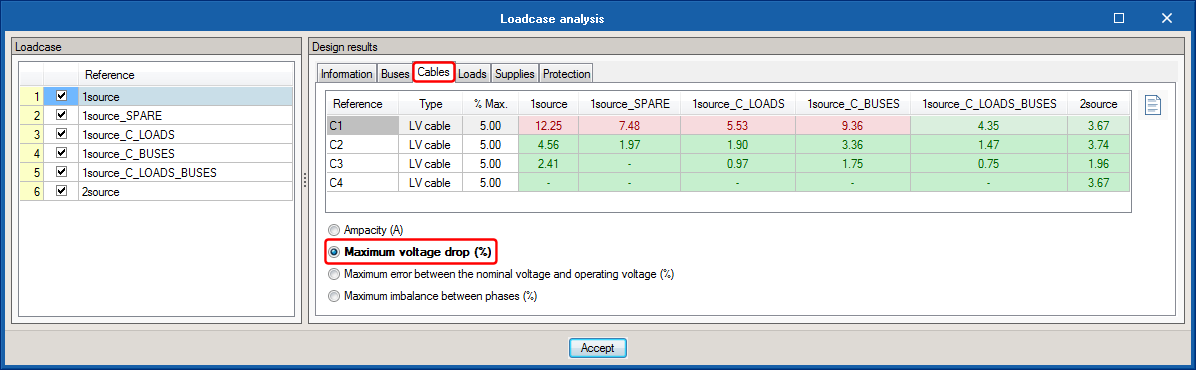
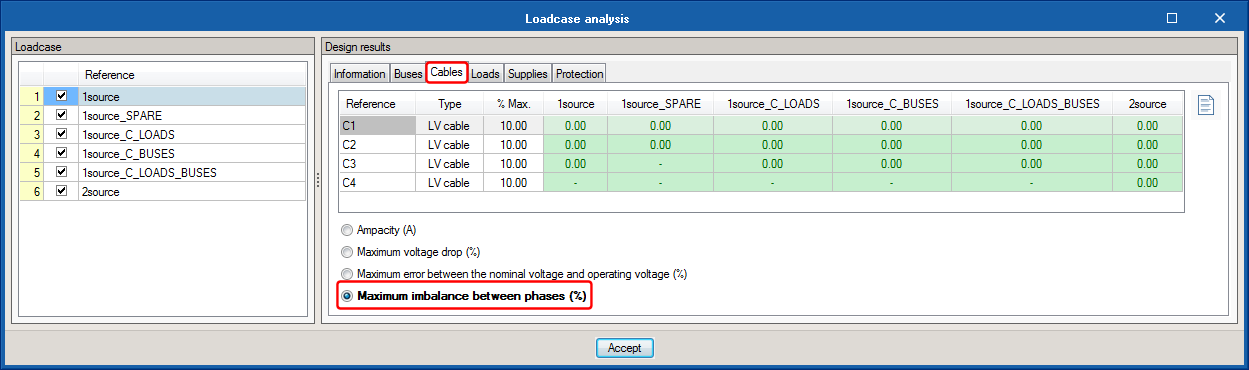
- Cables tab
The “Cables” tab is sub-divided into 4 sections:
Ampacity
Shows the resultant design current that flows through each cable or transmission line, and is compared with its ampacity.
Maximum voltage drop
Shows the resultant voltage drop due to the impedance and admittance of the cable or transmission line, and is compared with the maximum voltage drop that has been introduced in the Edit panel.
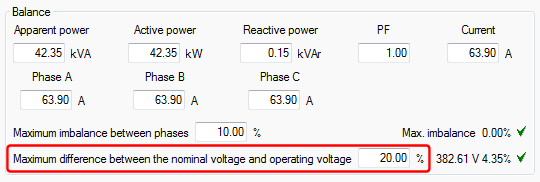
Maximum error between the nominal voltage and operating voltage (%)
Shows the percentage resultant error between the nominal voltage and operating voltage, and it is compared with the value that is introduced in the Edit panel of the cable or transmission line.


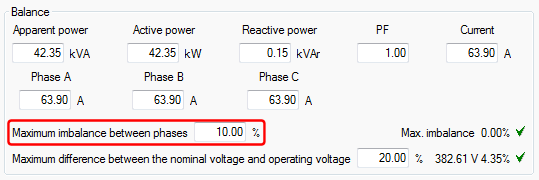
Maximum imbalance between phases (%)
Shows the percentage resultant imbalance between the most loaded phase and the least loaded, and is compared with the maximum imbalance value between phases that has been introduced in the Edit panel of the cable or transmission line.
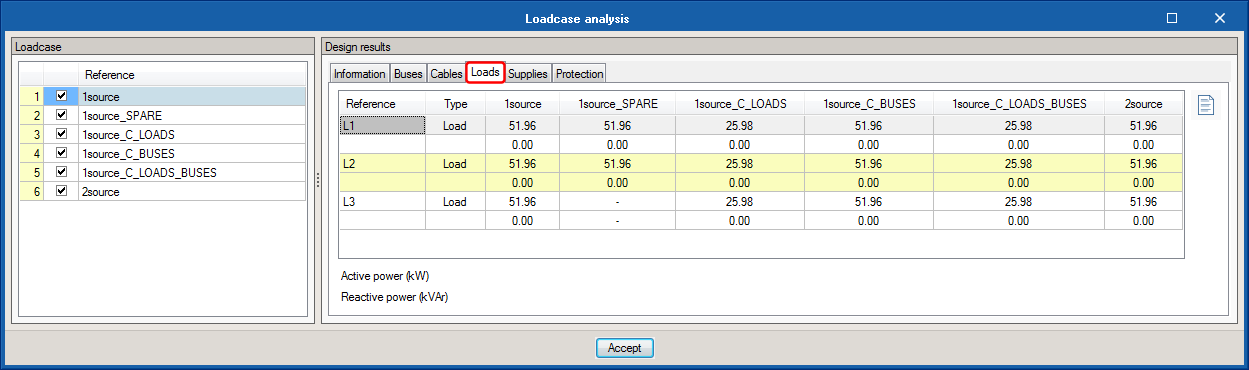
- Loads tab
Here, represented for each loadcase, are the values of the active and reactive power of the loads, which are affected by the use and simultaneity criteria specified for each loadcase.
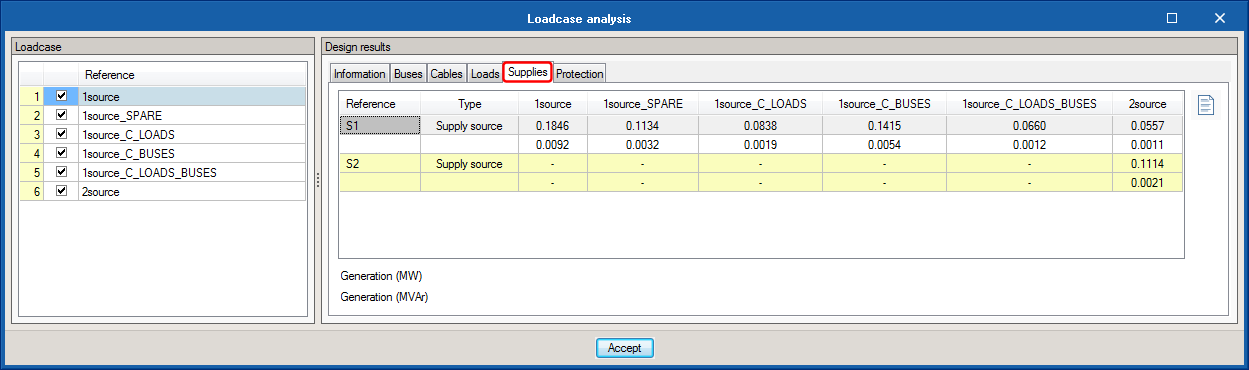
- Supplies tab
The resultant values of the active and reactive power generated by each supply are displayed for each loadcase, in accordance with the load flow calculation.
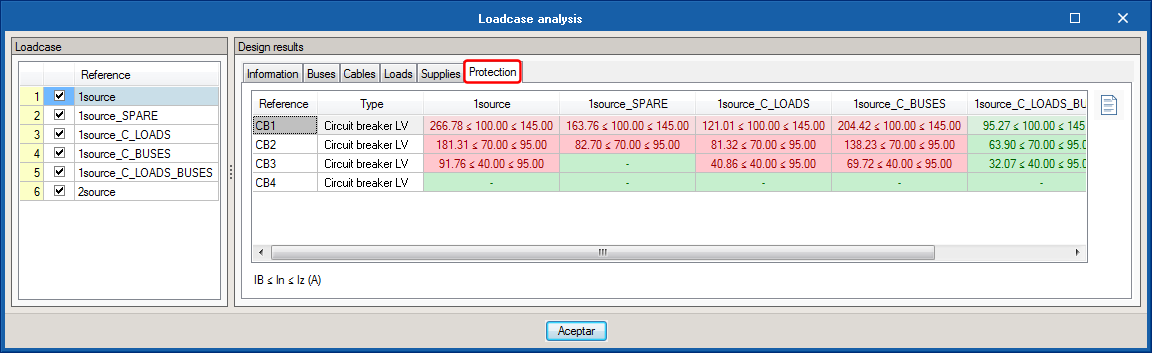
- Protection tab
Also for each loadcase, represented in this tab is the check that relates the nominal or protection regulating current, with the design current of the line and ampacity of the cable it protects.