
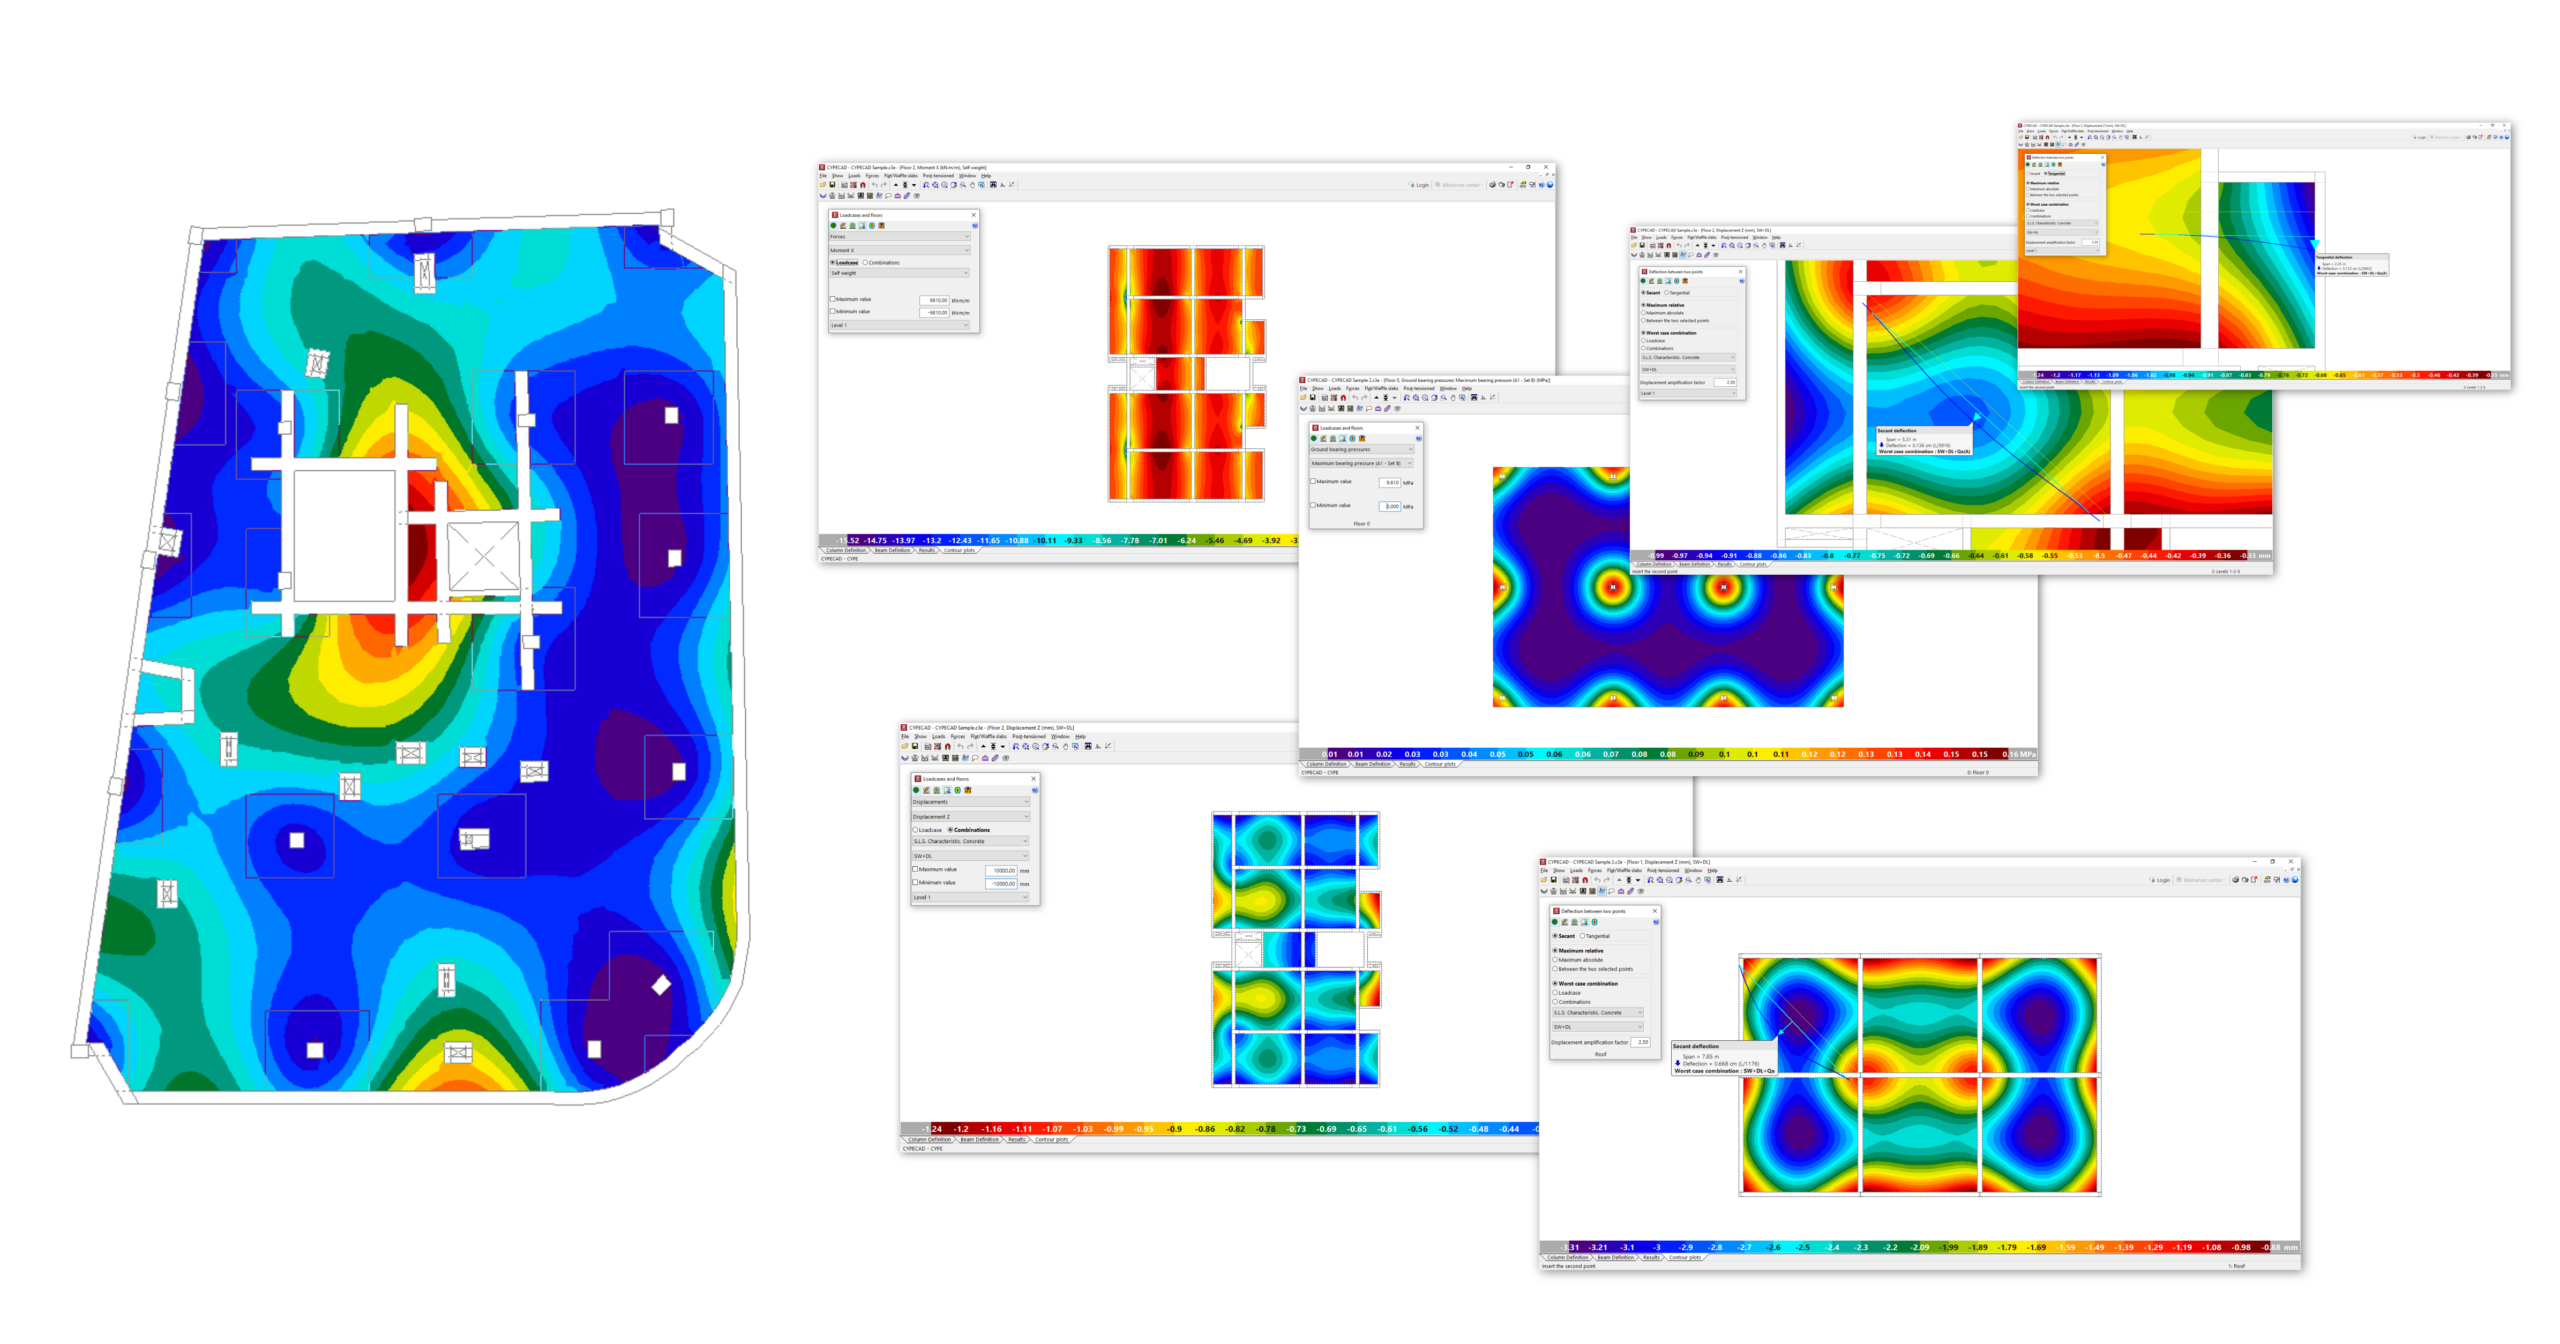
Options in the "Contour plots" tab
The "Contour plots" tab provides a specific environment for viewing the analysis results for slabs and two-way slabs in the form of contour plot diagrams of forces, displacements and quantities.
You can also check the arrow between two points or the average value of different magnitudes between two points or within a band.
The following link provides detailed information on the options offered by the program under the "Contour plots" tab: