
Information at the "Zone" level
If a zone is selected in the tree, the program displays the "Results analysis" drop-down menu, which allows the following information to be displayed on the right-hand side of the program interface, depending on the selection made:
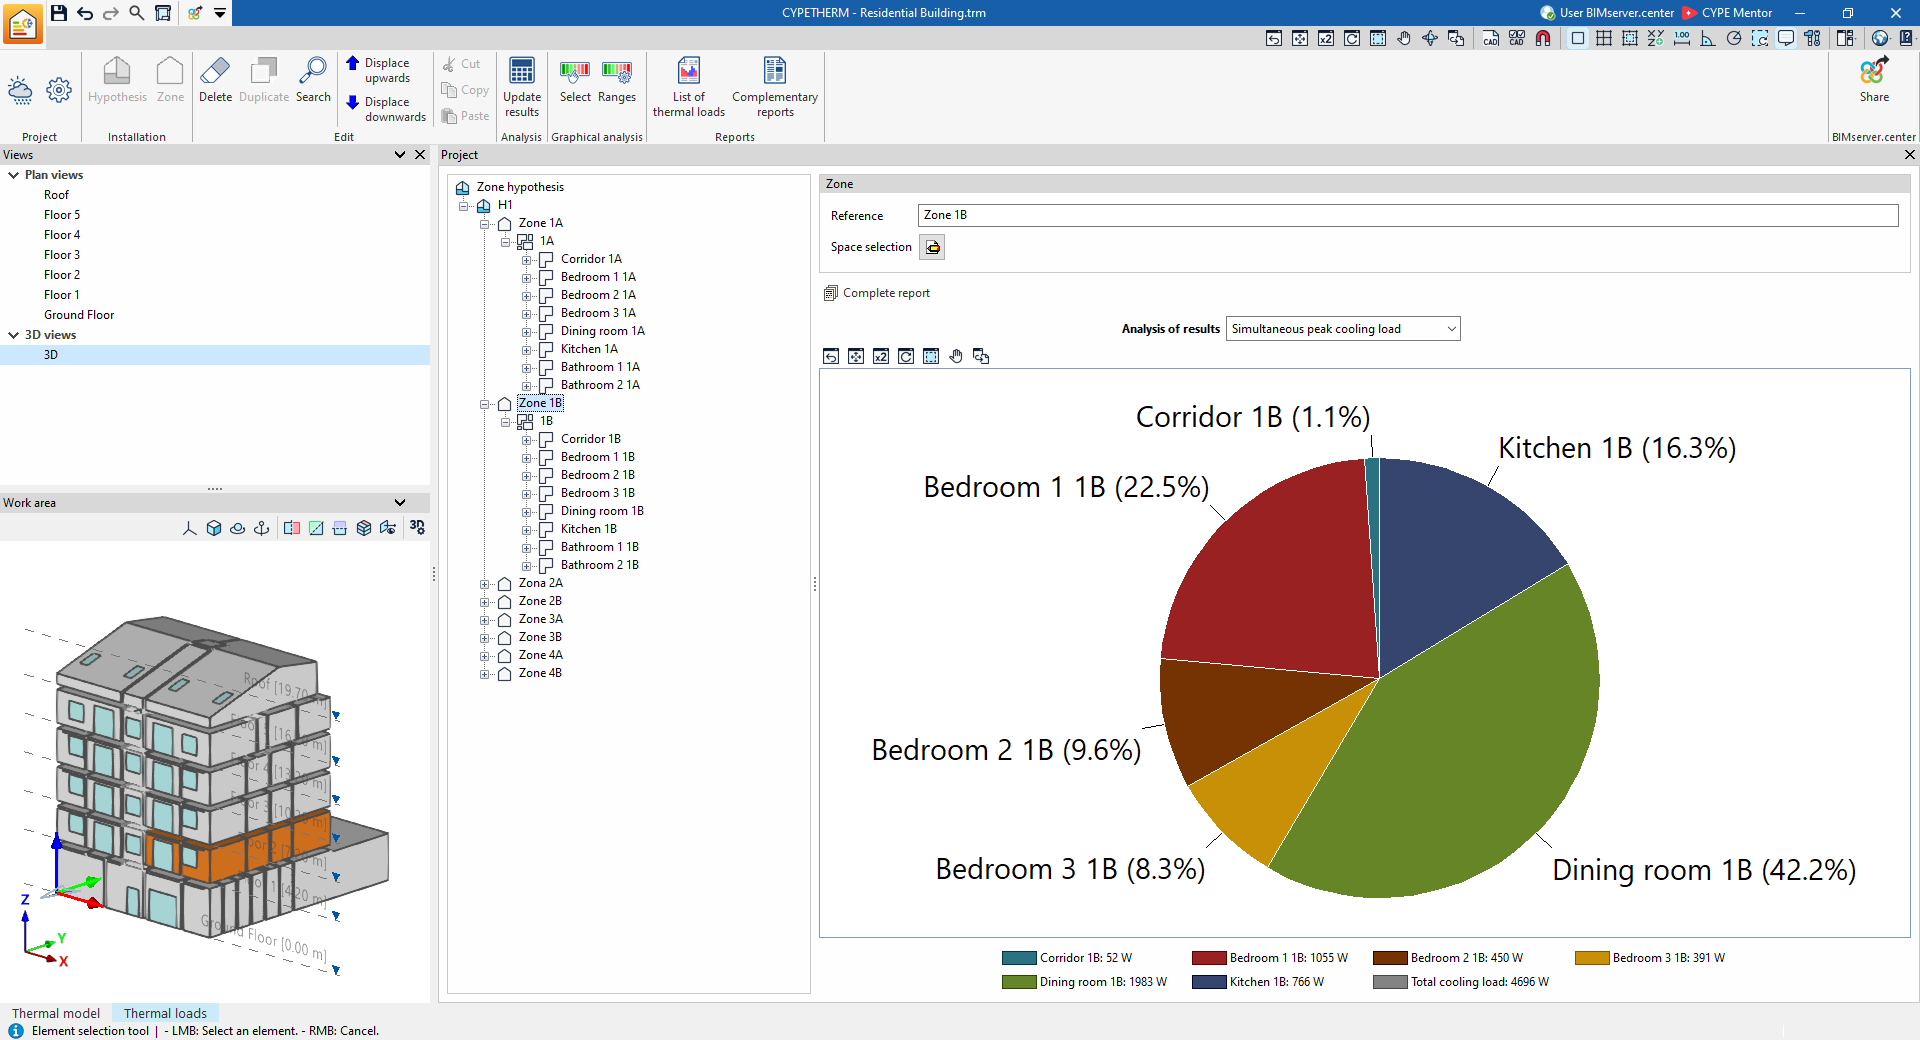
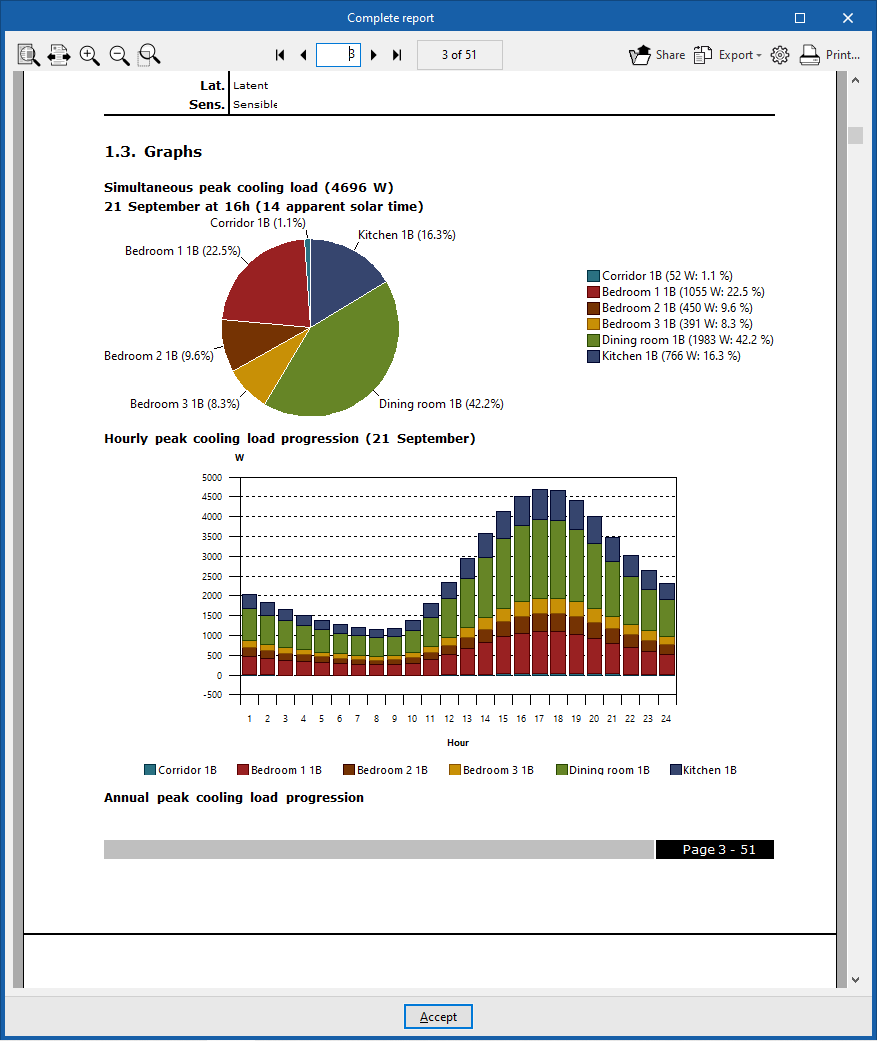
- Time of peak simultaneous cooling load
Displays a pie chart showing the absolute values of cooling heat loads and the percentage contribution of each space to the total cooling heat load for the zone.
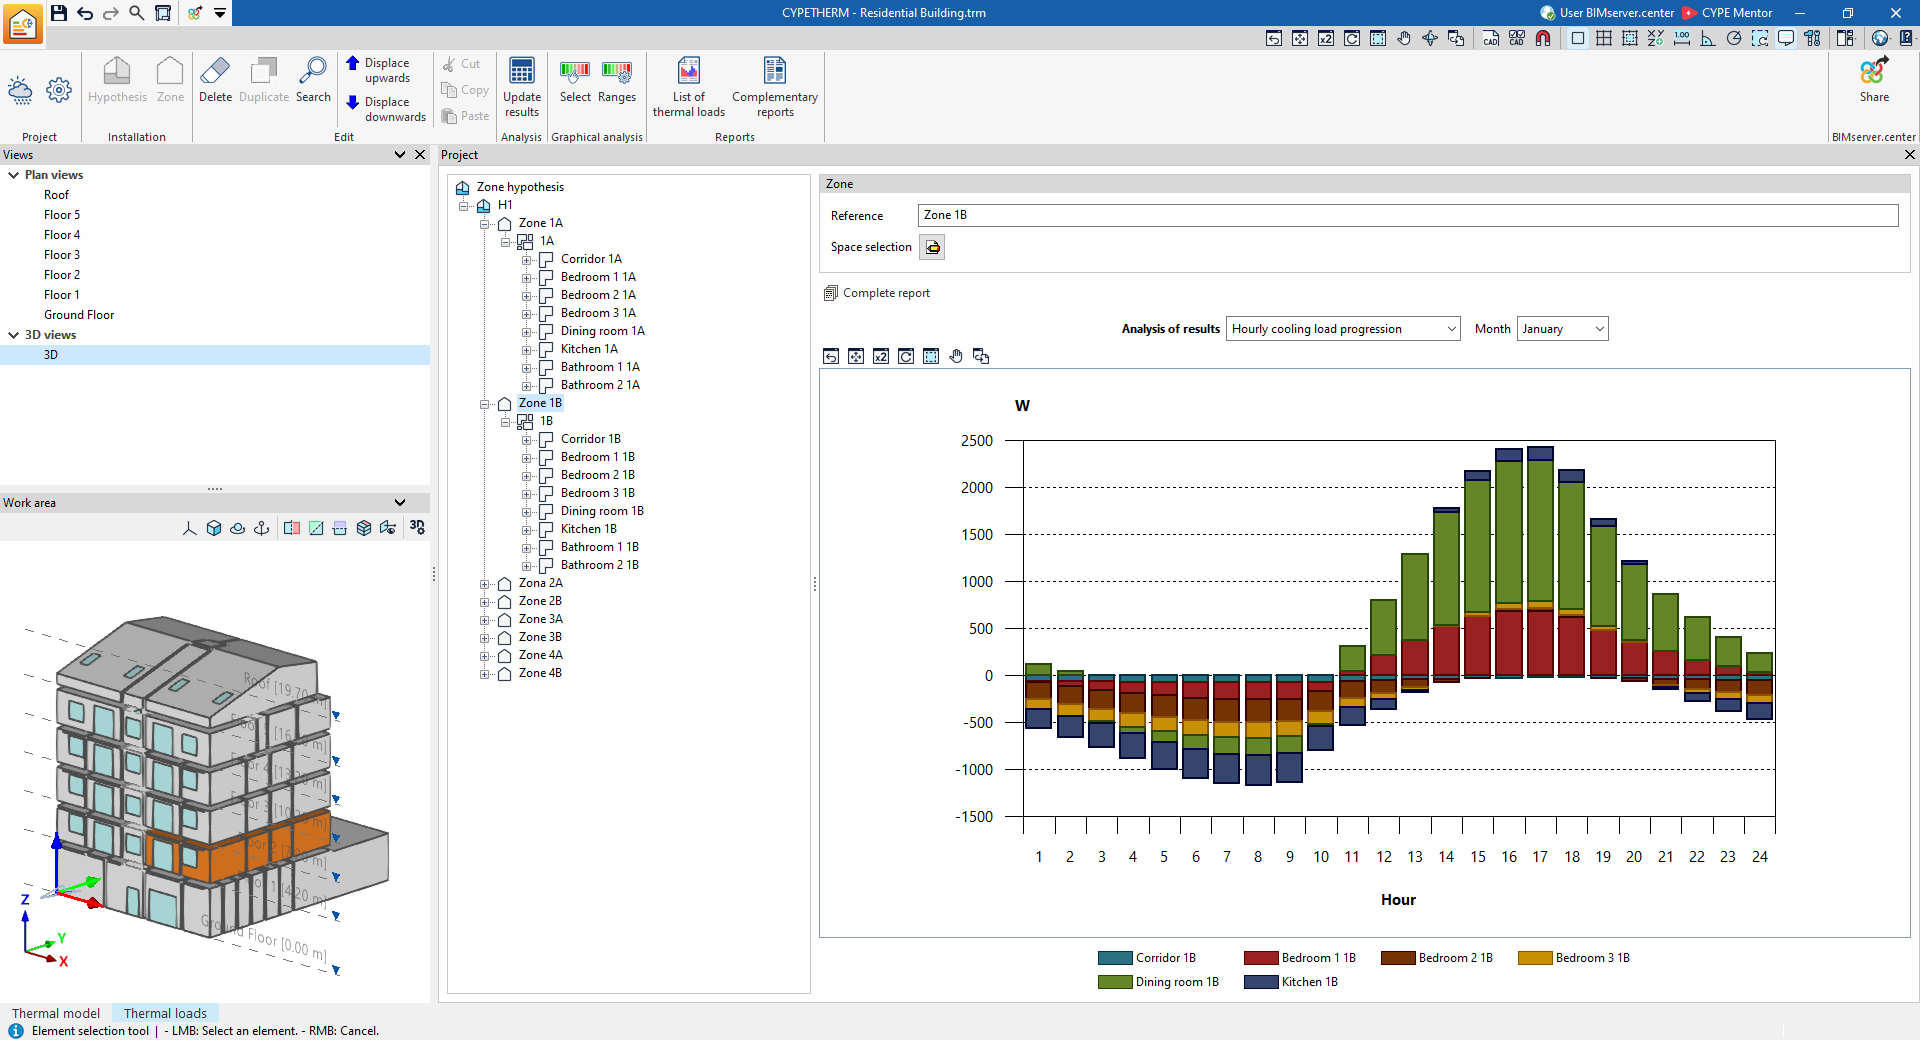
- Hourly cooling load progression (for each month)
Displays a bar chart showing the values, broken down by space and aggregated by the hour, of the cooling loads for the spaces in the area.
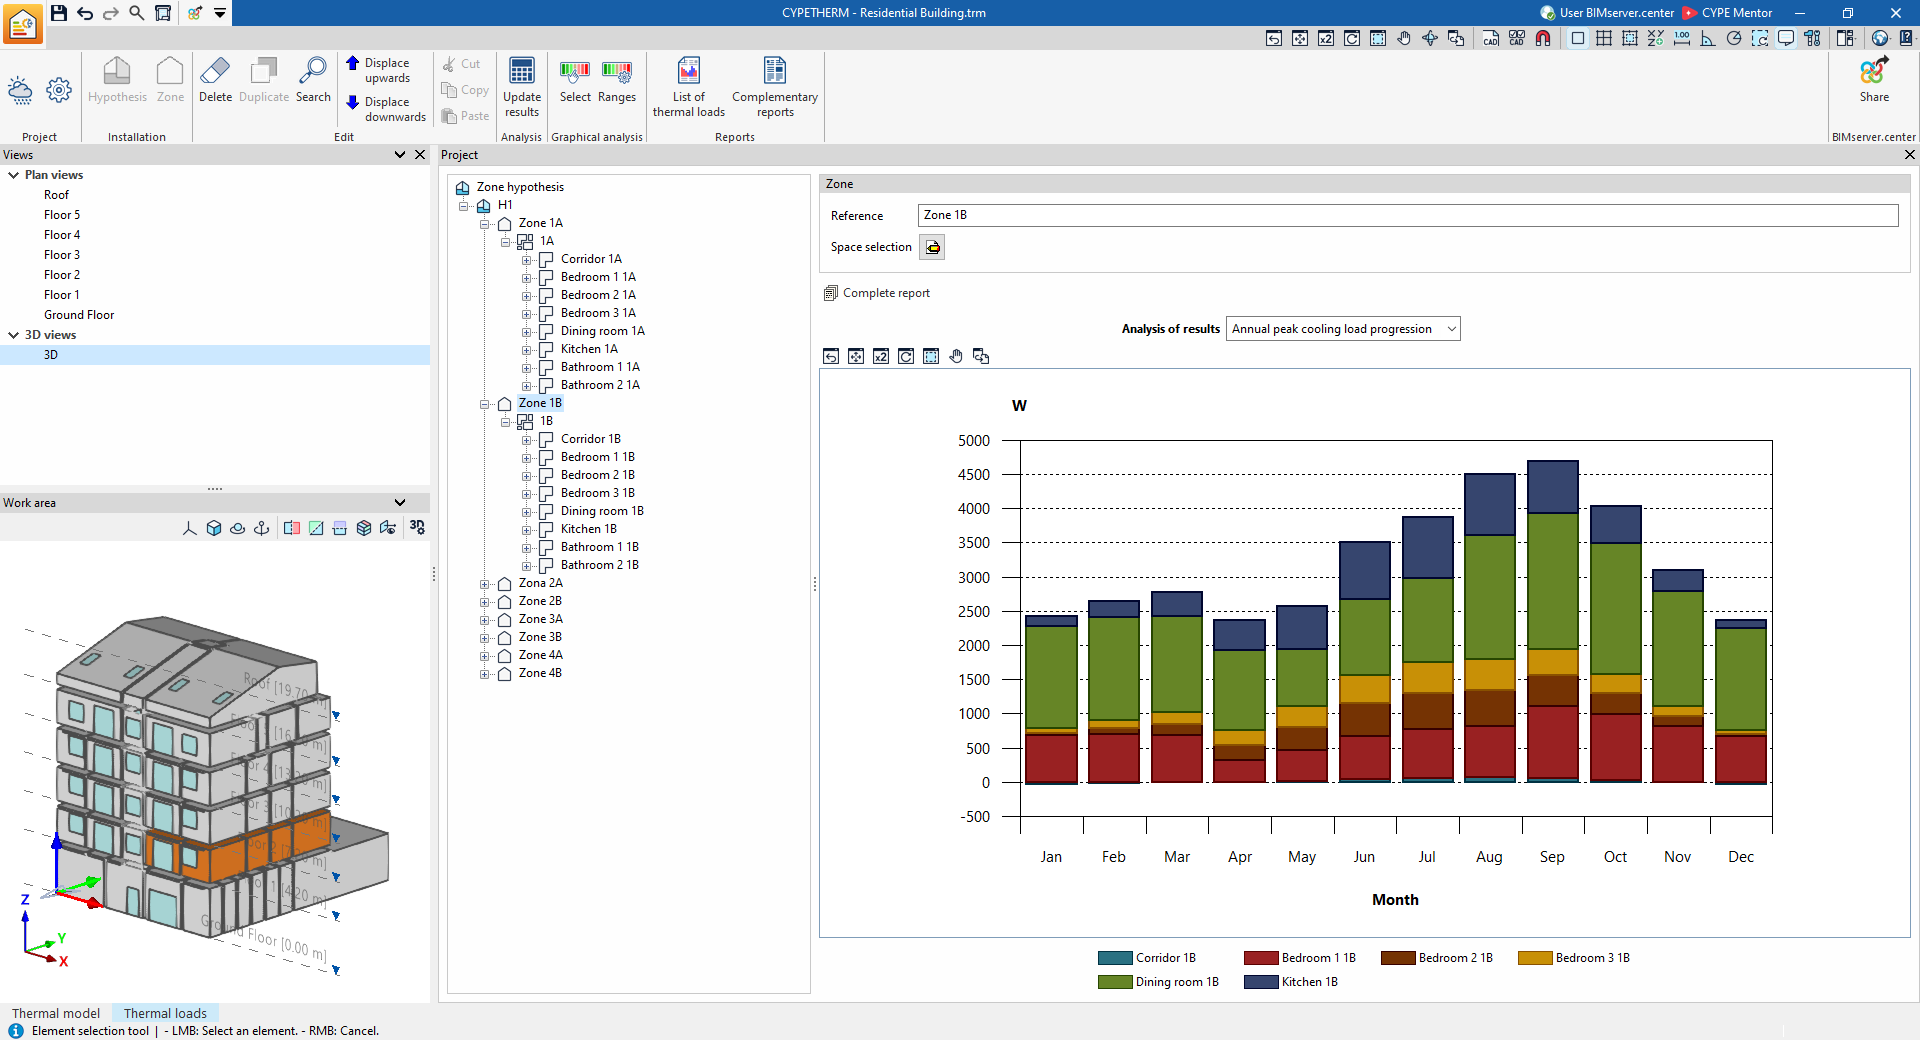
- Annual peak cooling load progression
Displays a bar chart showing the values, broken down by space and aggregated by month, of the cooling loads for the spaces in the zone.
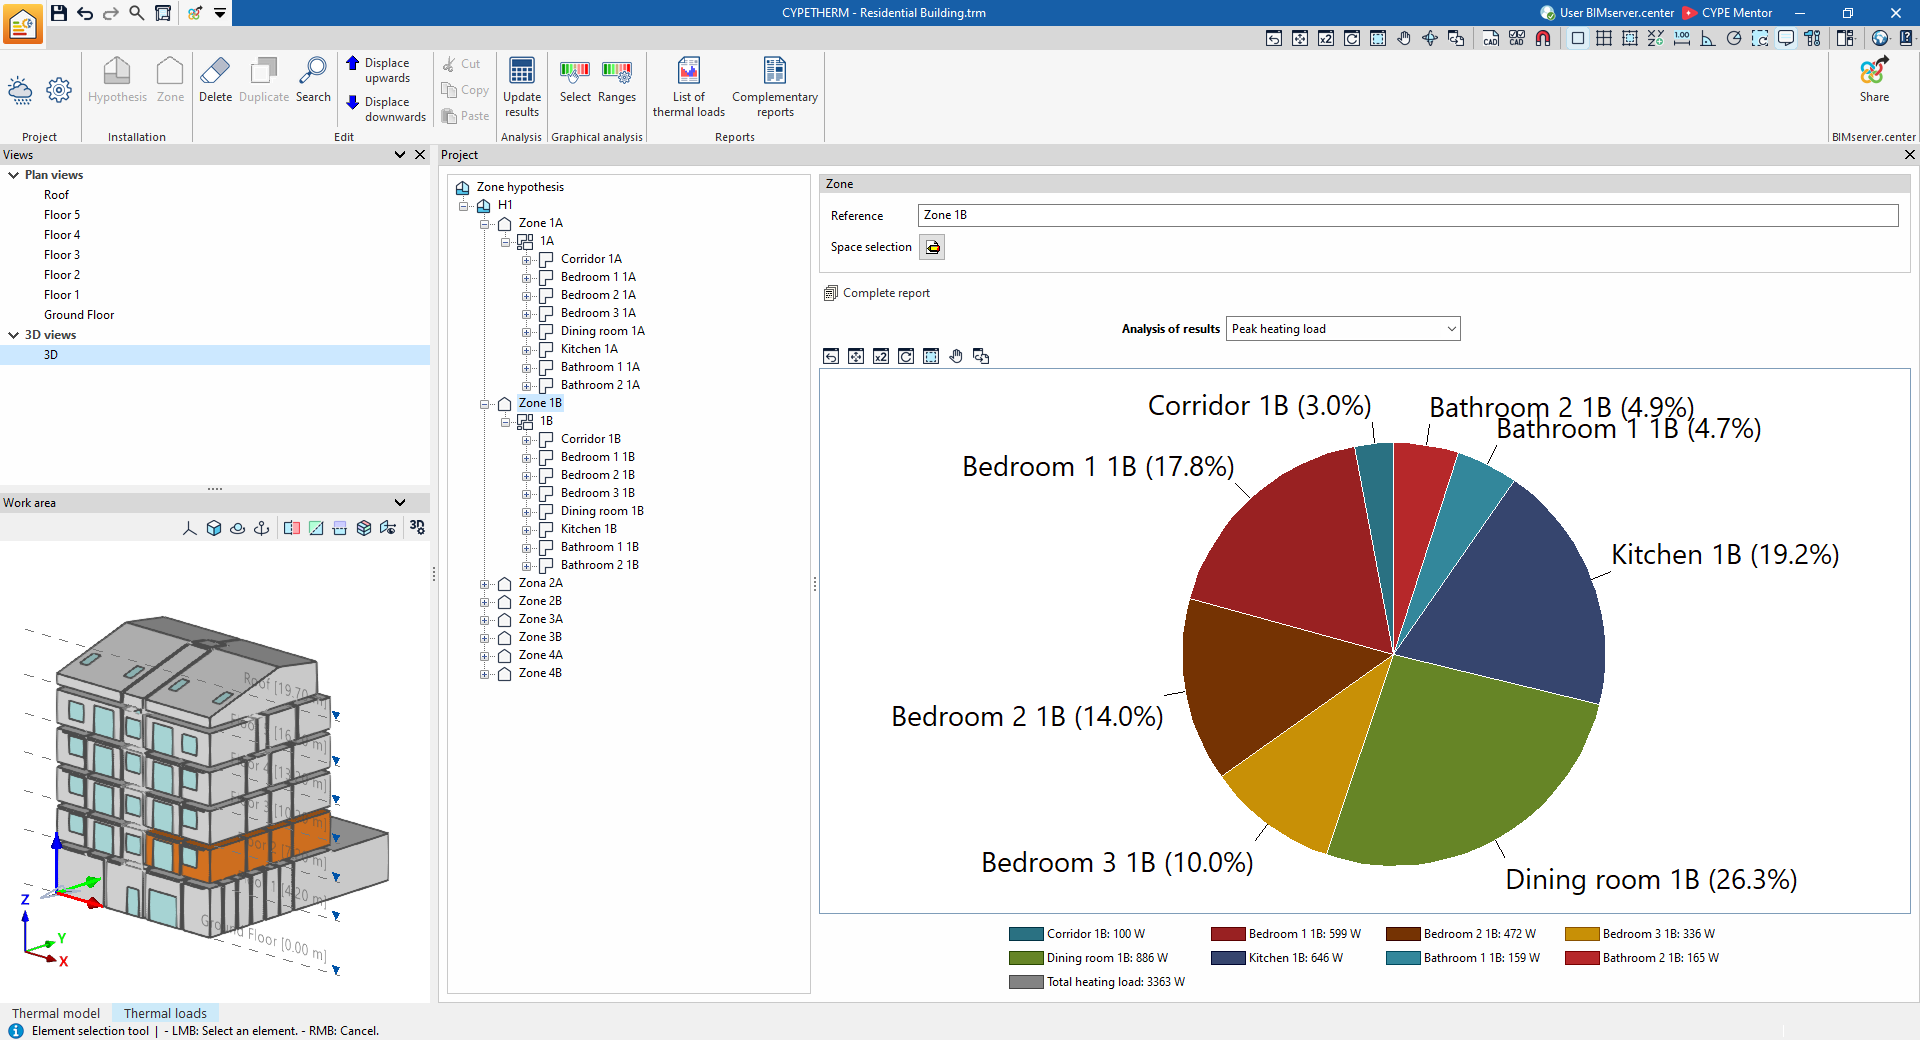
- Maximum heating load Displays a pie chart showing the absolute values of the heating thermal loads and the percentage contribution of each space to the total heating thermal load for the area.
- Overview calculations
Displays an informative text with details on how the maximum simultaneous load for the zone is calculated.
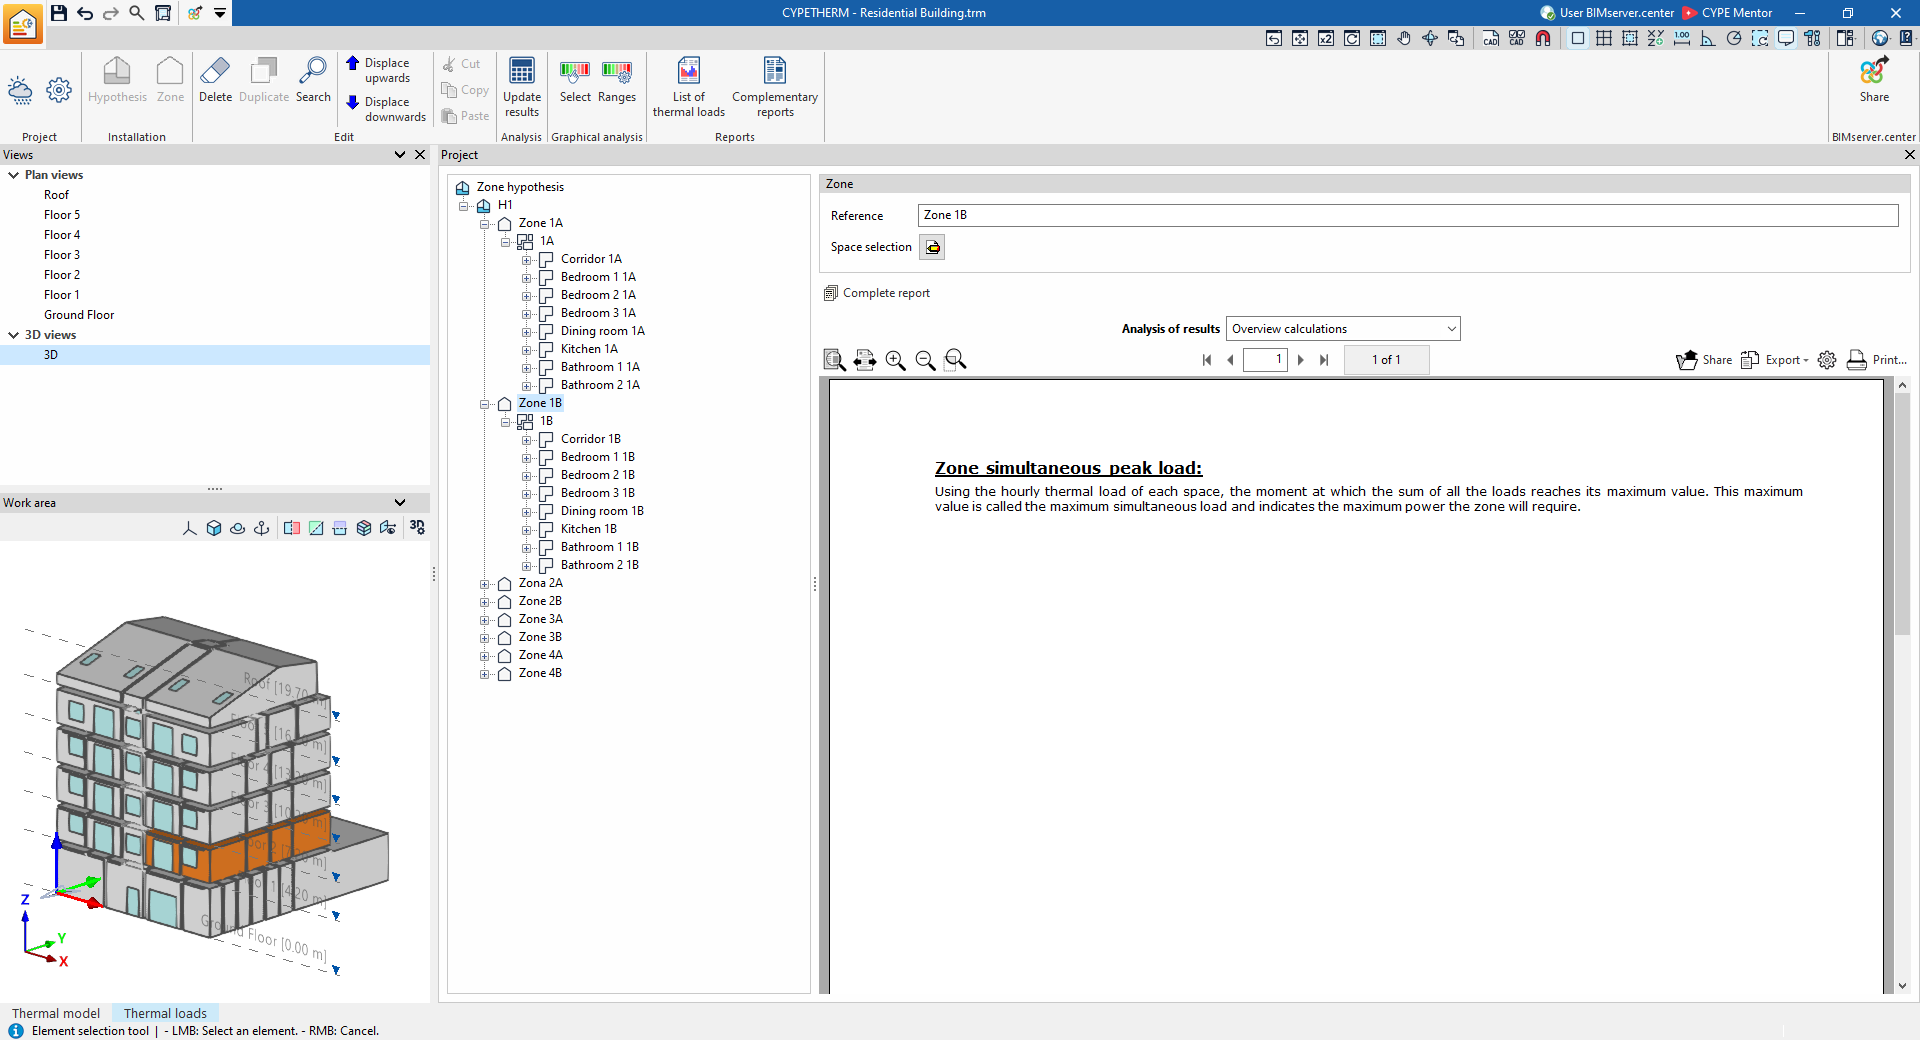
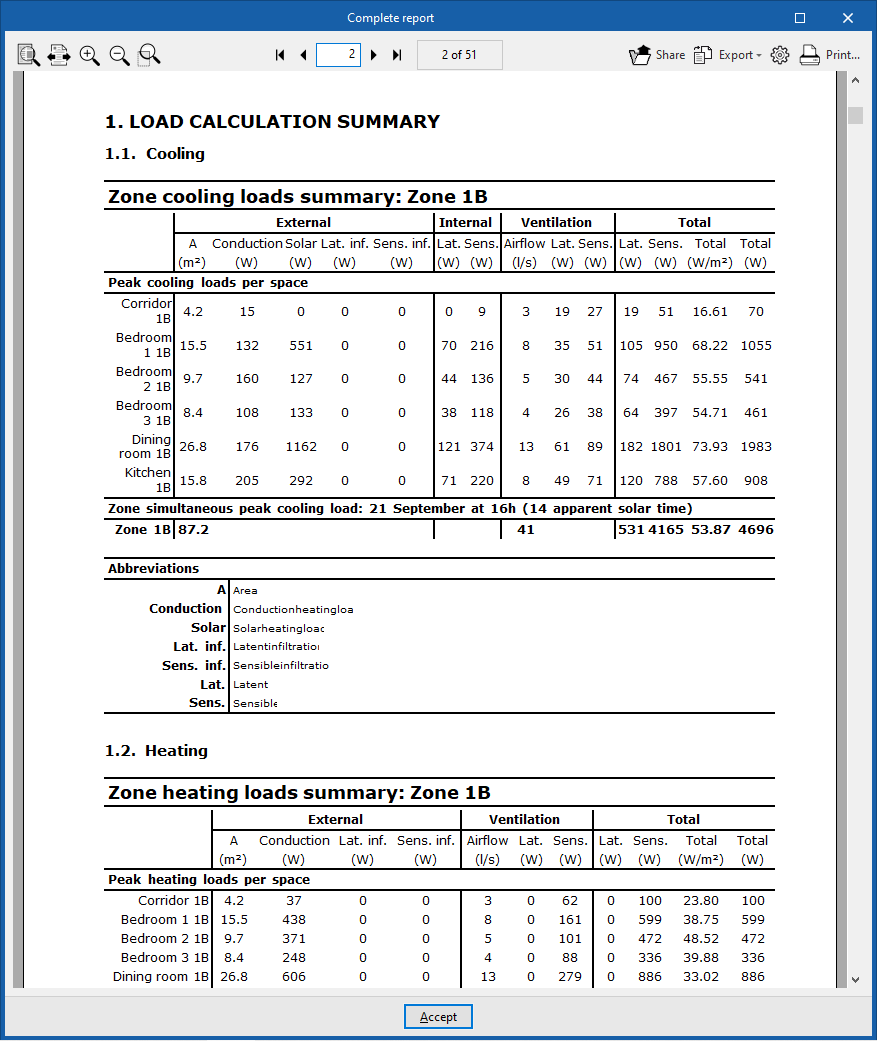
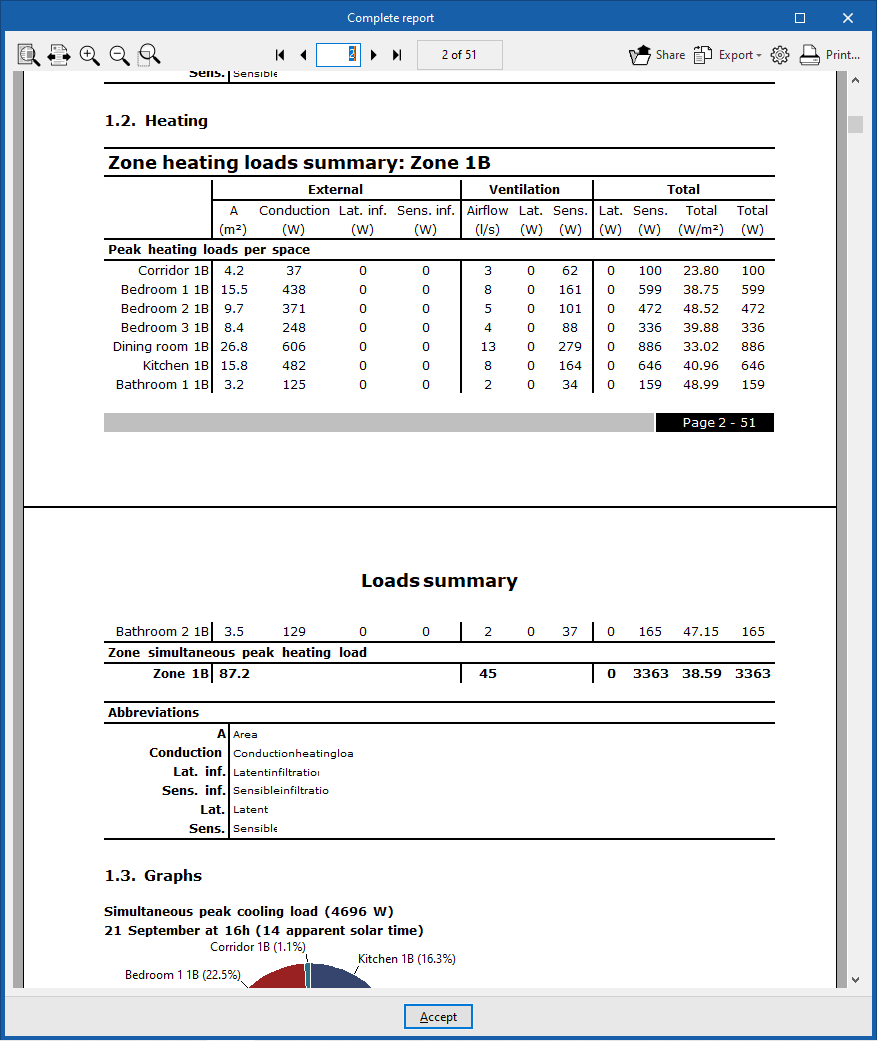
Furthermore, using the "Complete report" option, you can generate a "Thermal load report" for both the selected area and all the spaces within it, which contains the following information:
- Load calculation summary (by zone)
- Refrigeration
- Zone cooling loads summary (External, Internal, Ventilation, Total)
- Peak cooling loads per space
- Zone simultaneous peak cooling load
- Zone cooling loads summary (External, Internal, Ventilation, Total)
- Heating
- Zone heating loads summary (External, Ventilation, Total)
- Peak heating loads per space
- Zone simultaneous peak heating load
- Zone heating loads summary (External, Ventilation, Total)
- Graphs
- Simultaneous peak cooling load
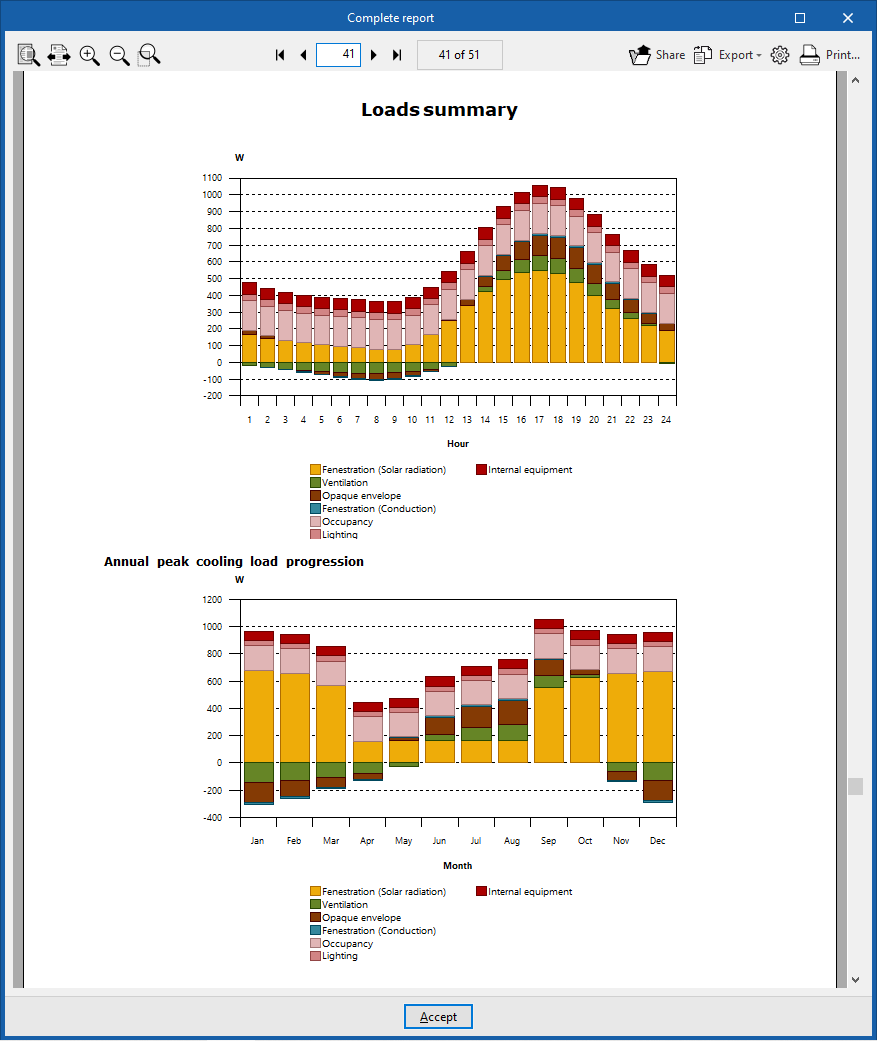
- Hourly peak cooling load progression
- Annual peak cooling load progression
- Peak heating load
- Refrigeration
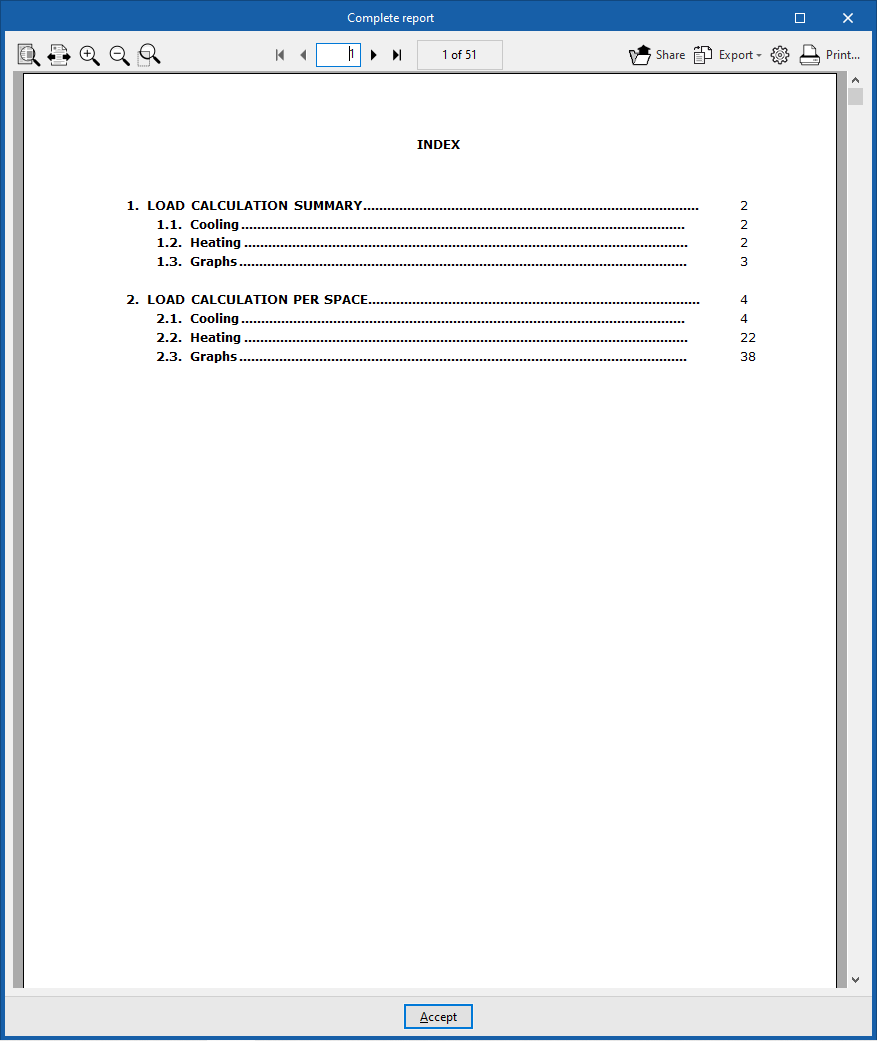
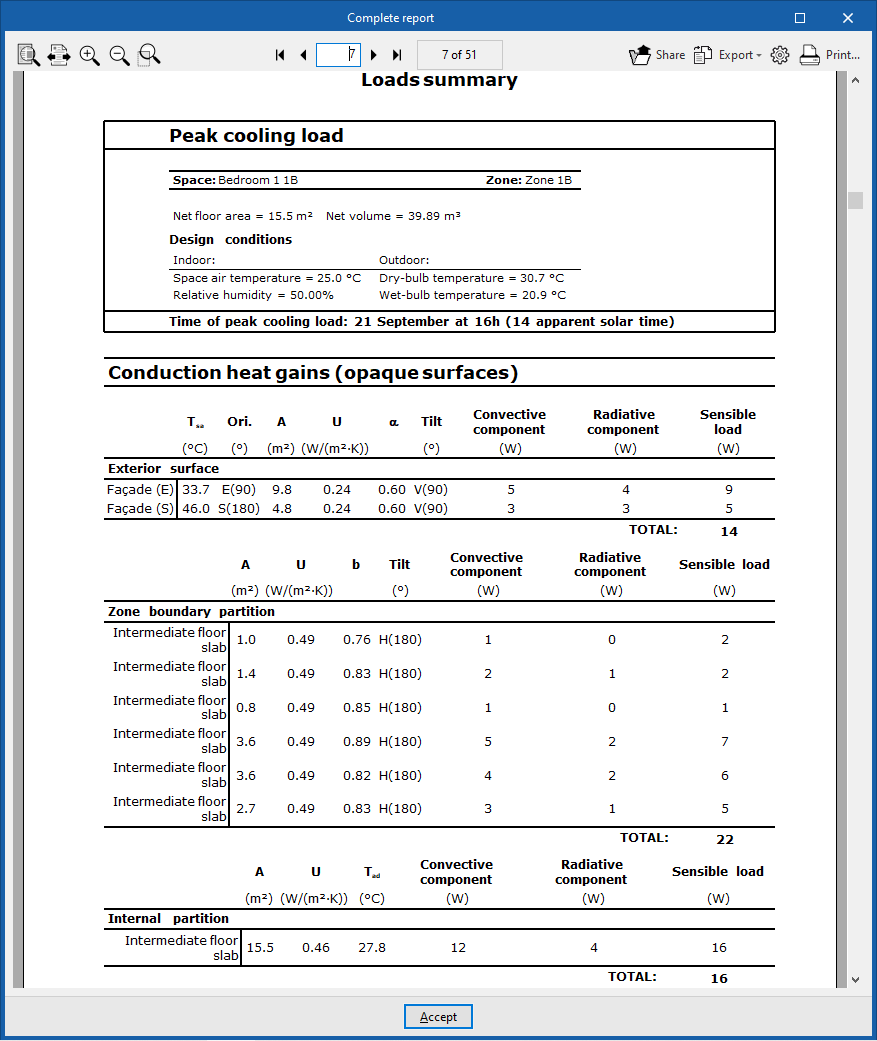
- Load calculation summary (by space)
- Refrigeration
- Peak cooling load
- Conduction heat gains (opaque surfaces)
- Conduction heat gains (openings)
- Internal heat gains
- Ventilation and infiltration heat gains
- Total cooling load
- Peak cooling load
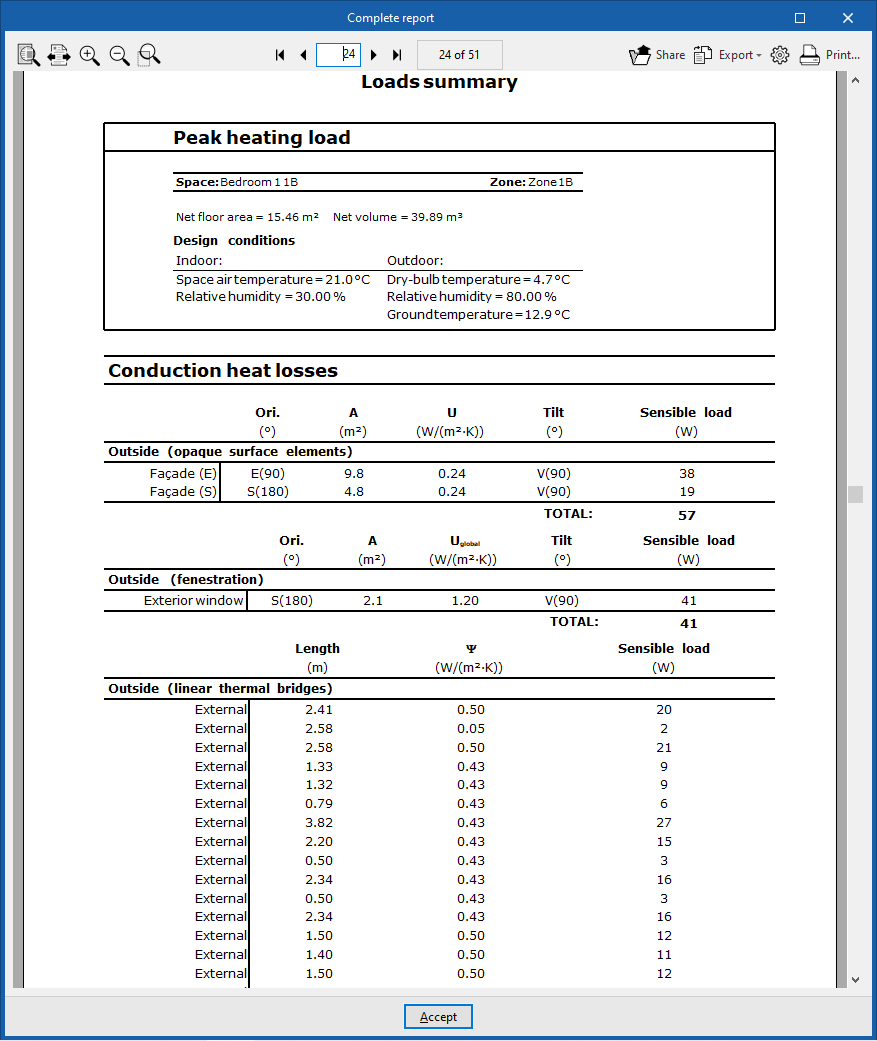
- Heating
- Peak heating load
- Heat losses due to conduction
- Conduction heat losses
- Ventilation and infiltration heat losses
- Total heating load
- Peak heating load
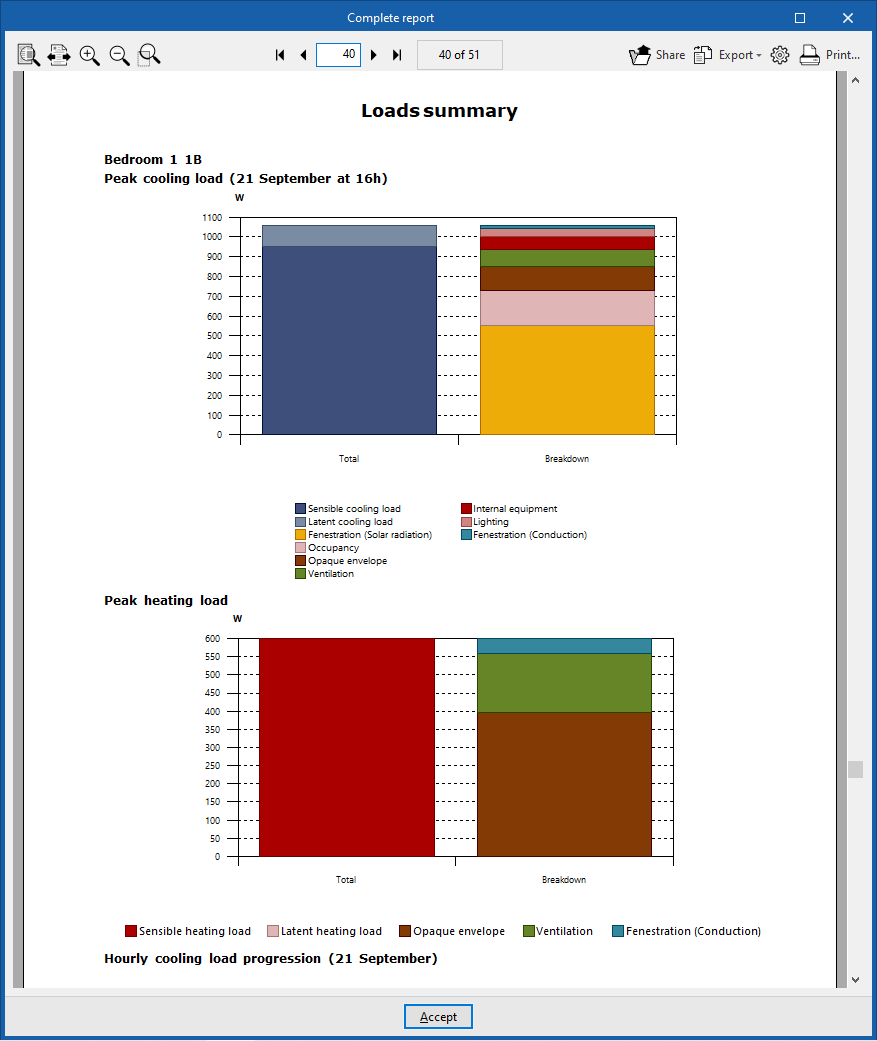
- Graphs
- Peak cooling load
- Peak heating load
- Hourly cooling load progression
- Annual peak cooling load progression
- Refrigeration