Results output
In the "Results" group of the main toolbar, under the "Installation" tab, there are options for obtaining information on the analysis results of the installation:

Analysis results can also be obtained in the following ways:
Checking the results on screen
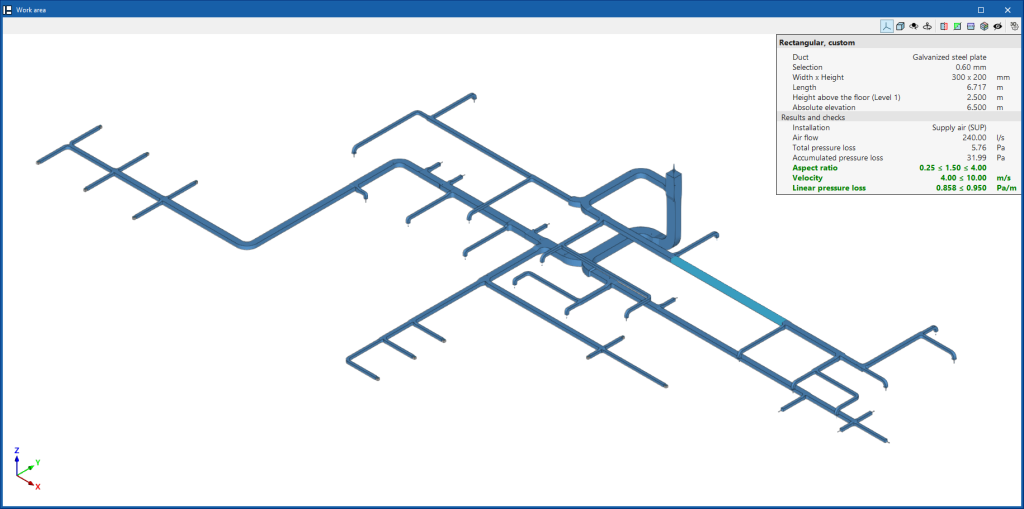
After the analysis, CYPEHVAC displays the results in the tooltip or information text that appears when the cursor is positioned on an element in the system, and the compliance of the checks carried out on it. To do this, the "Show information texts" option in the top right-hand toolbar must be checked.
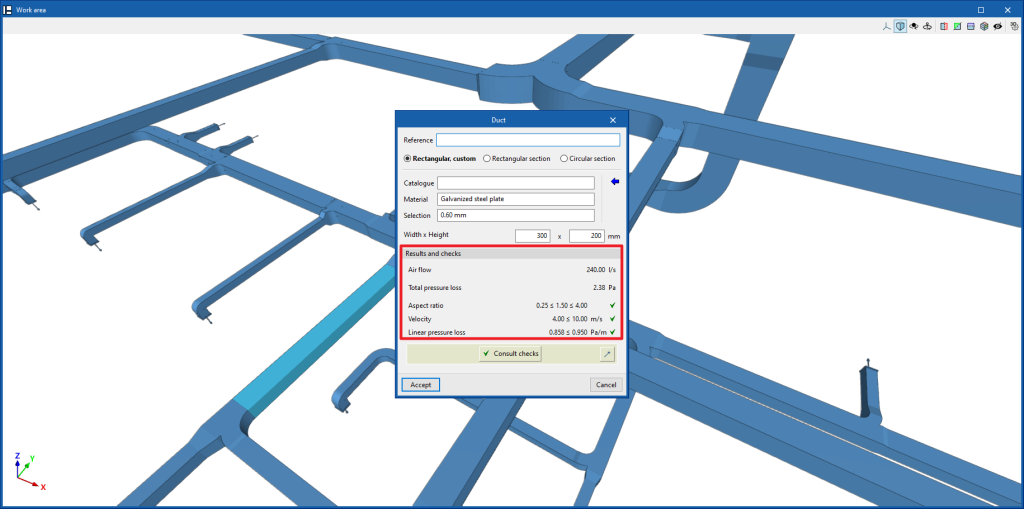
Results and checks
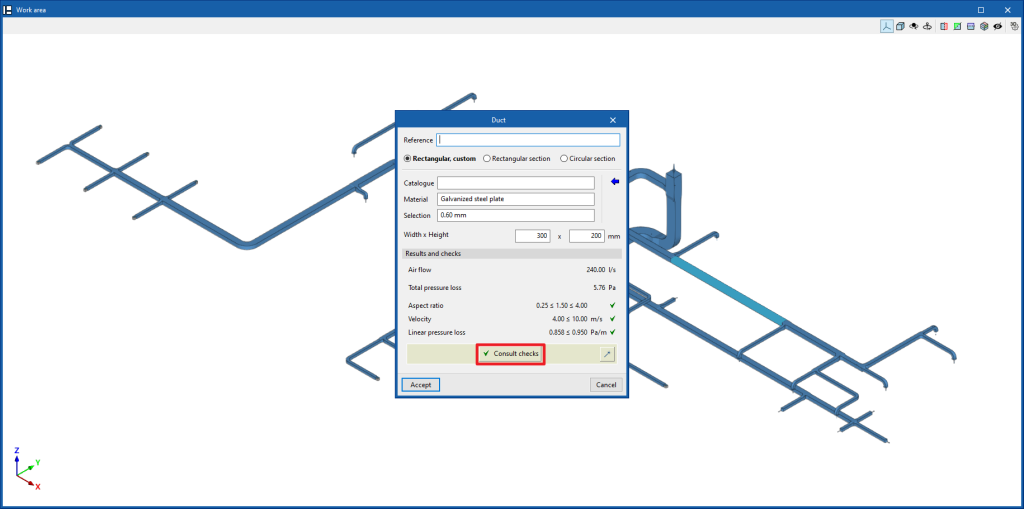
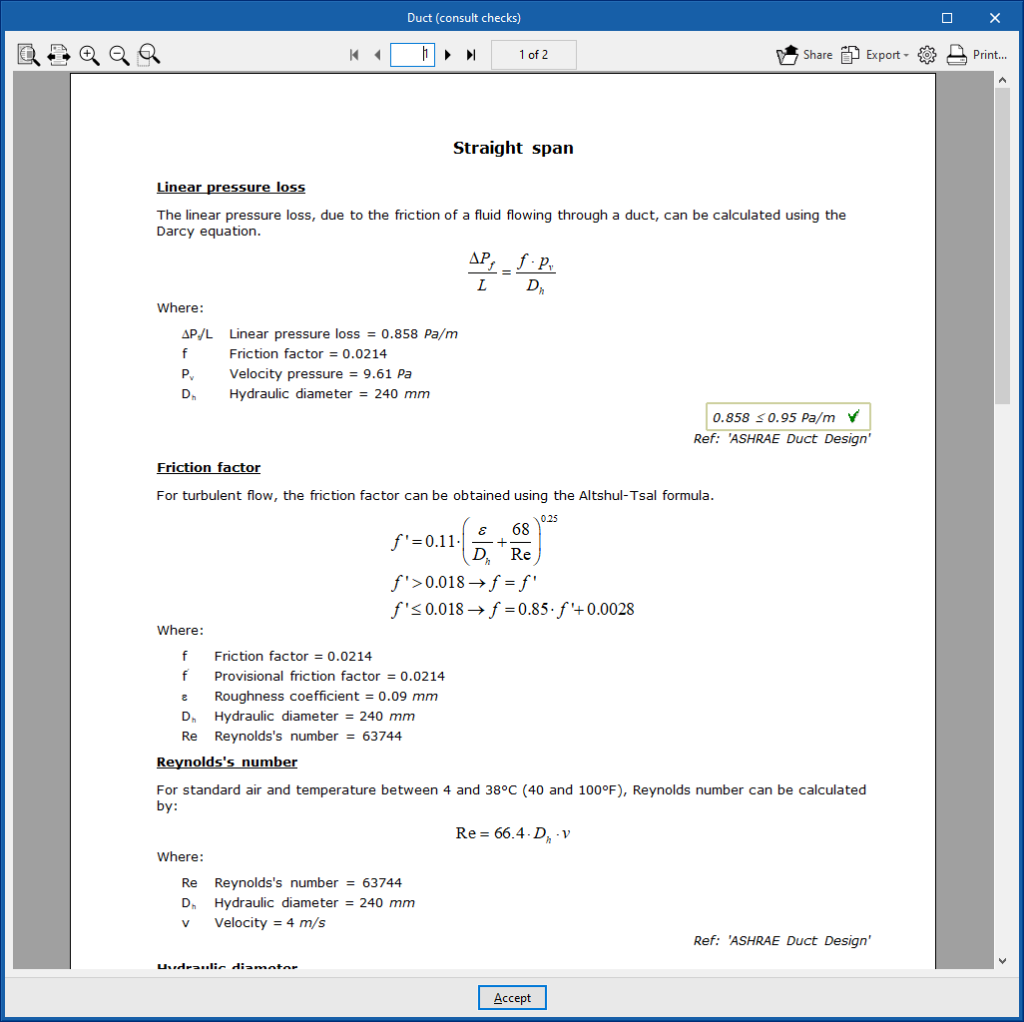
The program also displays the "Results and checks" of the last analysis carried out in the corresponding section of the edit panel of each element, as well as its compliance status.
Graphical analysis of results
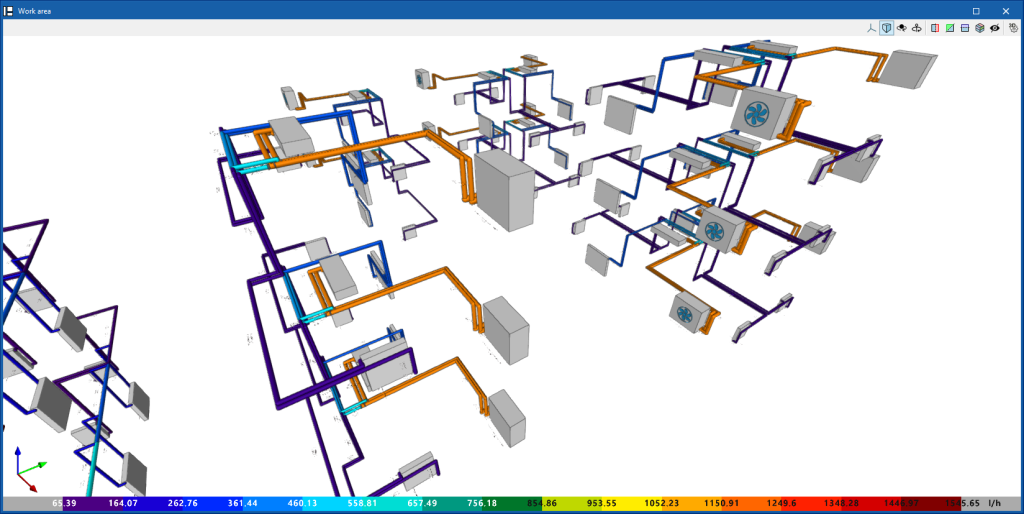
By means of the "Graphical analysis of results" option in the "Results" group of the main toolbar, the analysed values of different magnitudes are displayed by colouring the sections of the water distribution system.
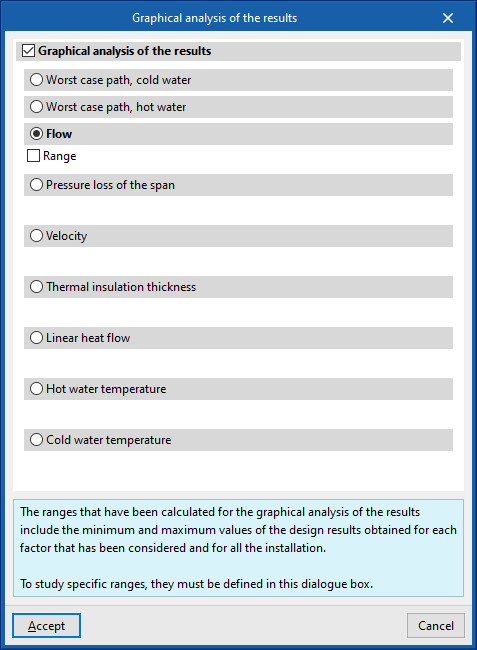
By default, the program displays the minimum and maximum values of each factor obtained in the analysis for the entire system. However, the colour scale can be adjusted according to the specific ranges of minimum and maximum values defined in the corresponding dialogue box.
The results available in the graphical analysis of results are as follows:
- Worst case path, cold water
- Worst case path, hot water
- Flow
- Pressure loss of the span
- Velocity
- Thermal insulation thickness
- Linear heat flow
- Hot water temperature
- Cold water temperature
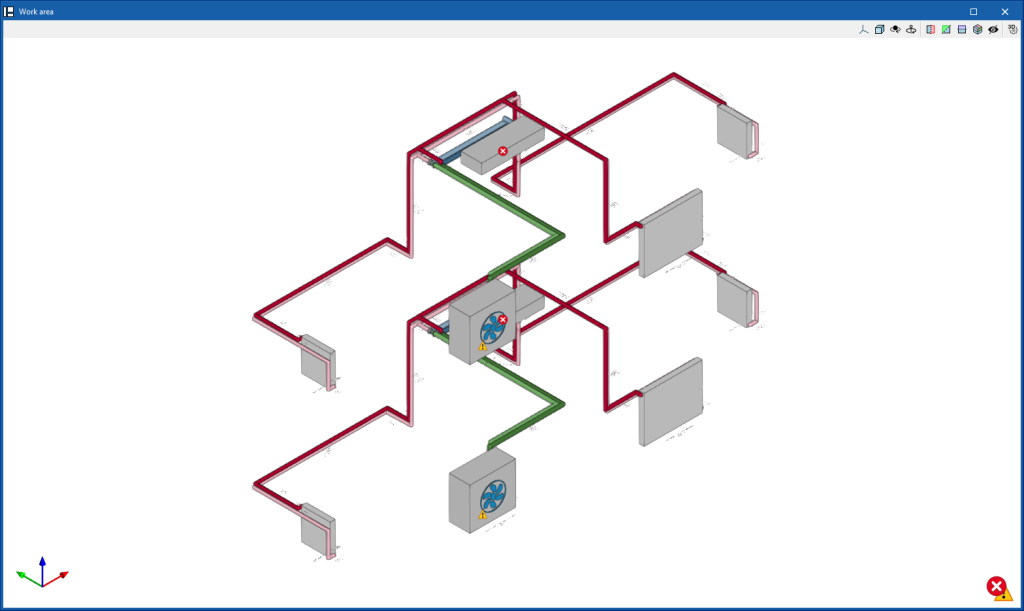
Show/Hide incidents
If this option is activated, the elements in which an error has occurred are highlighted. By positioning the cursor on these elements, the message describing the error can be displayed.
Job reports
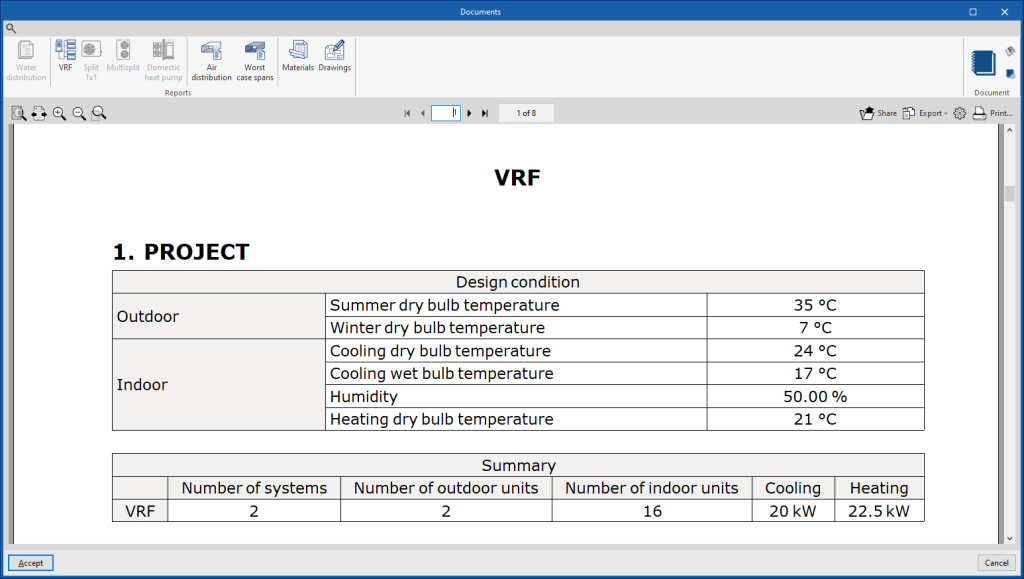
The program can print the reports directly or generate HTML, PDF, TXT, RTF or DOCX files.
Reports are obtained via the "Reports" option in the "Results" group of the main toolbar.
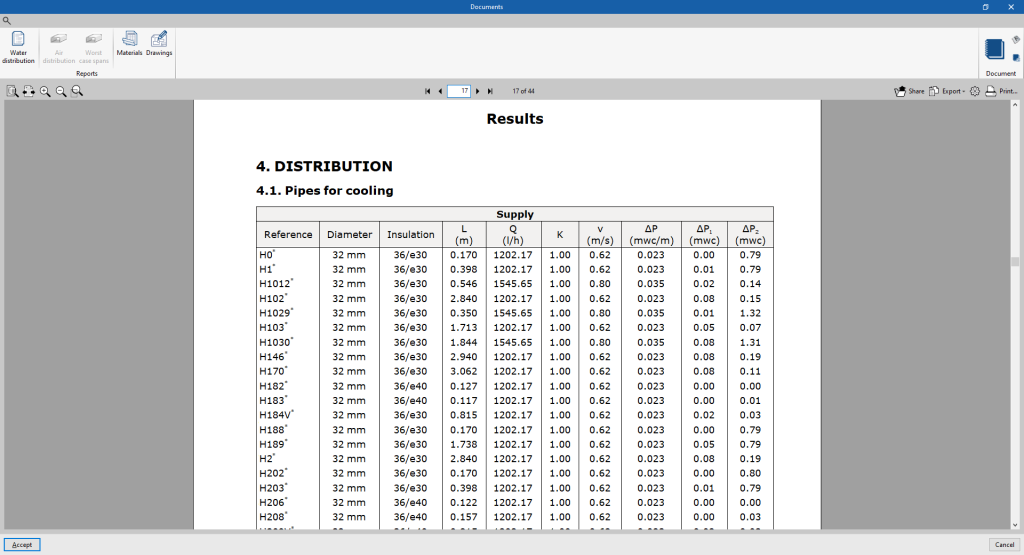
- Water distribution
Displays a report with the analysis results of the water distribution system. The data for the following elements are included:- Generators
- Emitters
- Fittings
- Distribution
- System-specific reports
Each of these reports shows specific information on the following systems entered in the model:- VRF
- Split 1x1
- Multisplit
- Air-source heat pump
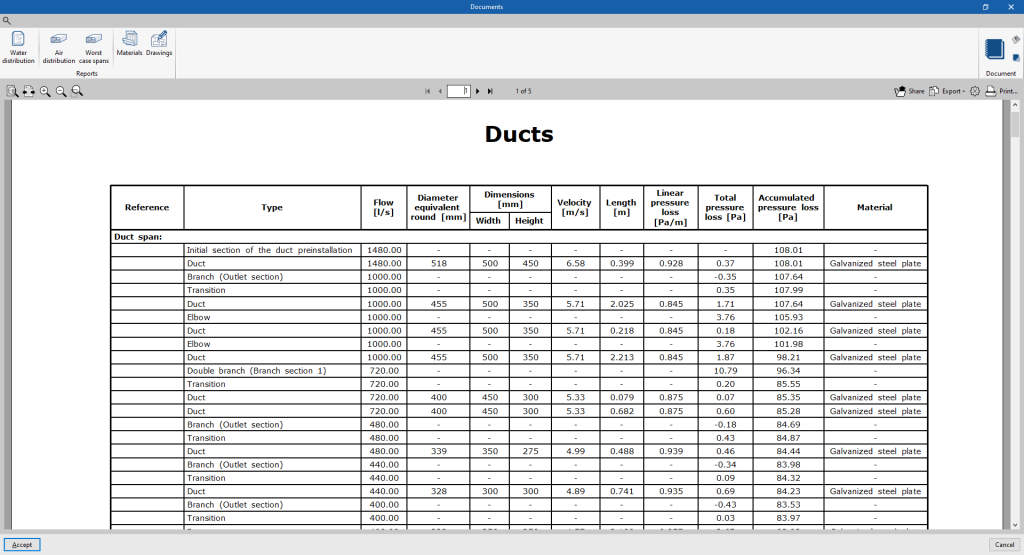
- Air distribution
Displays a report with the analysis results of the air distribution system. The data for all ducts and nodes are organised by air duct sections in a table including the following information:- Reference
- Type
- Flow
- Diameter equivalent
- Dimensions (Width, Height)
- Velocity
- Length
- Linear pressure loss
- Total pressure loss
- Accumulated pressure loss
- Material
- Most unfavourable sections
Displays a specific report of the most unfavourable air duct runs for each independent tree in the system.
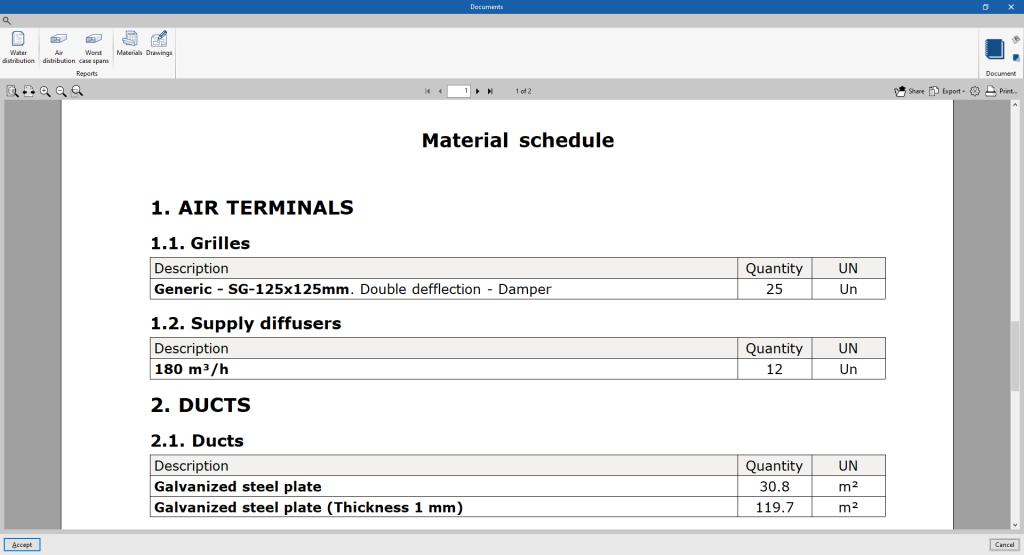
- Materials
Displays the table of materials with the measurement of the elements arranged in the system.
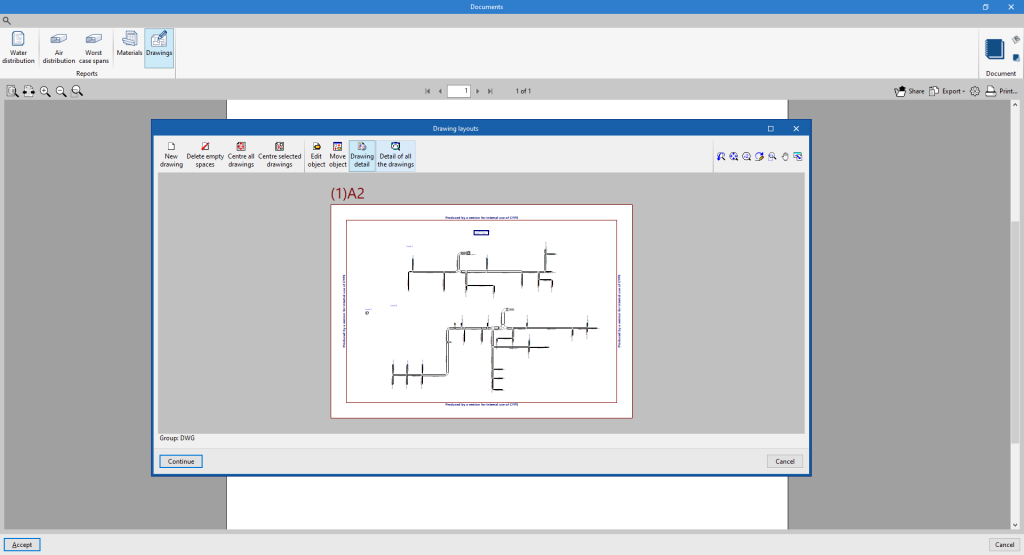
- Drawings
With this option, the program can print drawings as reports, so they can be integrated and exported as another document.
Document configuration
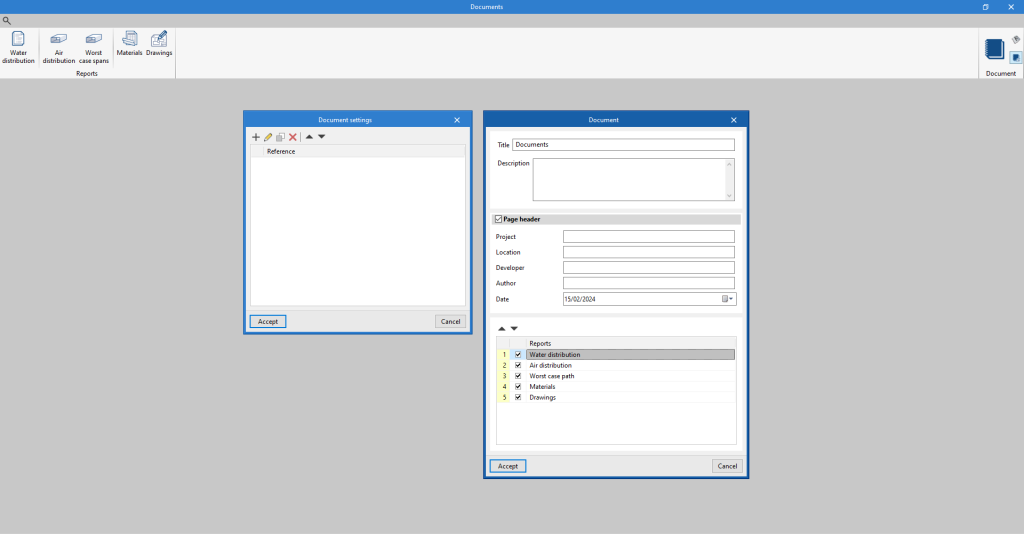
To create documents that incorporate the information of several selected reports together, the "Document configuration" option is used. It allows the following data to be configured:
- Title
- Description
- Page header (optional)
- Project; Location; Developer; Author; Date
- Reports to be included
The document created is printed using the "Document" option.
The "Document styles" can also be modified using the corresponding option.
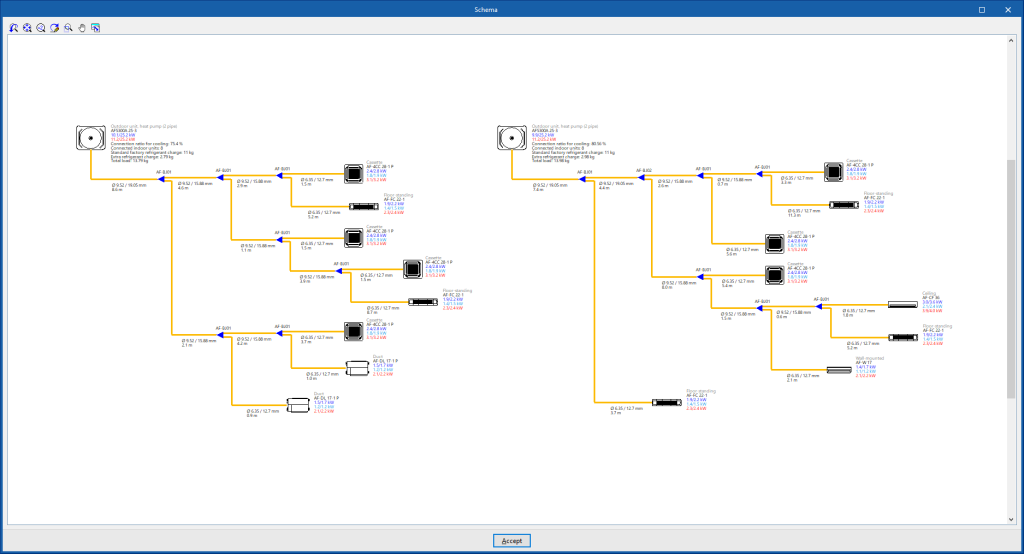
System diagram
By using the "Diagram" option in the "Results" group of the main toolbar, the program generates and displays the diagram of the direct expansion systems.
These diagrams can be incorporated into the job drawings.
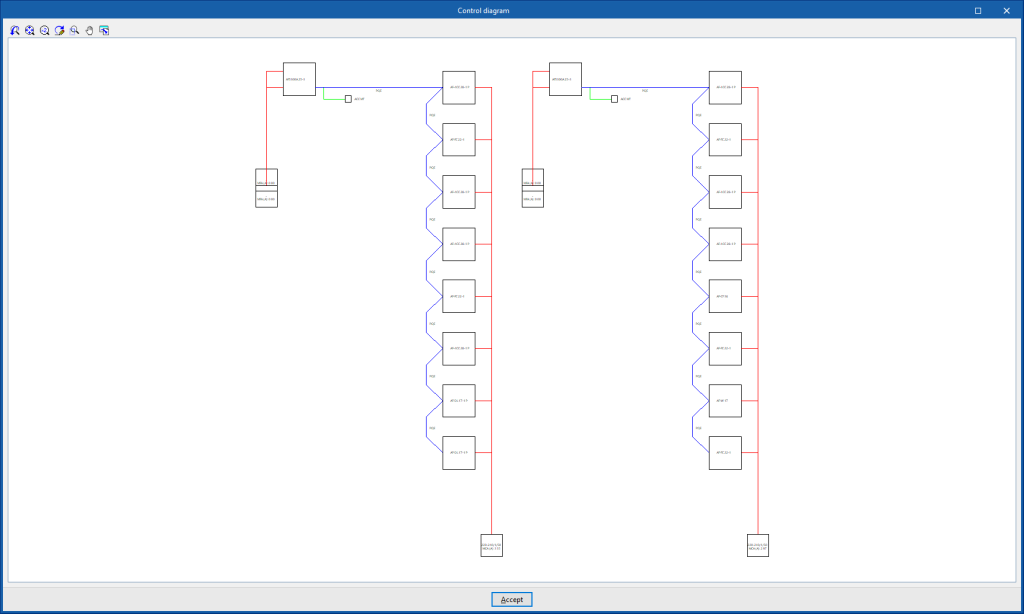
Control diagram of the system
By using the "Control diagram" option in the "Results" group of the main toolbar, the program generates and displays the control diagram of the VRF systems.
The control diagram can also be incorporated into the job drawings.
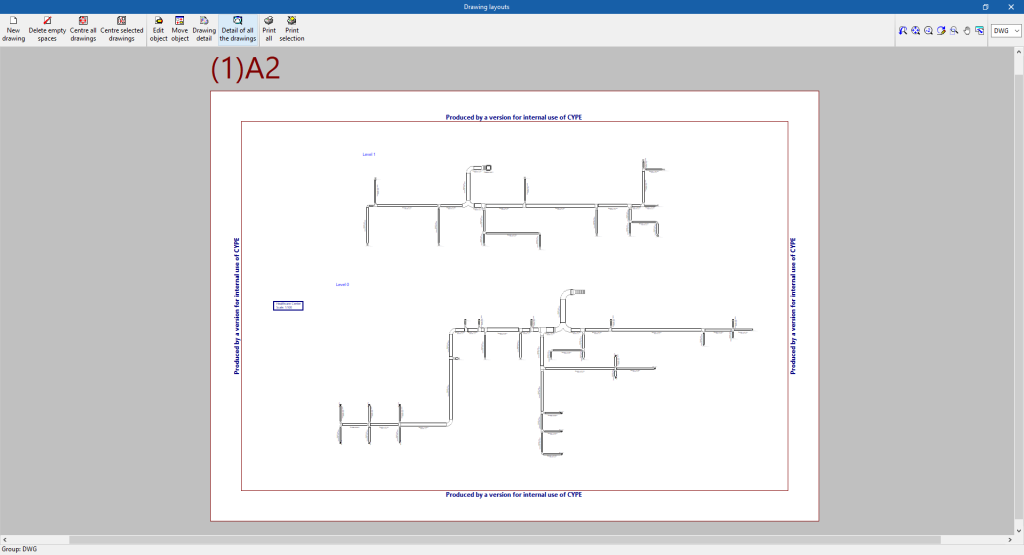
Drawings in DWG, DXF or PDF format
The program can print the drawings of the job on any graphic peripheral configured on the computer, or create DWG, DXF or PDF files.
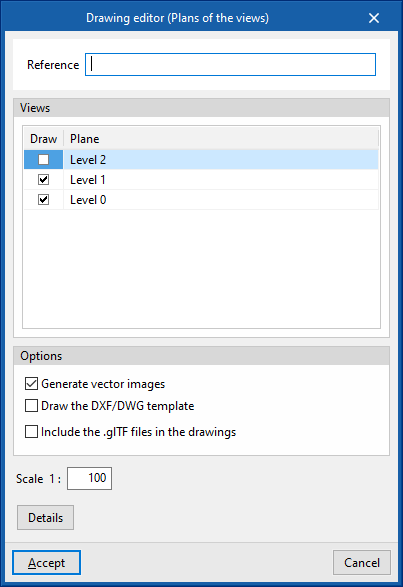
The following options can be configured when editing drawings:
- Views to be drawn
- Options
- Generate vector images
- Draw the DXF/DWG template
- Include .glTF files in the drawings
- Scale
- Details
The drawings can be obtained via the "Drawings" option at the top of the interface or via the "Reports" option in the "Results" group of the main toolbar.
Results in the "Bill of quantities" tab
If the work is carried out in the "Bill of quantities" tab, CYPEHVAC will provide the following documents:
- Exporting the bill of quantities in FIEBDC-3 format (BC3)
- Bill of quantities reports (in HTML, PDF, TXT, RTF or DOCX format)
GLTF file compatible with BIMserver.center
When a project is exported to the BIMserver.center platform, a 3D model is automatically exported in GLTF format for the integration of the system model in the Open BIM project, so that it can be visualised:
- on the online platform;
- in the BIMserver.center app for iOS and Android;
- in virtual reality and augmented reality;
- in other CYPE programs.
