Tools in the "Analysis" tab
In the "Analysis" group of the top toolbar in the "Analysis" tab, the following options are available:

Calculation options
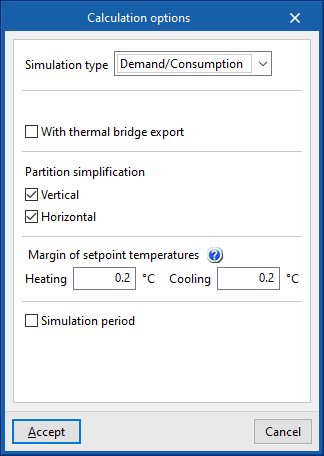
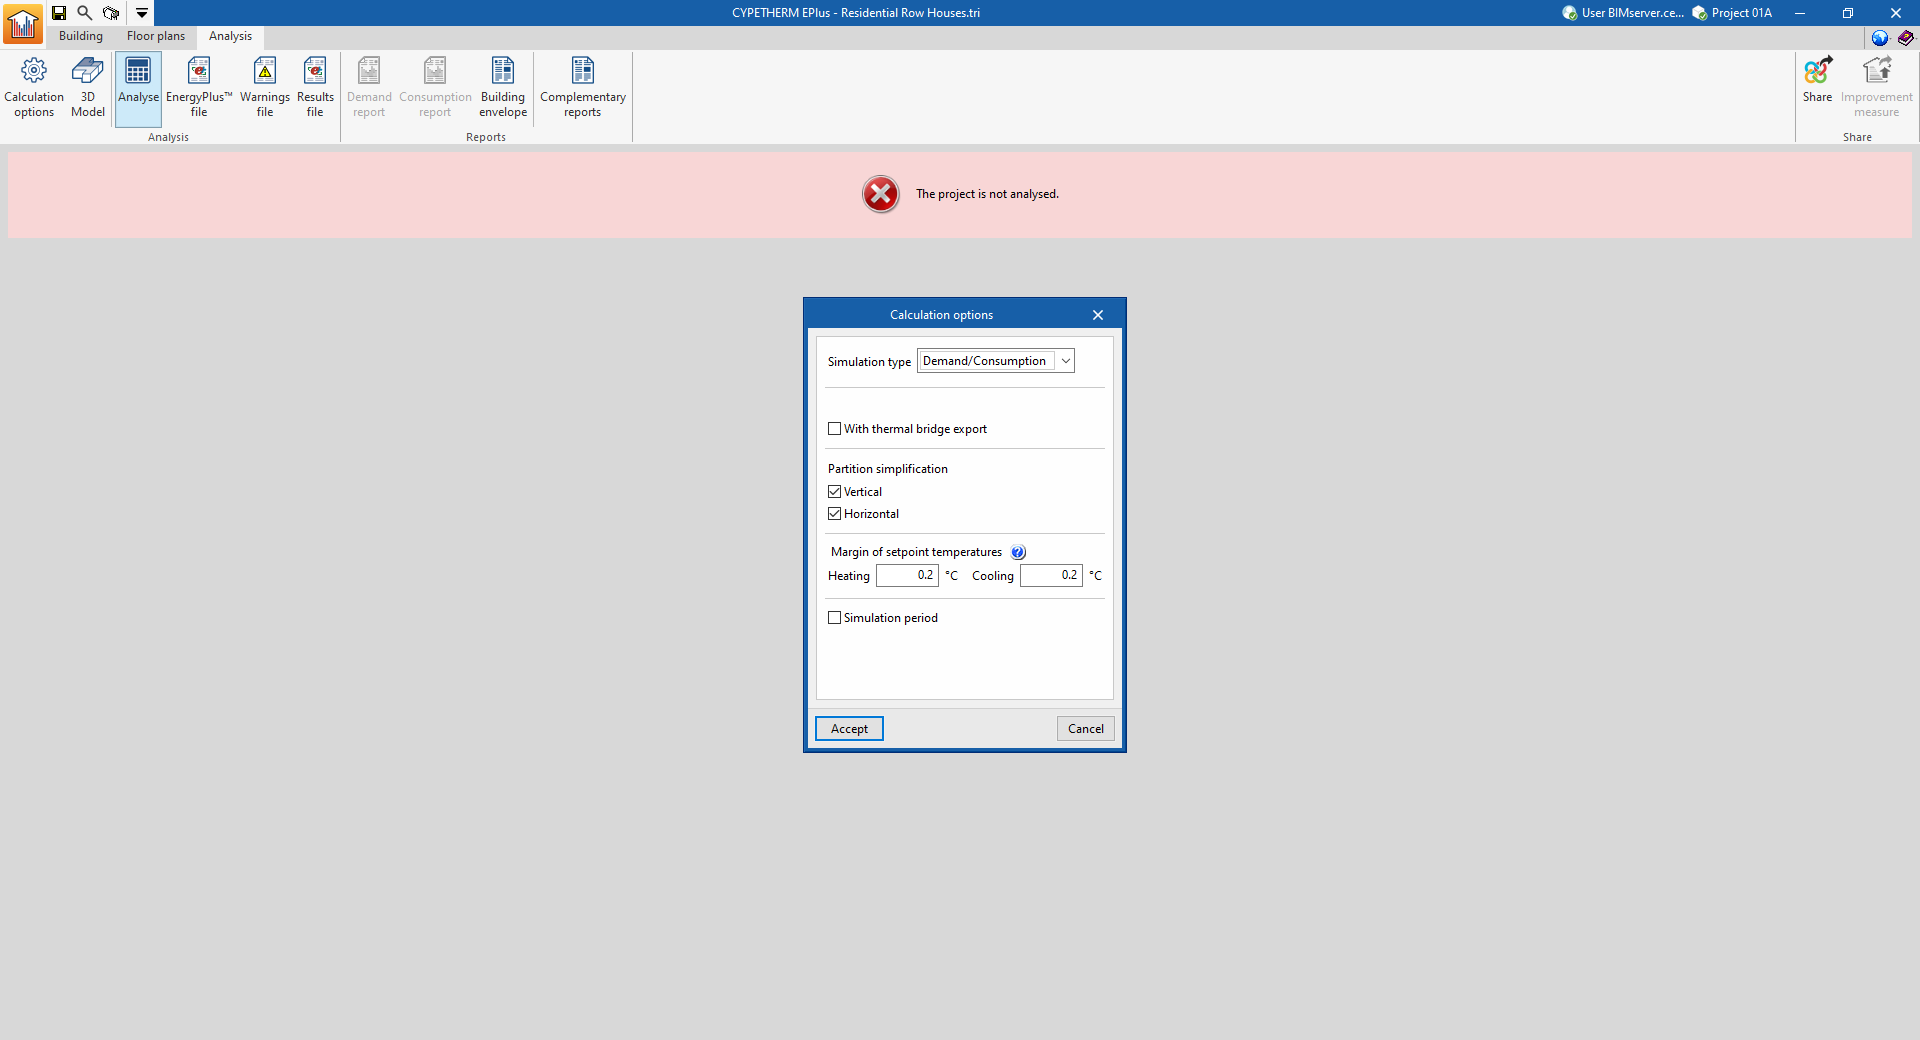
Defines the following options to configure the simulation:
- Simulation type
- With analysis by space (optional)
This option appears when "Demand" is selected as the simulation type. It performs the simulation of the building considering the rooms individually, instead of grouping them in the defined thermal zones. - With thermal bridge report(optional)
Includes thermal bridges in the simulation. - Partition simplification
These options simplify the analysis model of the building, which considerably reduces the simulation time while maintaining the accuracy of the results. Simplification consists of reducing the number of surfaces that make up the model.- Vertical (optional)
This option eliminates vertical interior partitions within the same zone, replacing them with thermal inertia. - Horizontal (optional)
This option, in a second step, reunites the floor slabs.
- Vertical (optional)
- Margin of setpoint temperatures
When the air temperature in the building spaces is outside the range of the heating or cooling setpoint temperatures by more than the indicated values, this shall be counted as off-setting hours.- Heating
- Cooling
- Simulation period (optional)
By default, if this option is not activated, the building will be simulated for a full year, from 1 January to 31 December. This option should only be checked if a different simulation period is to be defined. In this case, the "Start" and "End" days of the simulation are indicated.
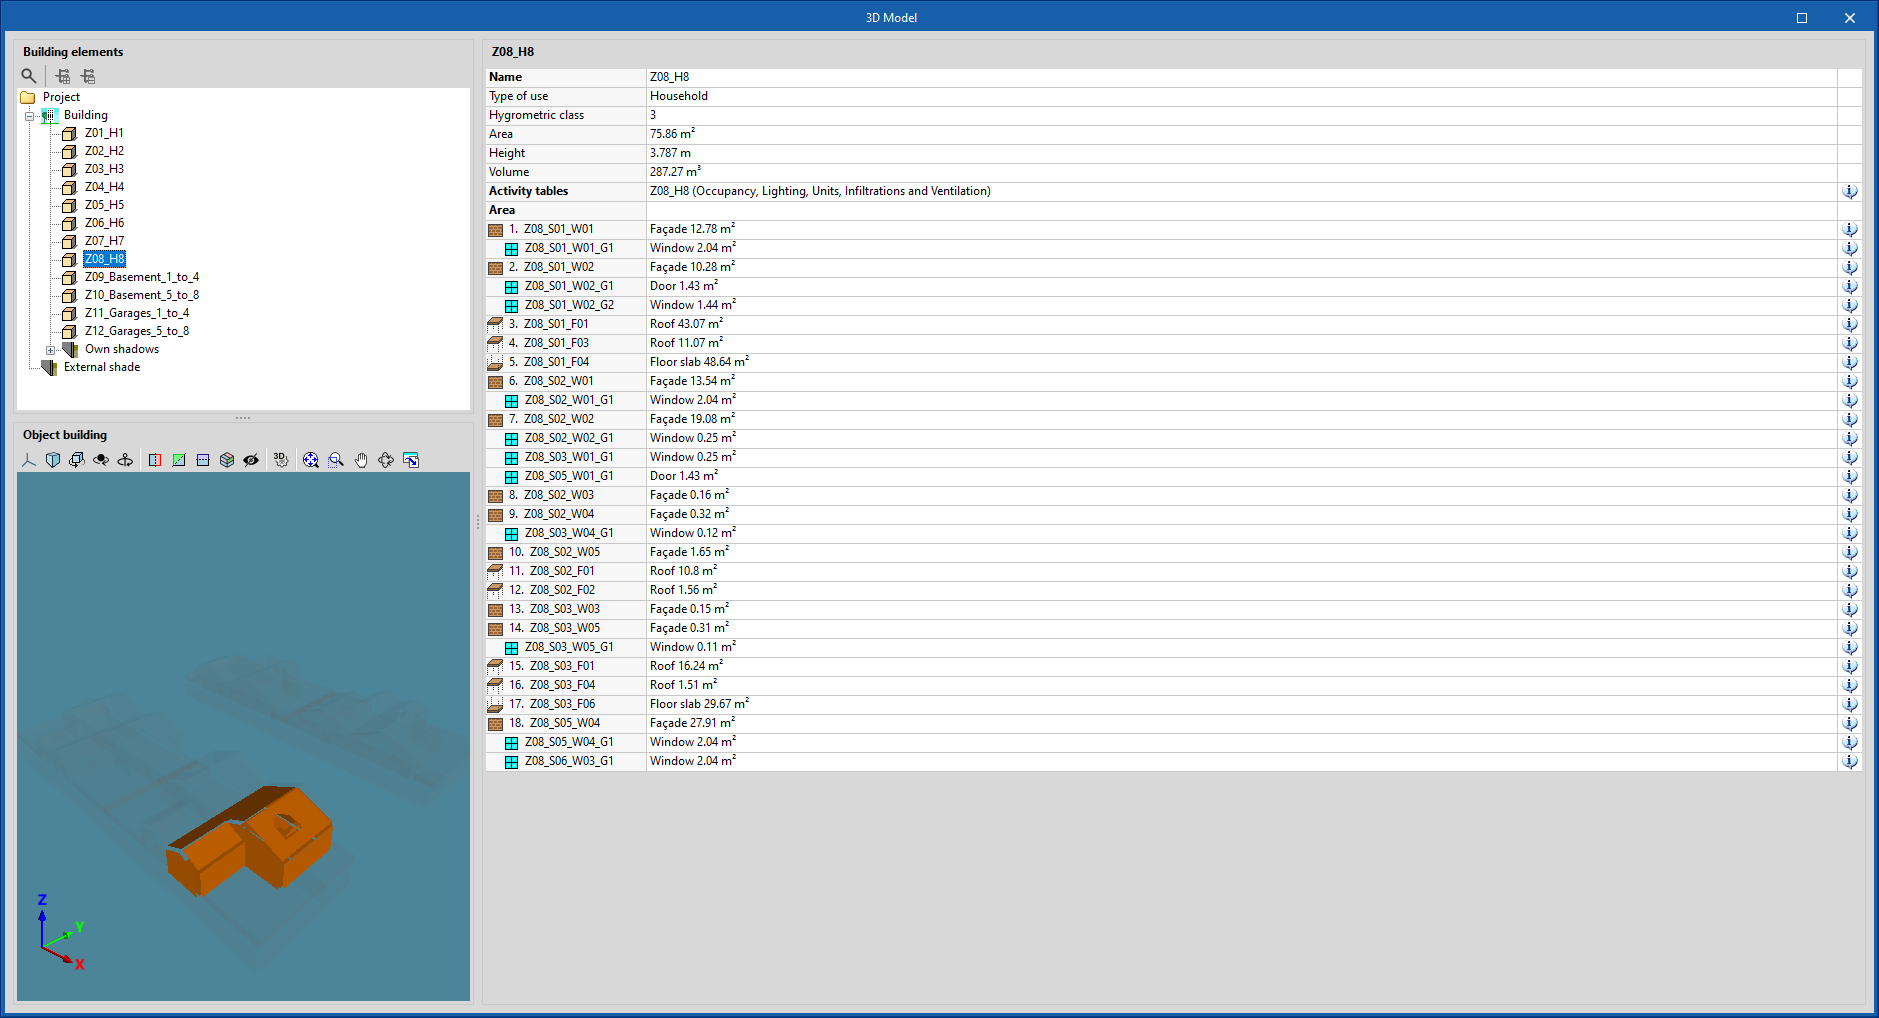
3D model
Displays the elements of the building energy model. This BEM model (Building Energy Model) is the one used in the simulation with the analysis engine and is created from the definitions in the "Building" tab, which in turn were imported from the BIM model.
On the left-hand side, the "Building elements" tree is shown, which includes the zones, own shadows and remote shadows.
When an element is selected in the tree, it is highlighted in orange in the 3D viewer at the bottom, which corresponds to the representation of the "Object building".
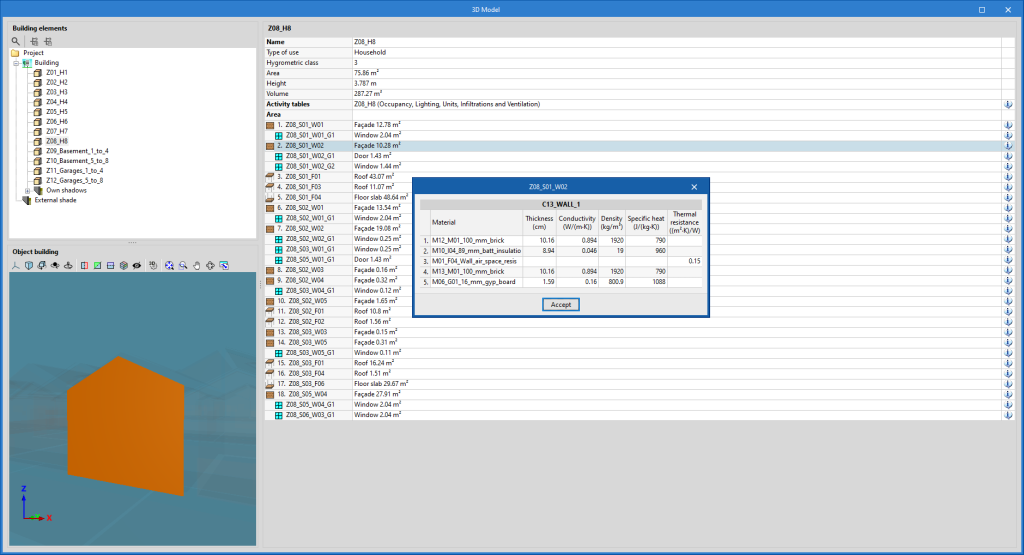
On the right-hand side, a table with information about the selected level is displayed. The characteristics of each of the elements of the model can be consulted by clicking on the information button that appears to the right of each row of the table.
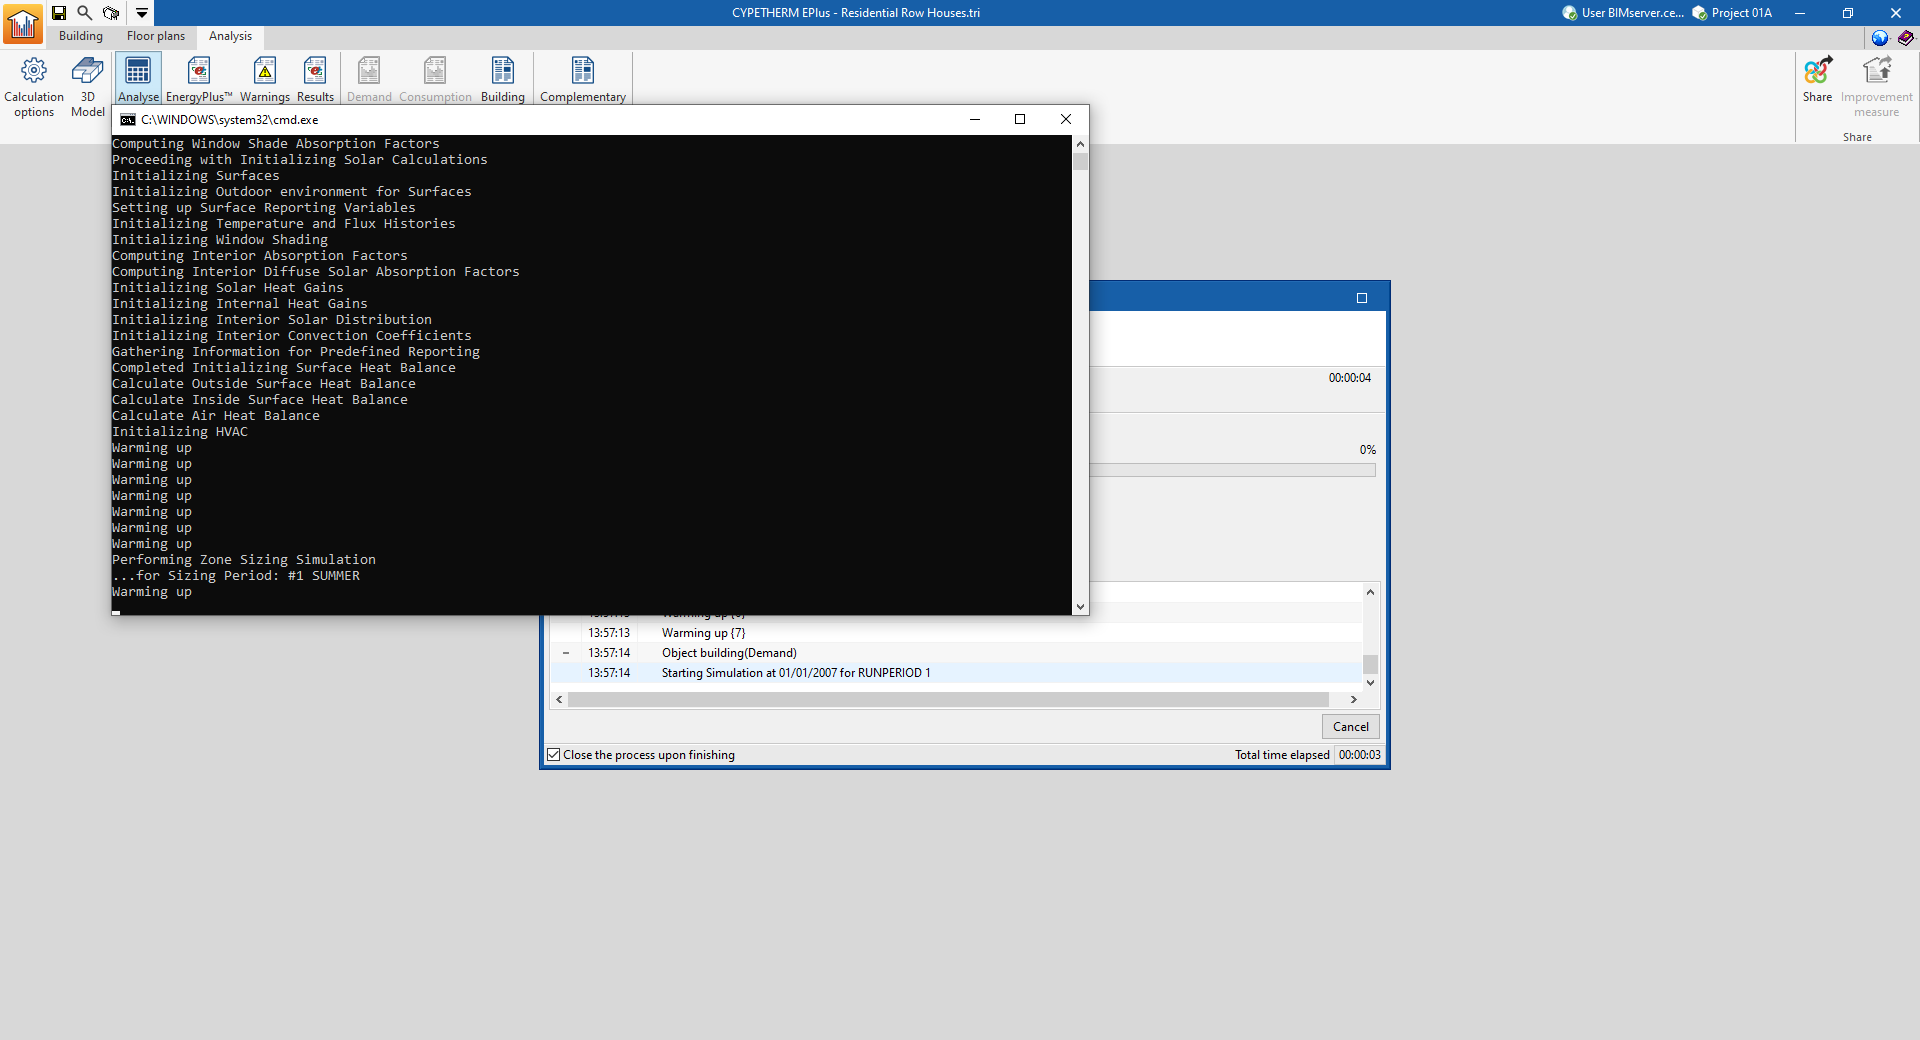
Analyse
The "Analyse" option launches the energy simulation and generates the results and reports. The "Calculation options" can be modified beforehand in a window equivalent to the one that appears when clicking on this option.
The program will open a console window in which the analysis process can be followed. When completed, the console windows close automatically and the results of the analysis can be viewed on the screen.
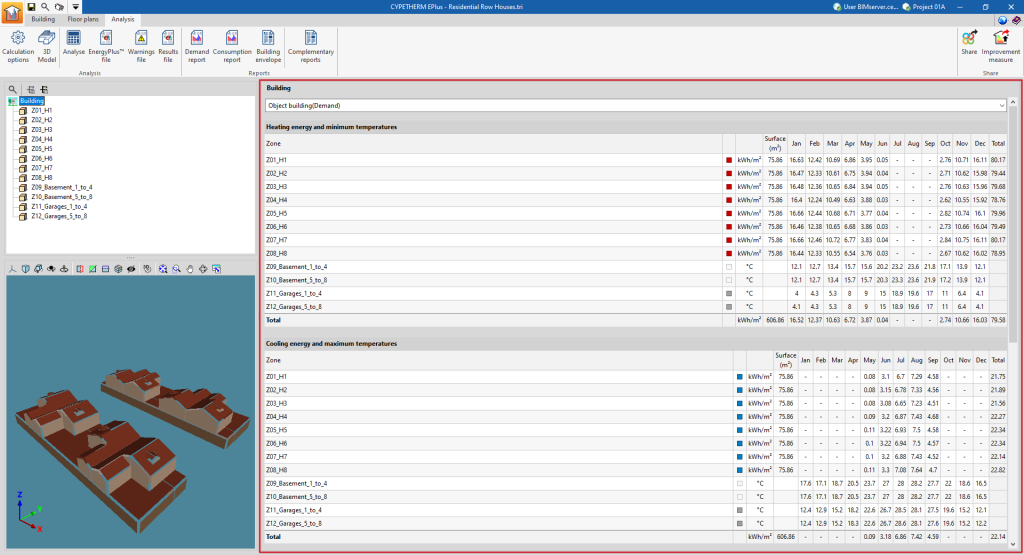
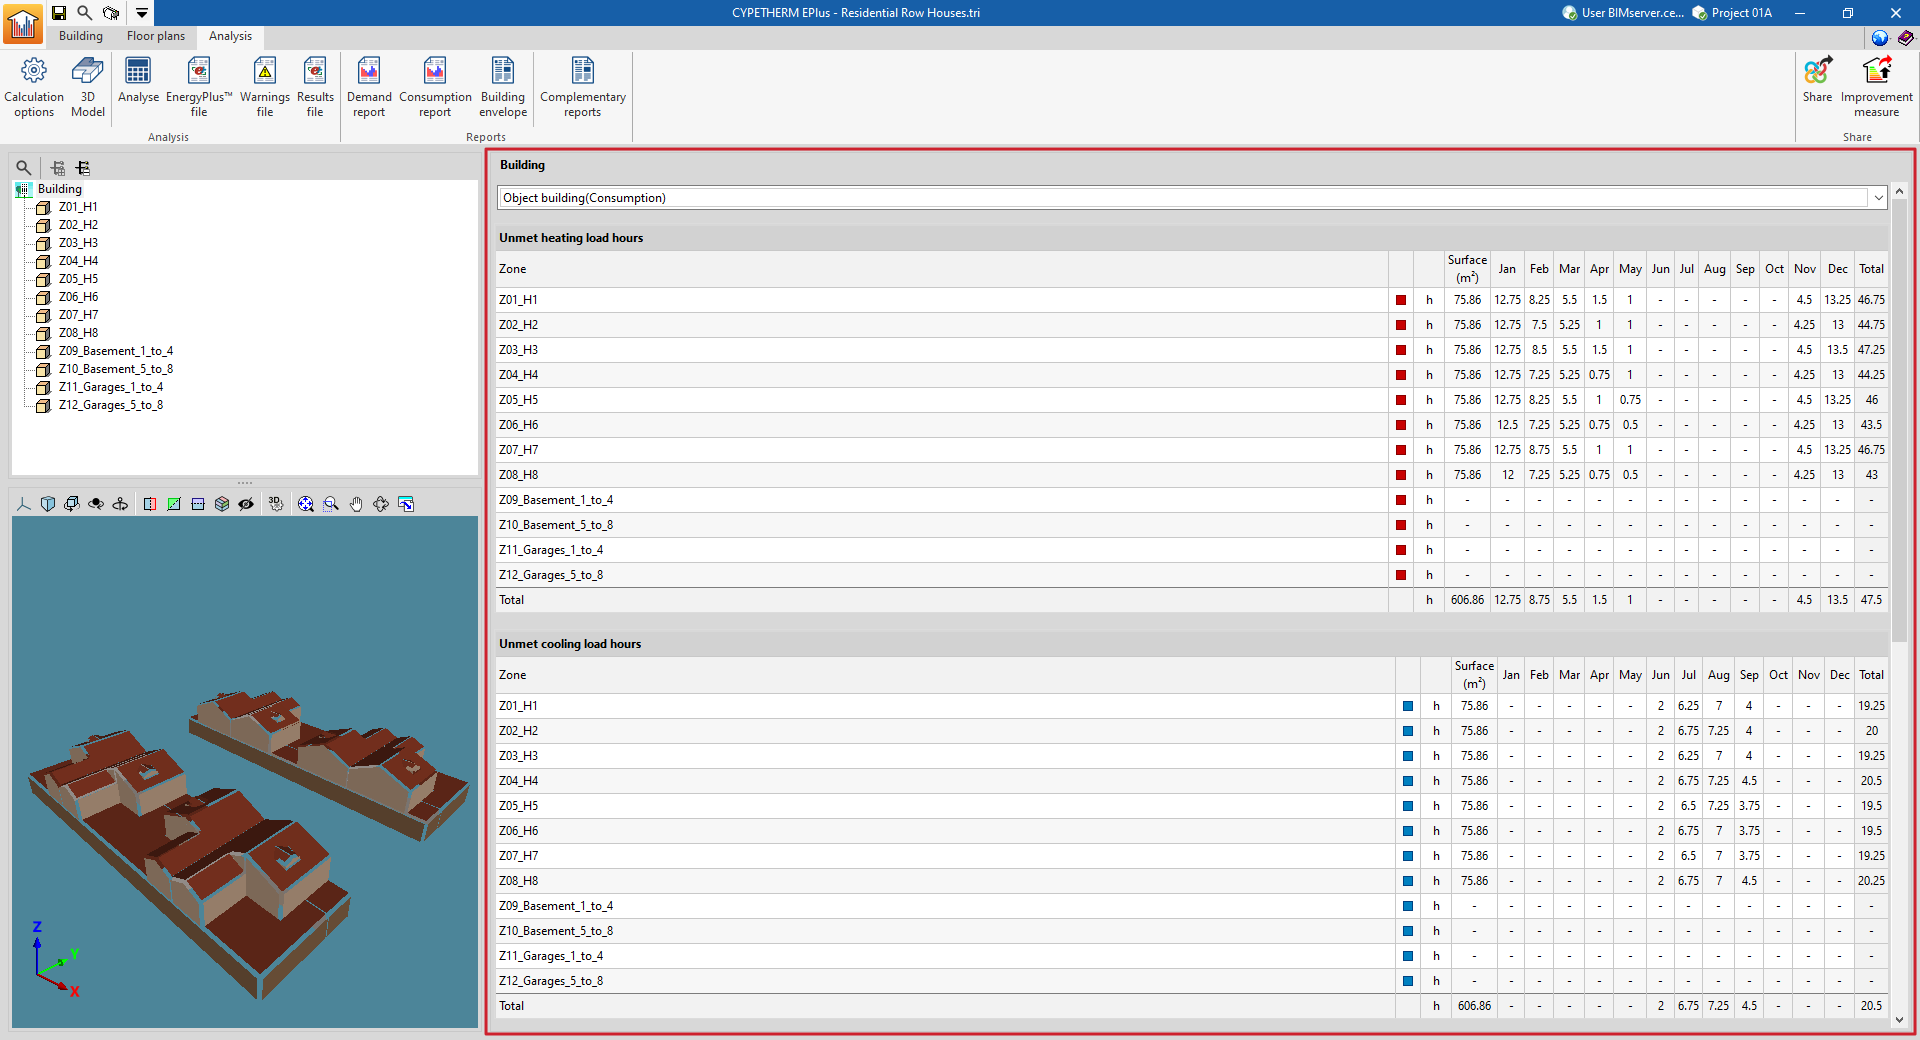
Results output
Checking results on screen
After carrying out the analysis, the program can be used to check the results of the simulation on the screen in the main display area of the "Analysis" tab.
The results are shown for the section selected in the side diagram, either the entire building or a thermal zone. The simulation results can be viewed for each month, according to the selection made in the diagram.
The top drop-down menu is used to display the results of the different simulations carried out (demand or consumption).
Reports
Using the options in the "Reports" group on the main toolbar of the "Calculation" tab, the following reports can be generated. The program can print them directly or generate HTML, PDF, TXT, RTF or DOCX files with their contents:
- Demand report
- Consumption report
- Building envelope
- Complementary reports
- Description of materials and building elements
- Condensation
- Linear thermal bridges
- Internal comfort
- Calculation of the reduction factor
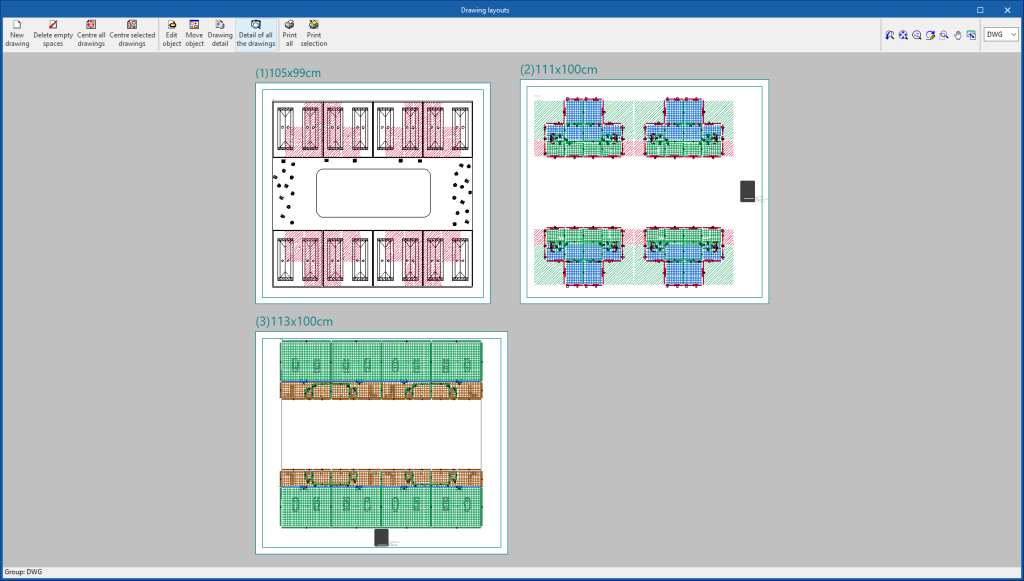
Drawings
The program can print the drawings shown in the "Floor plans" tab on any graphic peripheral configured on the computer, or create DWG, DXF or PDF files.
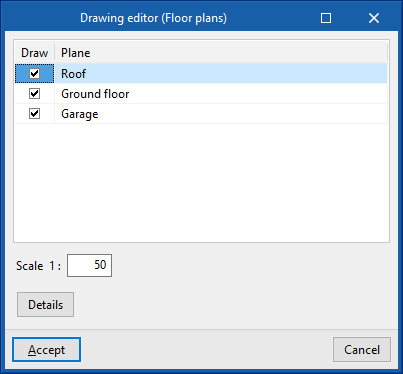
The following options can be configured when editing the drawing:
- Views to draw
- Scale
- Details
The drawings can be obtained via the "Drawings" option at the top of the interface or via the "Drawings" option in the "File" menu.
EnergyPlus™ files
Using the corresponding options in the "Calculation" group of the main toolbar of the "Calculation" tab, the following files can be generated in connection with the EnergyPlus™ calculation engine, which is integrated in the program:
- EnergyPlus™ file
- Alerts file
- Results file
EnergyPlus™ files
The "Analysis" group in the upper toolbar of the "Analysis" tab contains options for viewing the contents of the EnergyPlus™ files generated by the program:

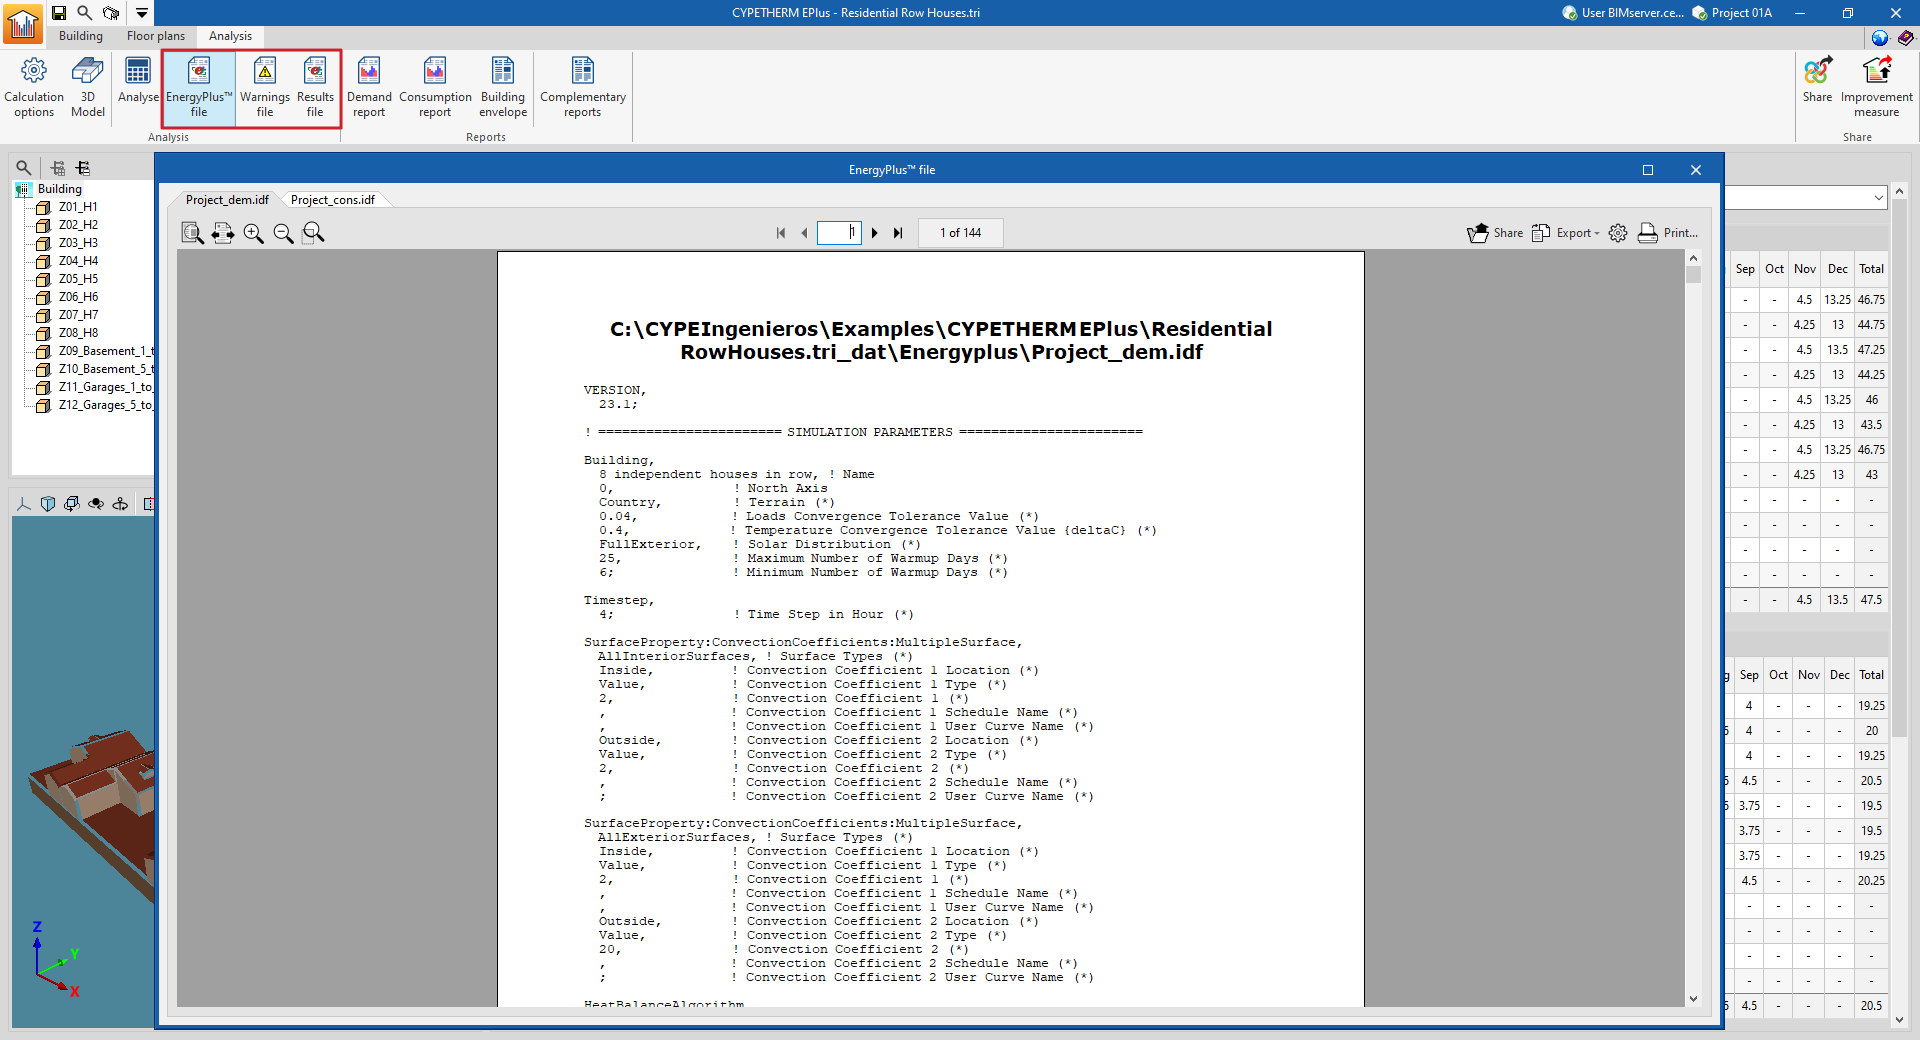
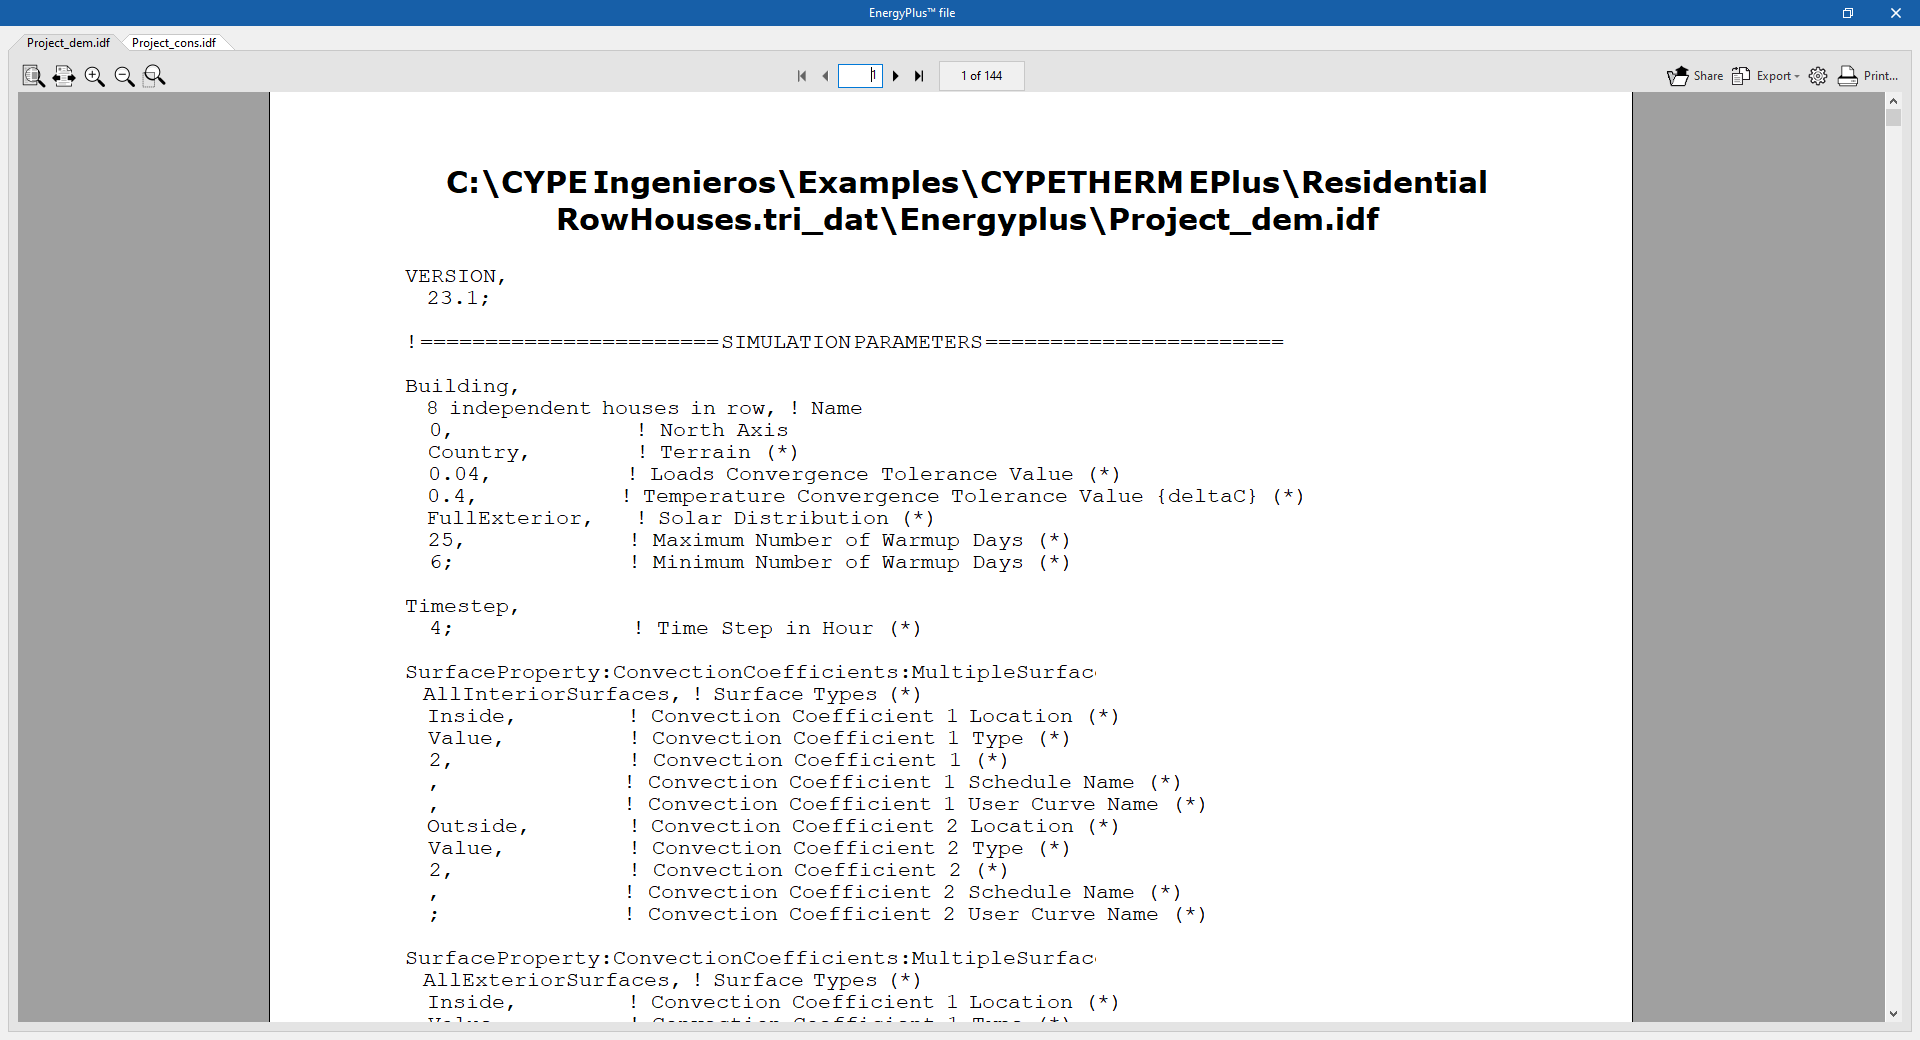
EnergyPlus™ file
Displays the input files with an .idf extension to the EnergyPlus™ analysis engine. The header of the viewer shows the location of each file:
- The Project_dem.idf file contains the data of the "Demand" simulation.
- The Project_cons.idf file contains the data of the "Consumption" simulation.
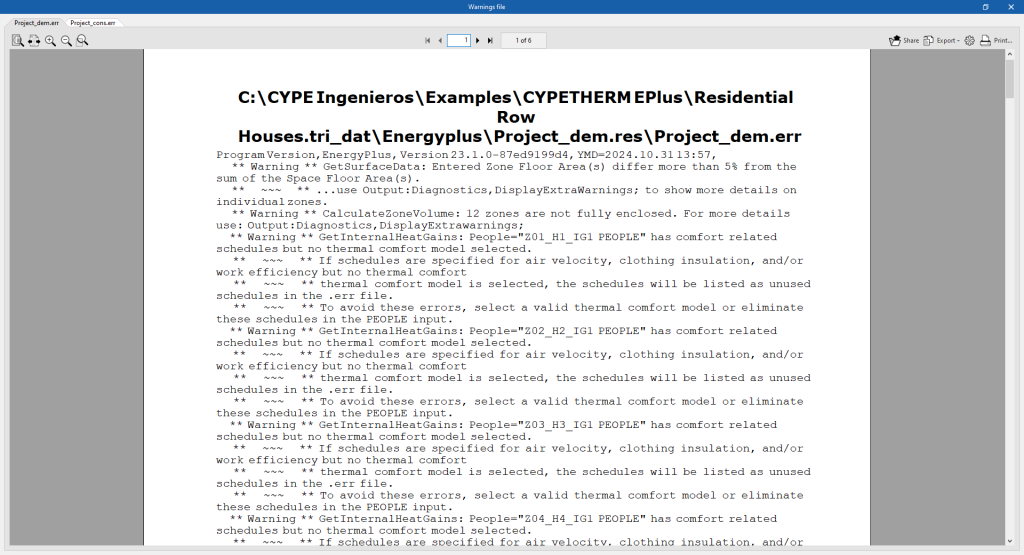
Warning file
Displays the .err files of warnings and errors produced by the EnergyPlus™ analysis engine. The location of each file is shown in the header of the viewer. If the simulation has been interrupted due to an analysis engine error, the contents of this file will be displayed.
- The Project_dem.err file contains the data of the "Demand" simulation.
- The Project_cons.err file contains the data of the "Consumption" simulation.
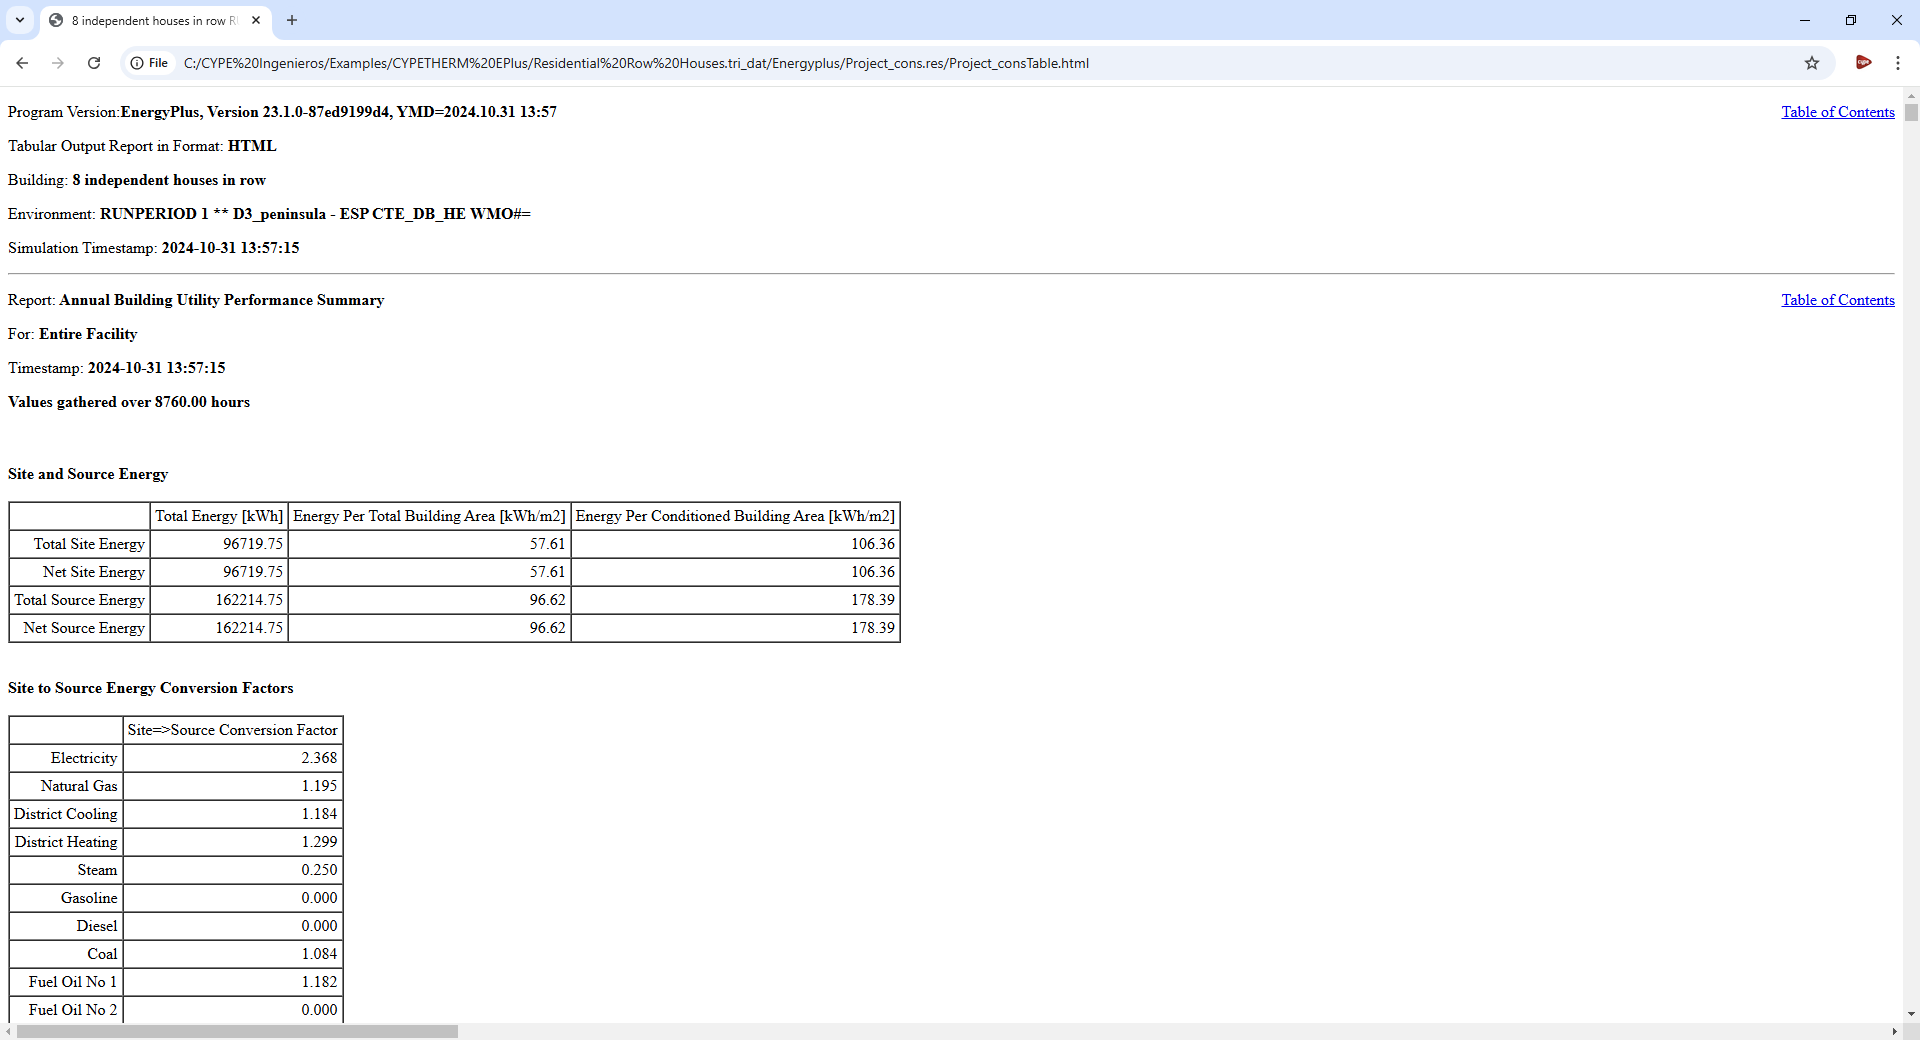
Results file
Opens the results files in HTML format generated by the EnergyPlus™ analysis engine, for each simulation (demand and consumption).
- The Project_demTable.html file contains the data of the "Demand" simulation.
- The Project_demTable.html file contains the data of the "Consumption" simulation.
Reports
The "Reports" group in the upper toolbar of the "Analysis" tab contains the options for viewing the reports generated by the program, which include reports of the analysis results and the definitions made.

The available reports are as follows:
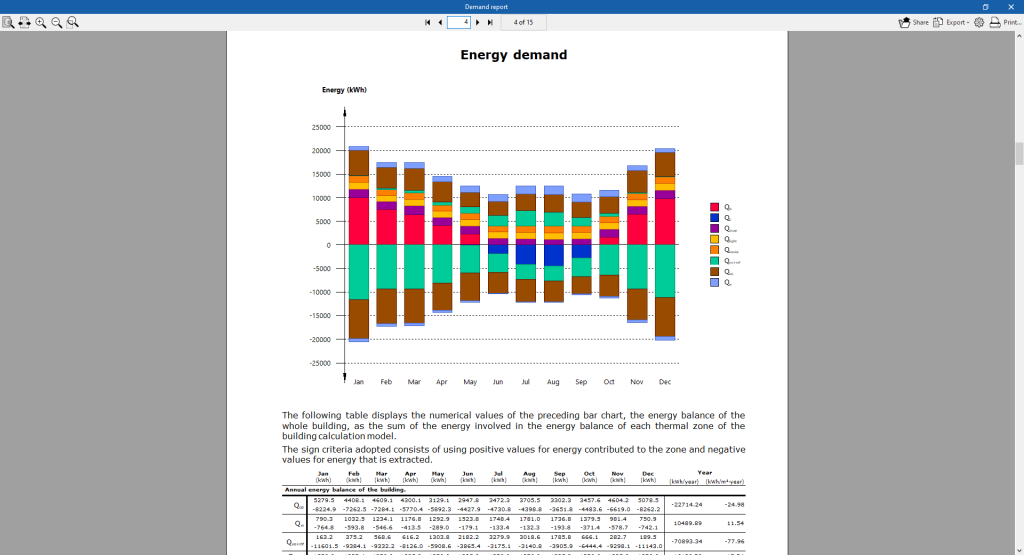
Demand report
Contains the results of the "Demand" simulation. The results of the energy demand for heating and cooling of the building and per heating zone are provided. The results of the energy balance in the building and the annual energy and power demand of the building are included graphically.
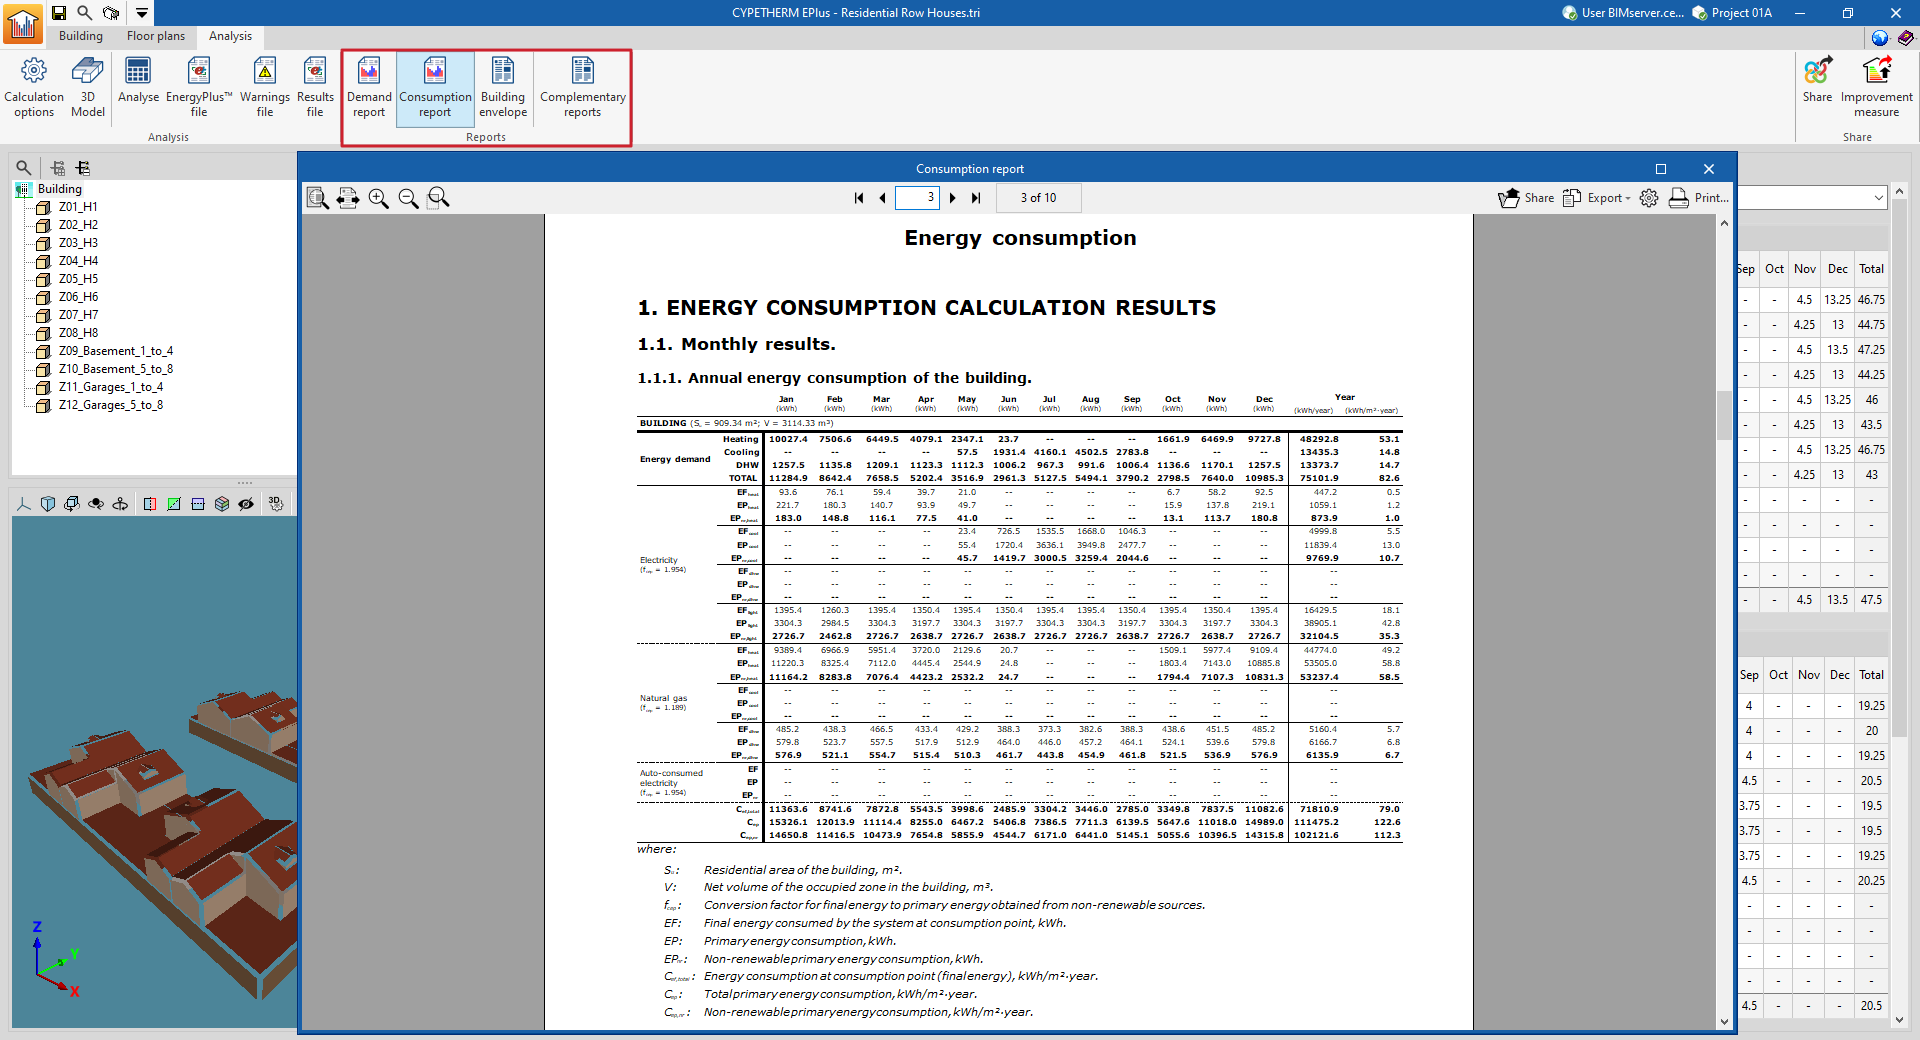
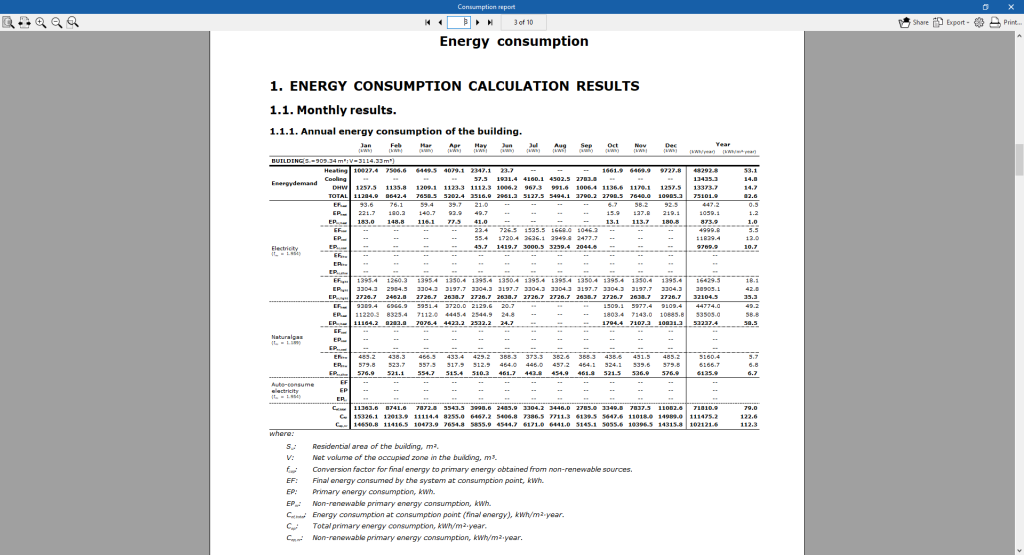
Consumption report
Contains the results of the "Consumption" simulation. It provides results of the building energy consumption for heating, cooling and domestic hot water, classified according to the type of final energy consumed.
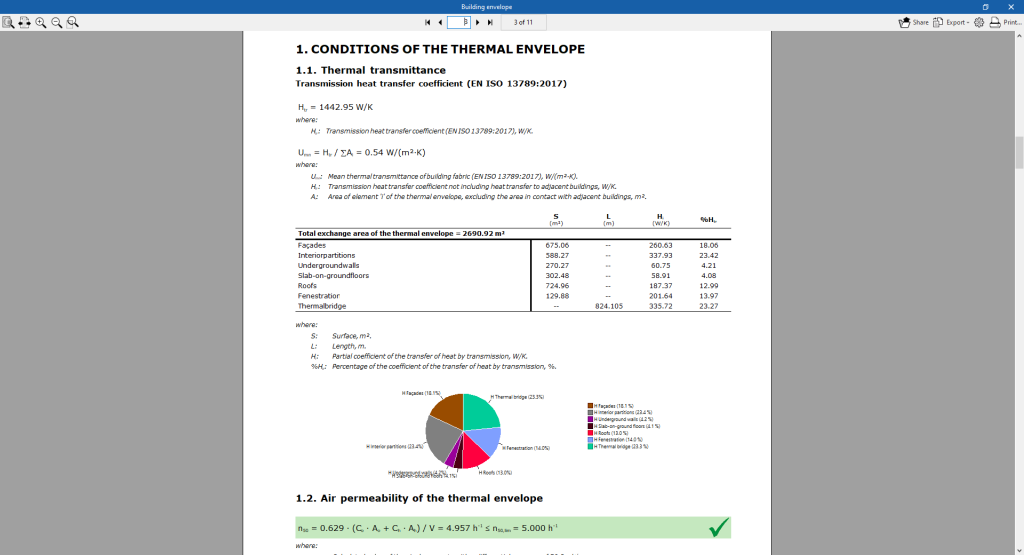
Building envelope
Contains the results of the transmittance heat transfer coefficient calculated according to EN ISO 13789:2017 and the air permeability of the thermal envelope. A breakdown by elements is made and the thermal transmittance (U) value of each element is compared with the limit value set by the user.
Complementary reports
This option is used to display and print the following complementary reports:
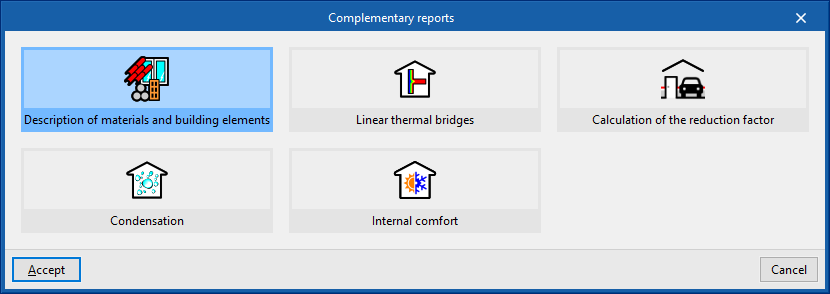
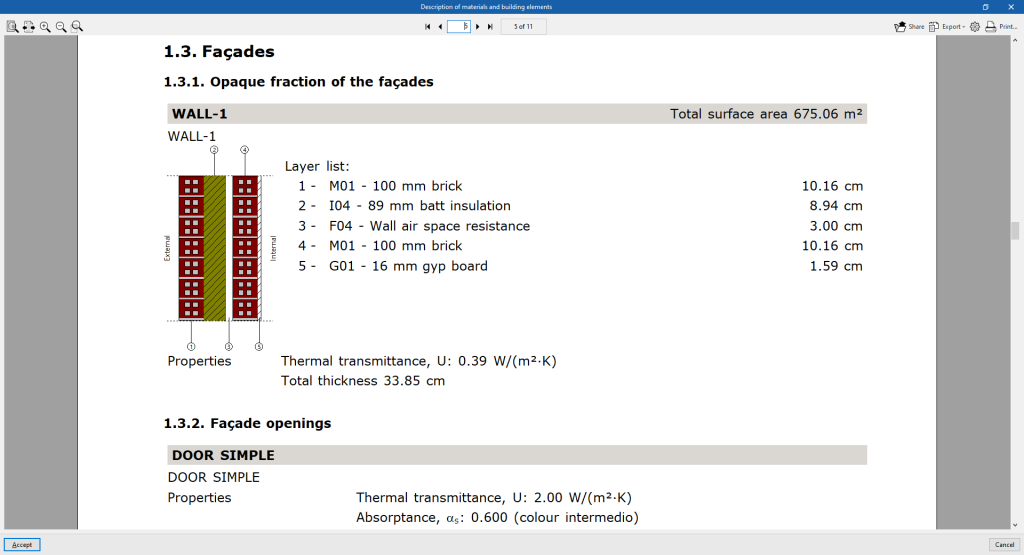
Description of materials and building elements
The different elements in the job are shown together with their materials, quantities, transmission coefficients, etc. The envelope system (external envelopes, floors, roofs and openings) and the compartmentalisation system (vertical partitions and floor slabs between floors) are specified.
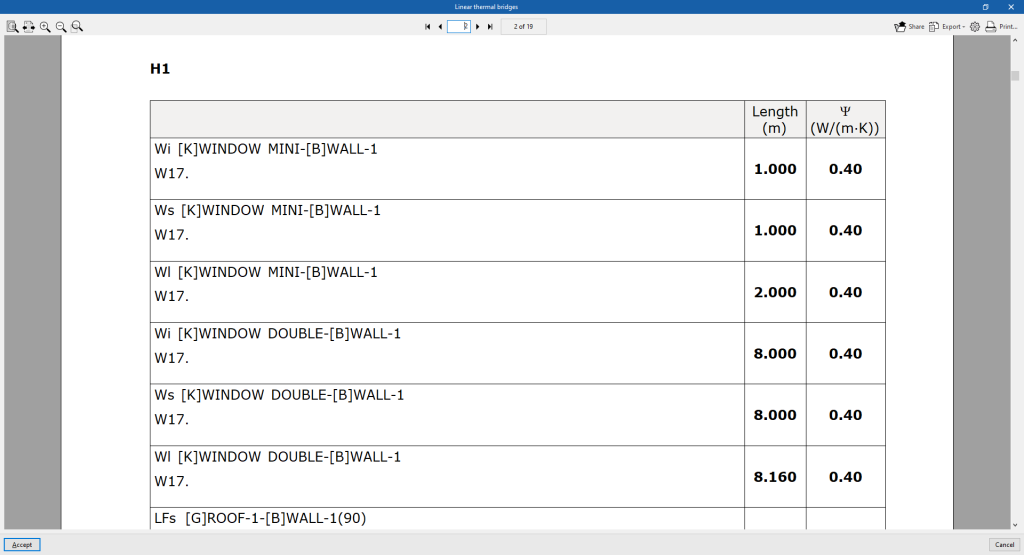
Linear thermal bridges
The thermal bridges defined in each zone and their characteristics are listed.
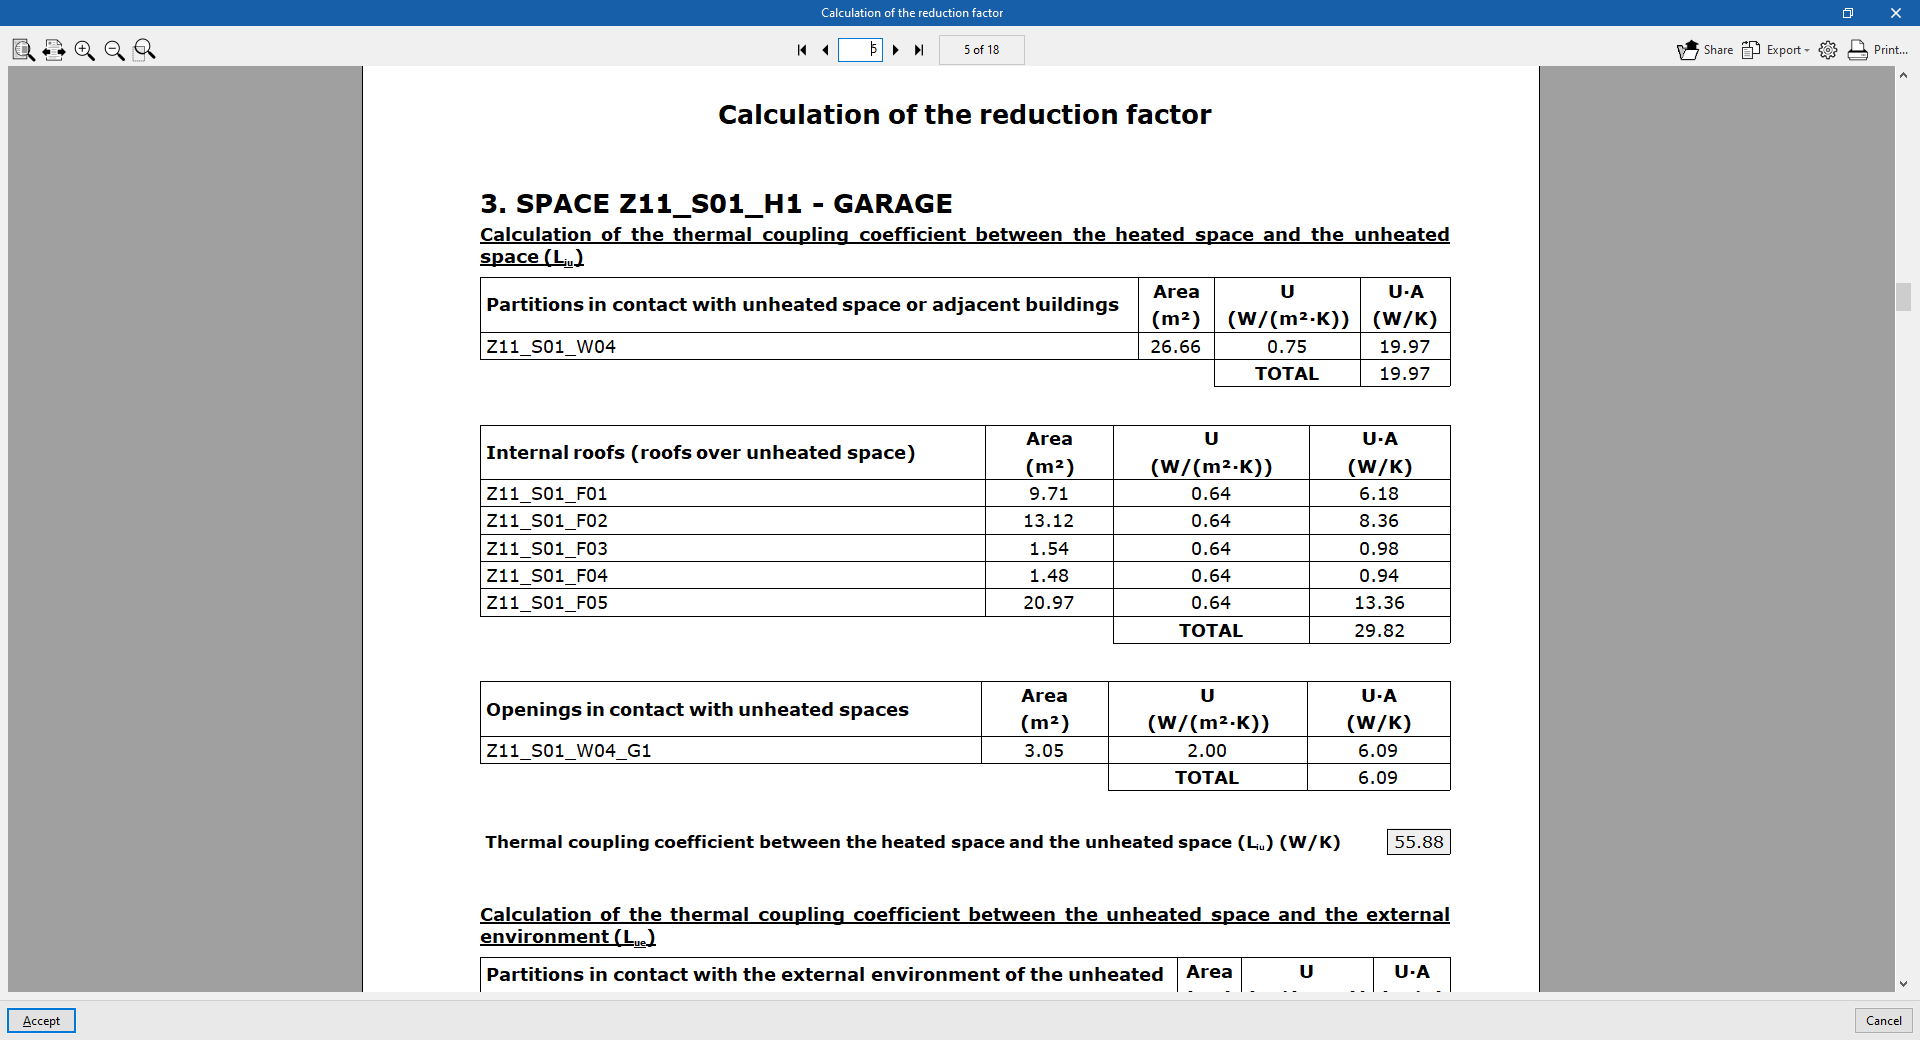
Calculation of the reduction factor
Contains the methodology and detailed results of the calculation of the heat transfer to the unconditioned spaces of the building according to EN ISO 13789:2017. These results are used in the calculation of the transmission heat transfer coefficient in the "Building envelope" report.
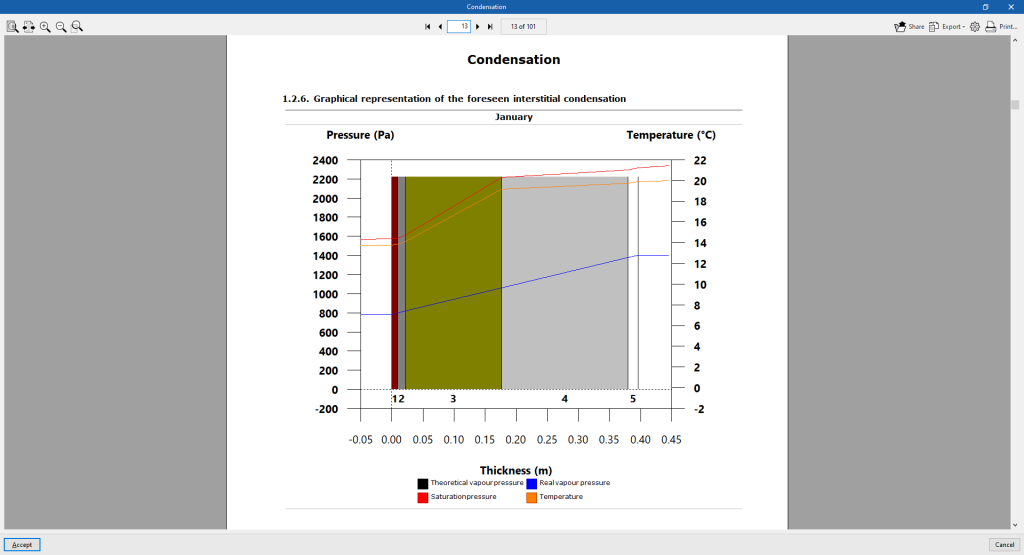
Condensation
This report is available if the "Check for the existence of surface and interstitial condensation in accordance with ISO 13788" option has been selected under "General parameters".
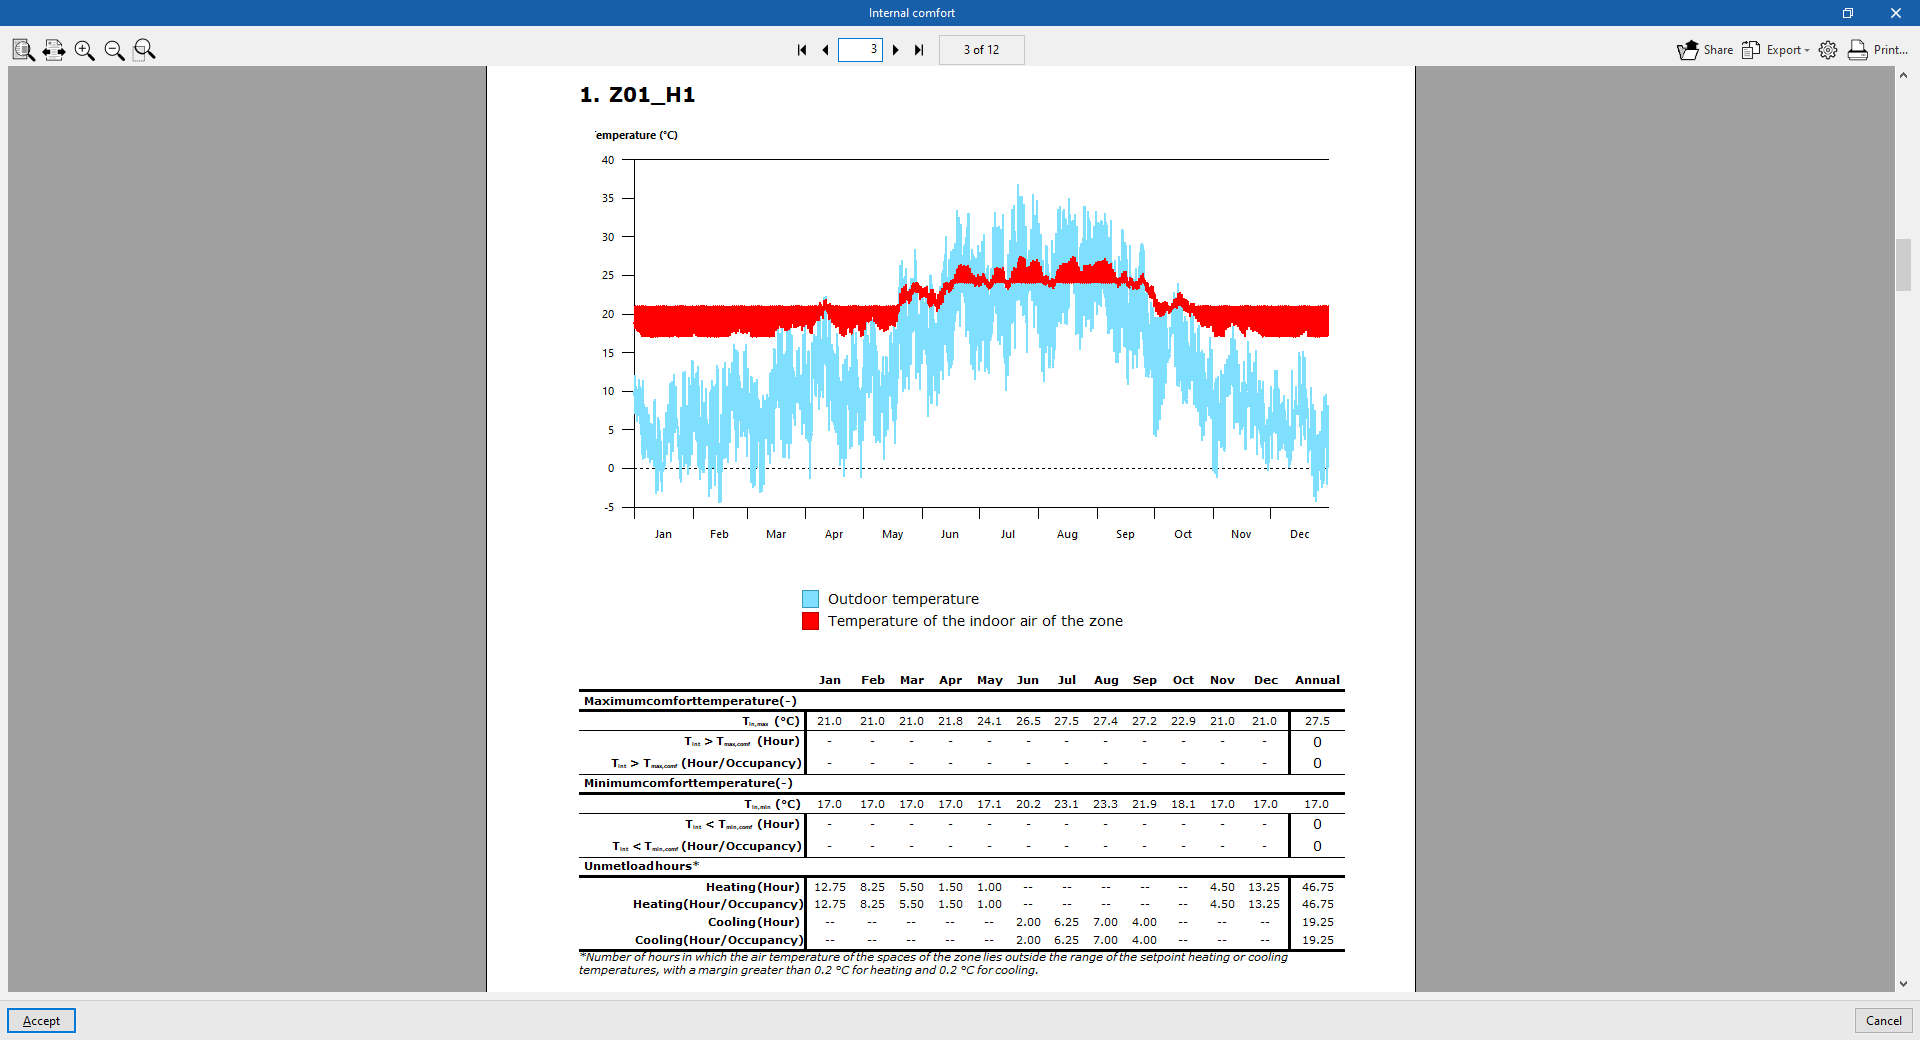
Internal comfort
The report allows users to visualise the evolution of the indoor temperature of the zones by means of graphs and tables, comparing it with the outdoor temperature. The number of hours that the indoor comfort temperature defined in each zone is exceeded and the number of hours outside the setpoint are counted.
The results of the indoor air temperature of the zones and the outdoor air temperature, for each hour of the year, are exported to a .csv file available in the ‘_dat’ directory associated to the program file. The numerical values of this file coincide with those represented graphically in the "Indoor comfort" report.
The default path to this file is C:\CYPE Ingenieros\Projects\CYPETHERM
EPlus\job_name.tri_dat\Energyplus\Project_cons.res\Zone air temperatures.csv
Document viewer options
The document viewer, which appears when displaying any report, has the following options at the top:
- Share
Shares the selected document over the internet. The document will be stored on a server in PDF format and an address will be generated to access it. Only people with this address will be able to access the file. - Export
The document can be saved in a variety of formats, including PDF, DOCX, TXT, HMTL and RTF. - Print
Sends the document to the printer to be printed directly, with the page settings that have been selected on the button with the gear icon ("Print settings").
Integration into the BIMserver.center platform
Many of CYPE's programs are connected to the BIMserver.center platform and allow collaborative work to be carried out via the exchange of files in formats based on open standards.
Please note that, to work on BIMserver.center, users can register on the platform free of charge and create a profile.
When accessing a program connected to the platform, the program connects to a project in BIMserver.center. This way, the files of the projects that have been developed collaboratively in BIMserver.center are kept up to date.

| More information: |
|---|
| For further details related to using CYPE software via the BIMserver.center platform, please click on this link. |