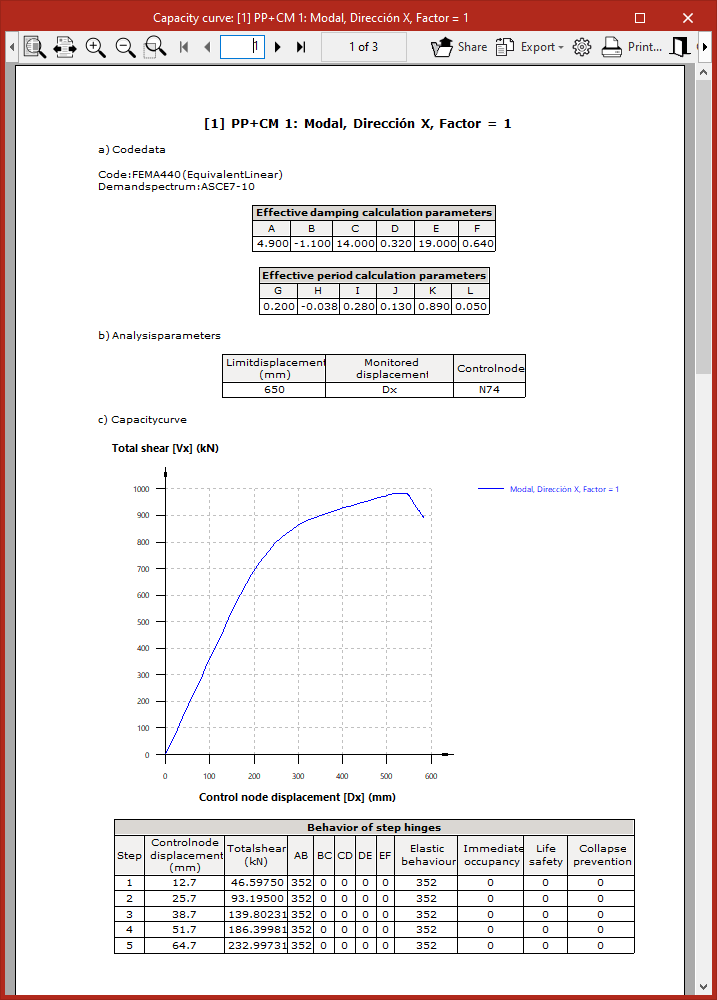
Checking the capacity curve and the performance point
The capacity curve and performance point obtained following the pushover analysis can be viewed using the "Capacity" option, available in the "Pushover analysis" group on the top toolbar, within the "Analyse" tab (under the "Structure" sub-tab):

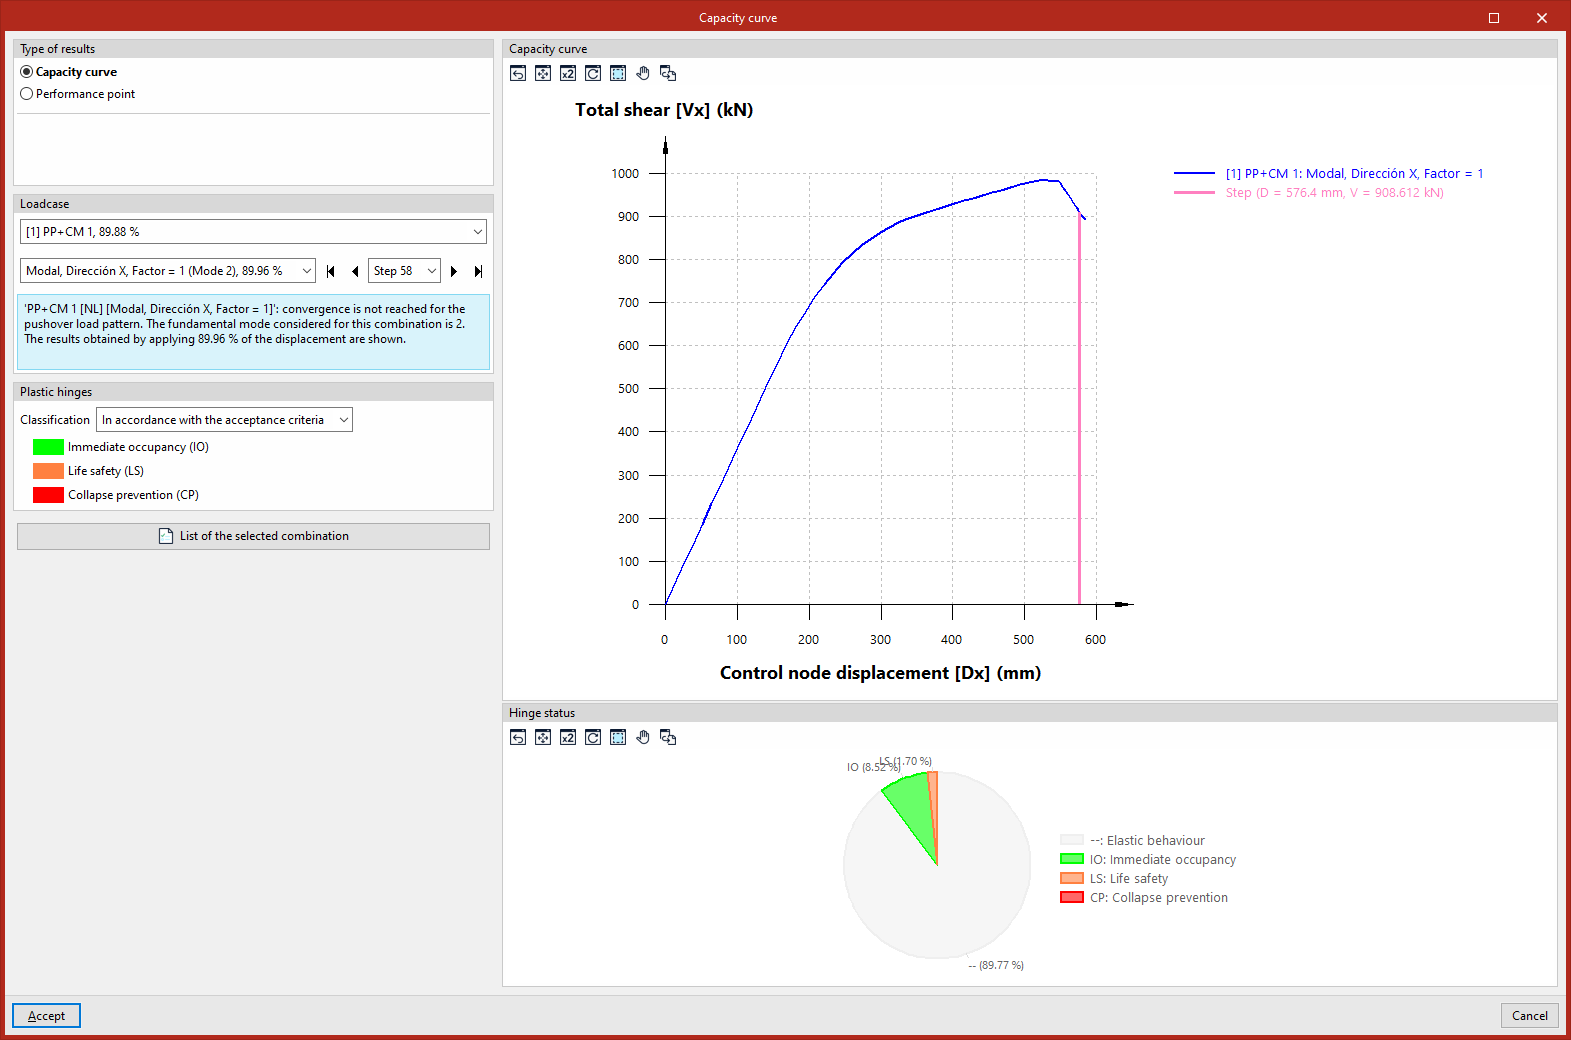
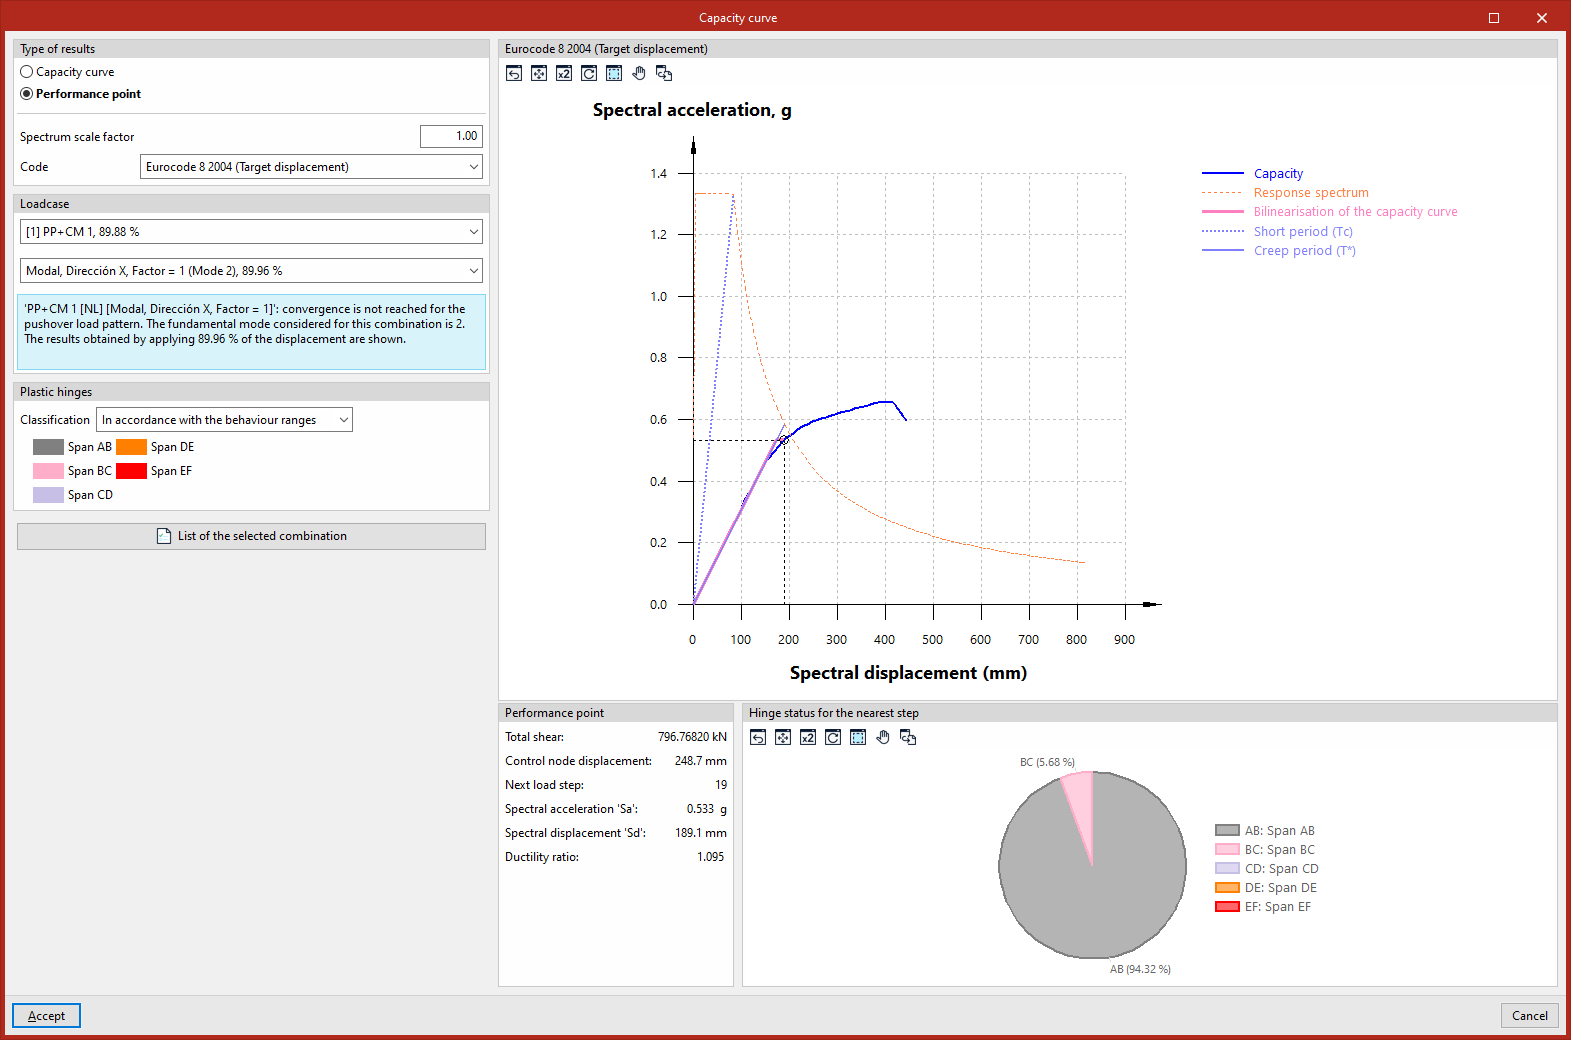
Clicking on this option opens the "Capacity curve" window. Here, under "Result type", you can select whether you wish to view the "Capacity curve" or the "Performance point":
Capacity curve
The capacity curve represents the structural response of the building to increasing lateral loads. If "Capacity curve" is selected under "Result type", the capacity curve is displayed in the blue graph on the right using the relationship between the "Control node displacement" on the x-axis and the "Total shear force" on the y-axis.
Selection of the load case
The capacity curve shown is that obtained for the load case and lateral load pattern selected from the drop-down menus in the "Load case" panel on the left.
On the label of the load case and/or load pattern, the fundamental mode considered is shown in brackets, whilst the percentage value indicates that the results shown have been obtained by applying that percentage of the target displacement.
Furthermore, in this panel, you can also select a specific load from the drop-down menu or navigate between loads using the various buttons provided. When a load is selected, the line on the capacity curve that defines the pair of displacement and shear values corresponding to that load is highlighted in magenta.
This panel also displays a warning if convergence is not achieved for the selected load pattern.
If the target displacement is reached, the "Limit displacement" value is displayed, the "Monitored displacement" (Dx or Dy) is indicated, and the "Control node" reference is shown.
Checking the condition of the plastic hinges
In the "Plastic hinges" panel on the left, you can define the "Classification" by selecting one of the following options:
- "In accordance with the acceptance criteria" ("Immediate Occupancy (IO)", "Life Safety (LS)", "Collapse Prevention (CP)"),
- Or "In accordance with the performance zones" of the hinges ("Zone AB", "Zone BC", "Zone CD", "Zone DE", "Zone EF").
Consequently, the pie chart in the "Condition of hinge" section, in the bottom right-hand corner, shows the percentage of hinges in each condition for the selected load, pattern and load step.
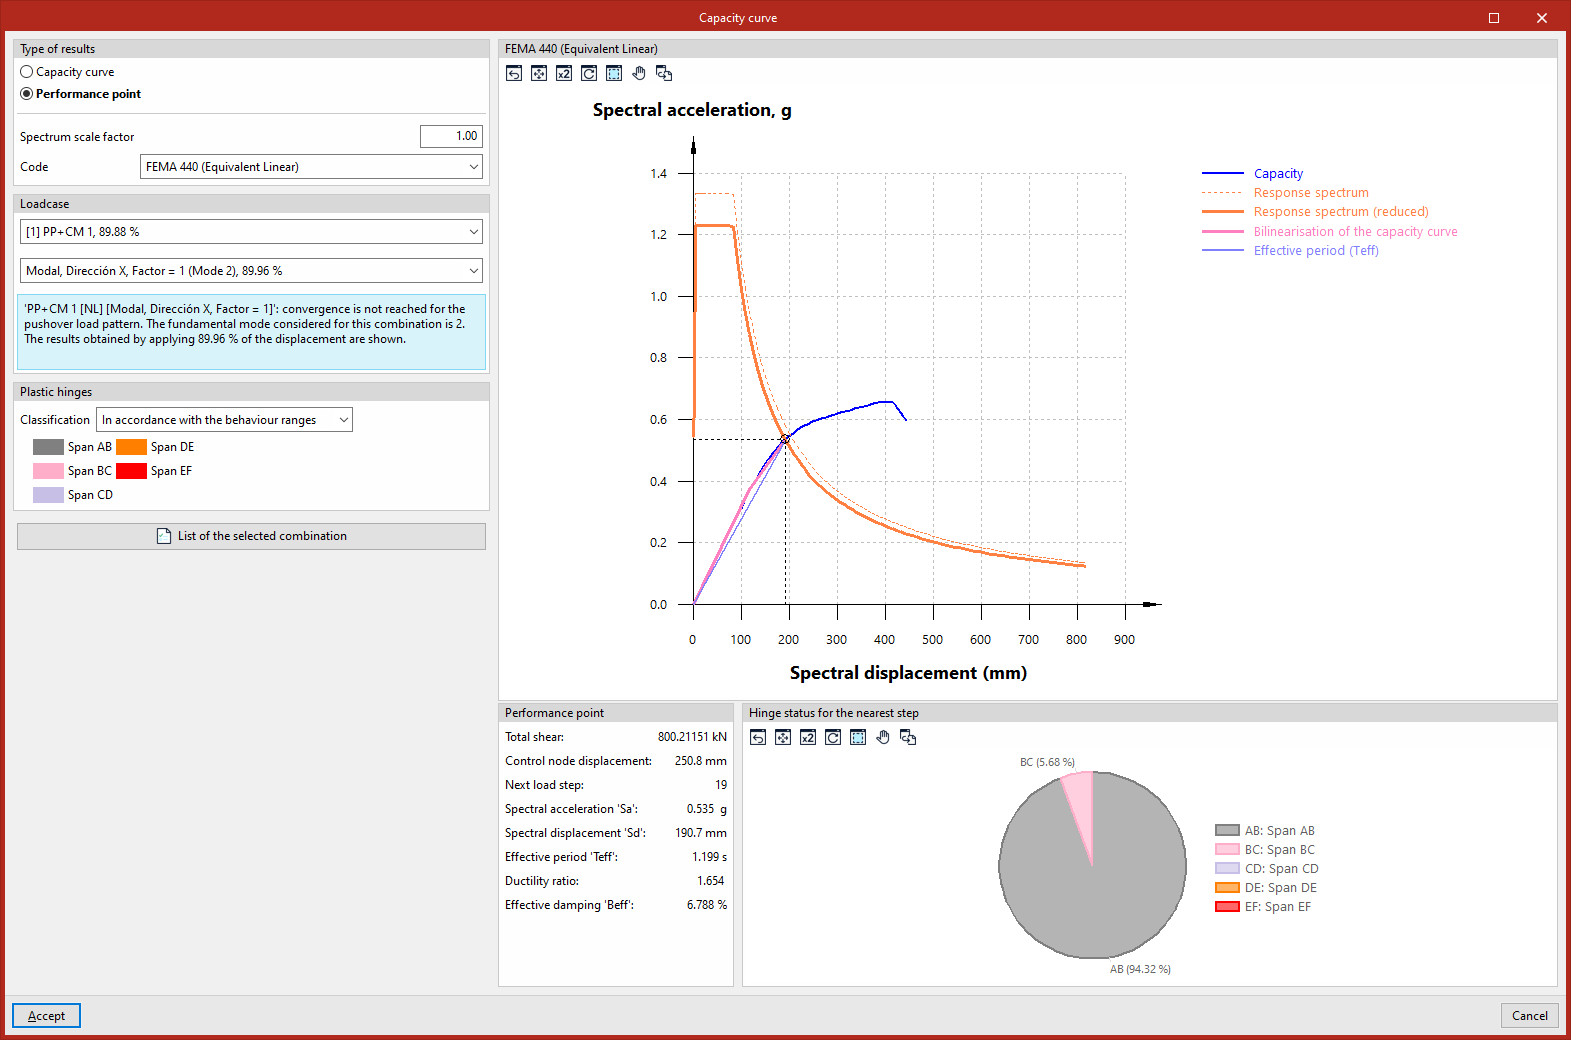
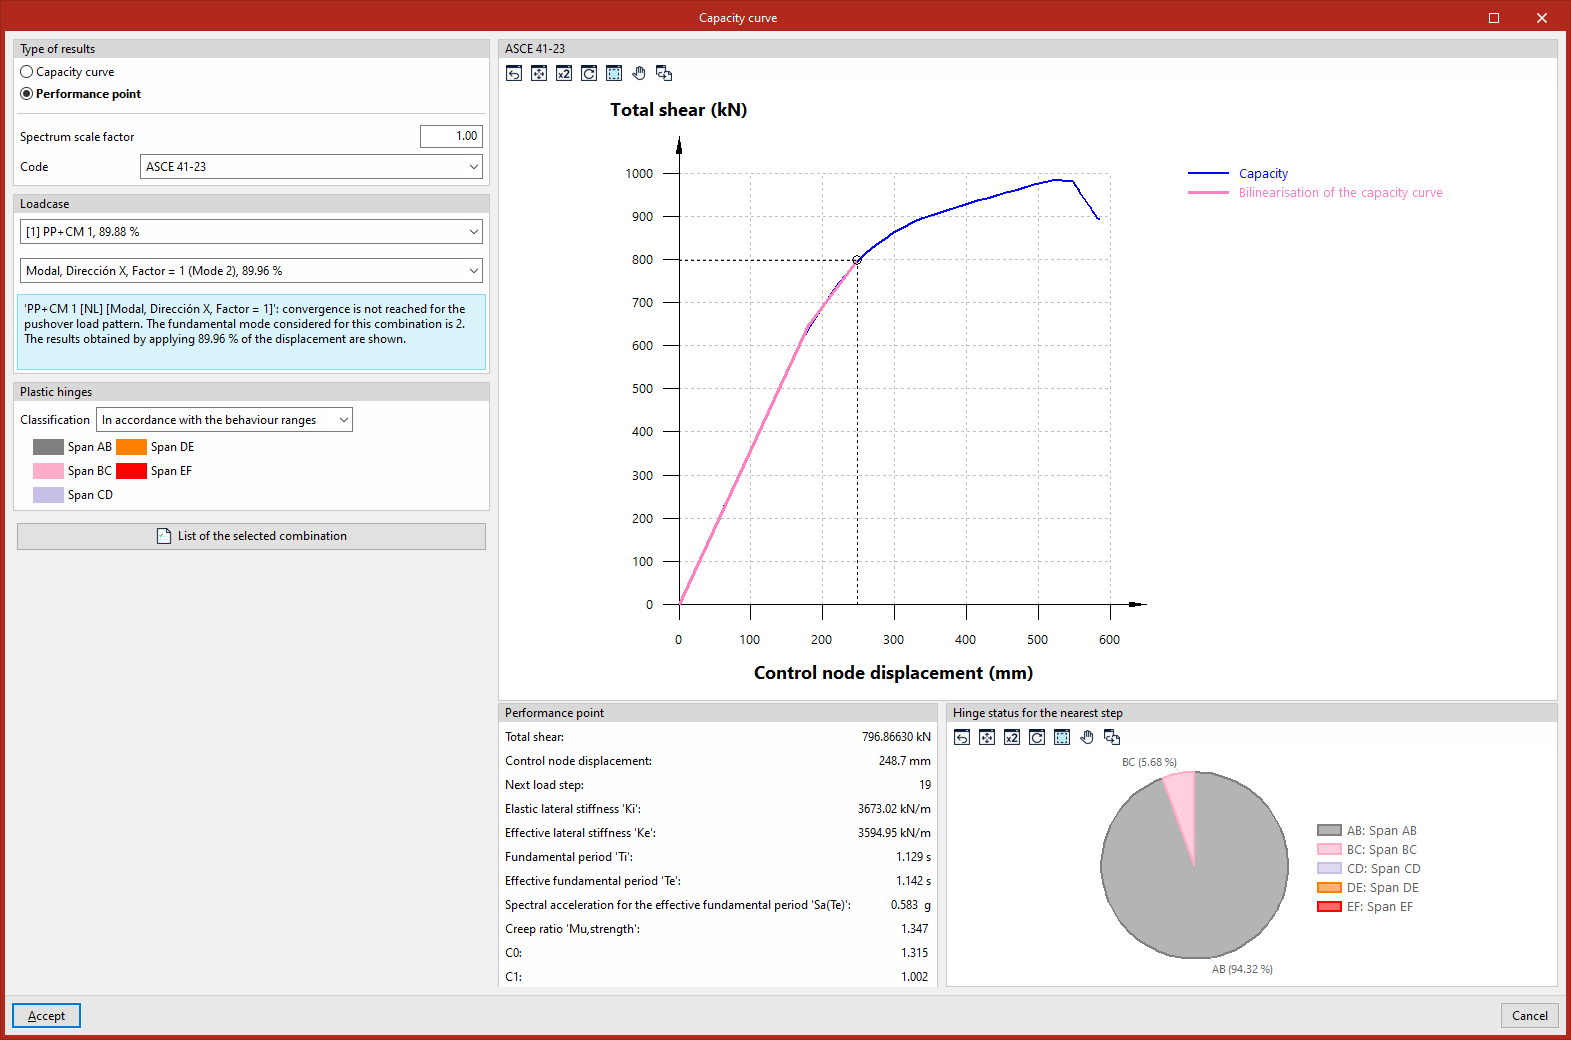
Performance indicator
The performance point is the point at which the structure’s capacity equals the reduced seismic demand imposed on it.
Settings
There are several methods for determining the performance point, which can be selected from the "Standard" drop-down menu:
- Based on the selected seismic code
The program calculates the performance level based on the seismic code selected in the "General data" section. The methods implemented for the different codes are described in the following options. - FEMA 440 (Equivalent linearisation)
The program calculates the performance point using the Equivalent linearisation method (FEMA-440, 6.4 – Procedure A). This is a CSM (Capacity Spectrum Method). - ASCE 41-23
The program calculates the performance point using the Displacement Modification Method (ASCE 41-23, 7.4.3.3.2). This is a DCM (Displacement Control Method) - Eurocode 8-2004 (Target displacement)
The program calculates the performance point using the N2 Method (Eurocode 8, Annex B). This is a CSM (Capacity Spectrum Method).
In addition, the program allows the user to adjust the "Spectrum scaling factor" as required.
Data query
Once a solution method has been selected, the graph on the right shows the "Spectral displacement (mm)" on the x-axis, whilst the y-axis shows the "Spectral acceleration, g", beneath which both the capacity curve and the elastic spectrum (defined in "General data", "With dynamic earthquake") are represented through a series of transformations.
The exact point at which a structure’s load-bearing capacity meets the seismic forces to which it is exposed represents the likely displacement the building will undergo during a specific earthquake.
The "Performance point" panel at the bottom displays data such as "Total Shear", "Control node displacement" and "Nearest load step".
The performance score obtained using the methods set out in the various standards should be reasonably similar.
Check the status of the plastic step covers for the nearest step
In the "Plastic hinges" panel on the left, you can define the "Classification" by selecting one of the following options:
- "According to the acceptance criteria" ("Immediate Occupancy (IO)", "Life Safety (LS)", "Collapse Prevention (CP)"),
- or "according to the performance zones" of the hinges ("Zone AB", "Zone BC", "Zone CD", "Zone DE", "Zone EF").
The "Hinge status for the nearest load step" panel, in the bottom right-hand corner, shows the percentage of hinges in each condition for the load step closest to the performance point.
Report
Finally, the program allows you to display on screen or print the "List of selected combinations" by clicking the relevant button in the "Capacity curve" window.
This report lists the data for the selected standard, the analysis parameters, the capacity curve, the step-by-step behaviour of the hinges, and the values associated with the performance point for the selected load case and standard.