Viewing the forces obtained from the pushover analysis
The forces obtained from the pushover analysis can be viewed using the following option, available in the "Stress / Strain" group on the top toolbar, within the "Analysis" tab (under the "Structure" section).

This tool is similar to the one available for viewing force values following a "Stress/Strain" analysis, but with additional features.
Forces
The "Forces" option allows you to plot force diagrams—both normal and shear—on screen for both the bars and the integration bands of the plates, for each step of the pushover analysis.
Selecting forces
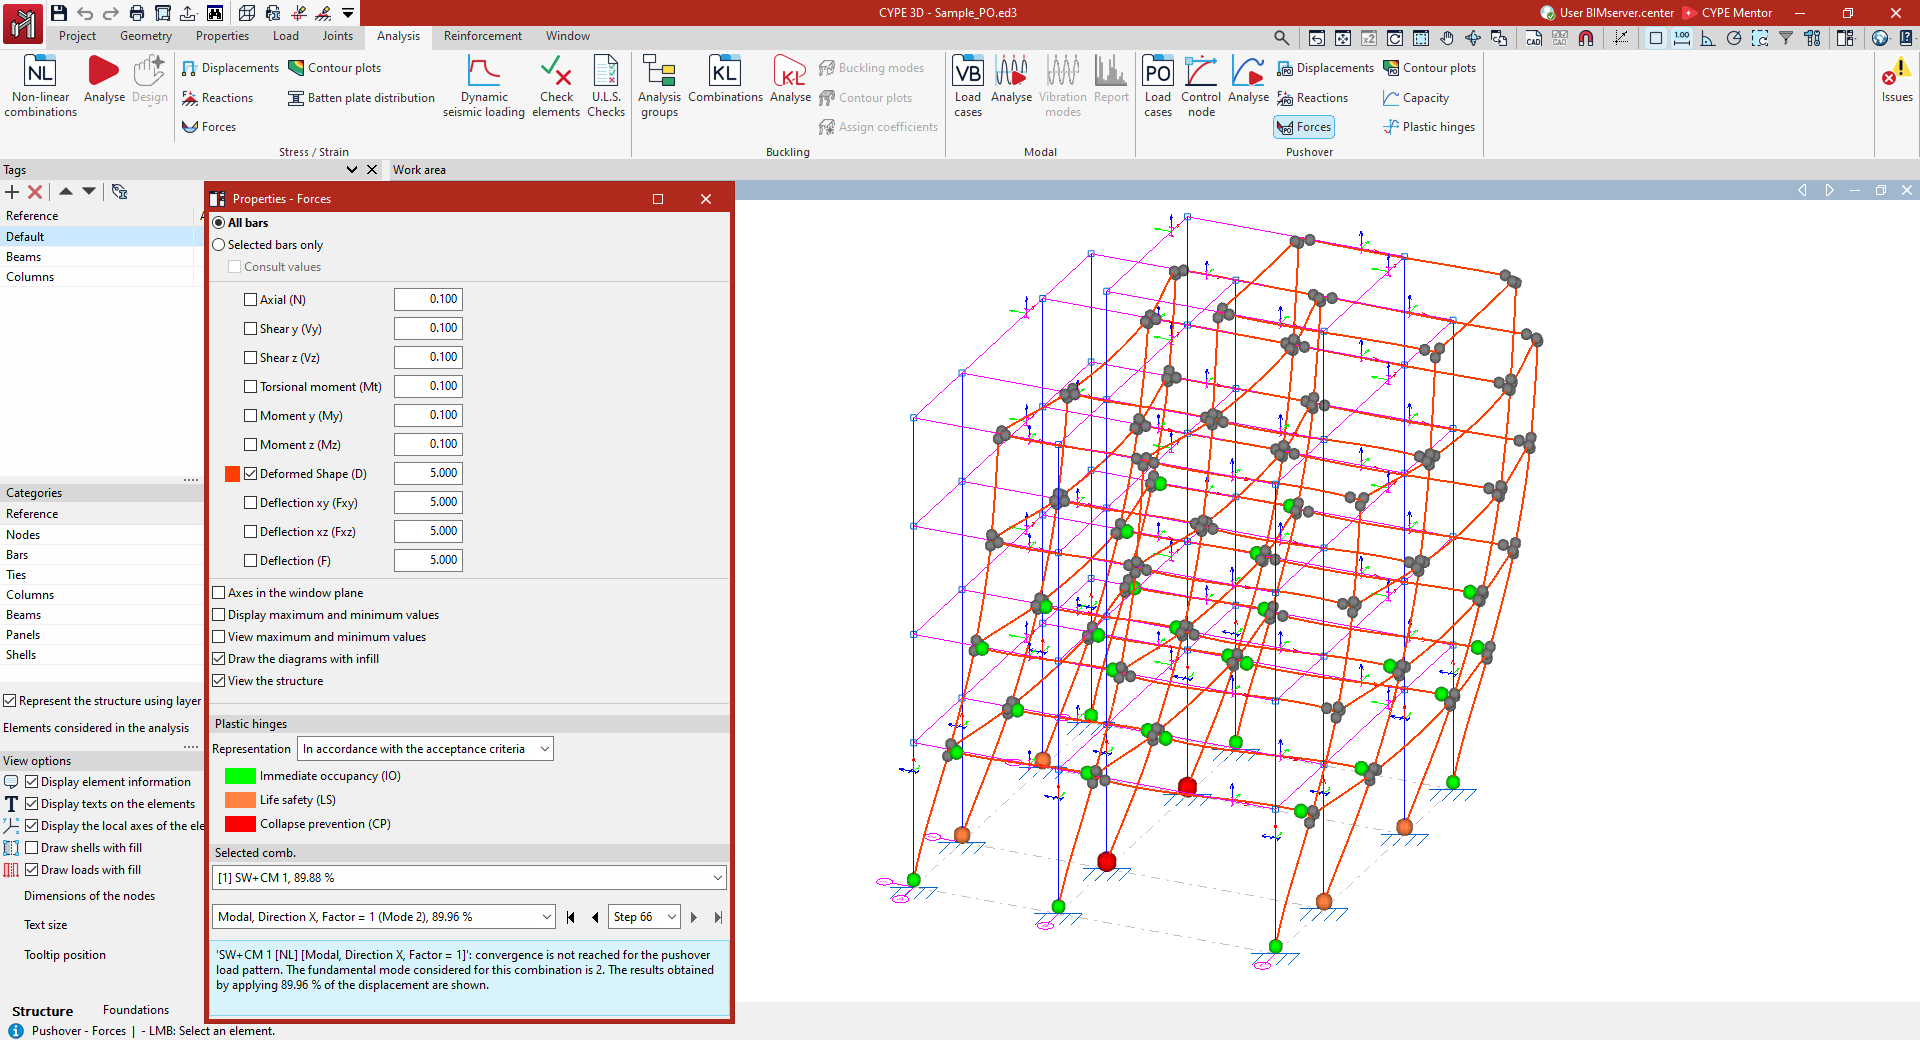
In the "Properties - Forces" dialogue box that appears, you can configure the following options.
First, select the bars you wish to view:
- If "All bars" is selected, the graphs for the selected forces will be plotted for all bars in the structure.
- If you tick "Selected bars only", you will need to click on each bar individually for the force plots to be drawn.
- If you tick the "Show values" box, you can hover the mouse cursor over the bars to display an information box showing the values calculated at that point.
The following metrics can be viewed by ticking the boxes in the central section of the dialogue box:
- The "Axial" force.
- The shear force in both directions ("Y-cutter", "X-cutter").
- The "Torsional moment"
- The bending moment in both directions ("Moment y" and "Moment z").
- The "Deformed shape" part of the structure.
- The "Deflection xy" and the "Deflection xz", which correspond to the two planes of the section.
- The total combined "Deflection".
Each graph is displayed in a different colour. This makes it easier to distinguish between graphs on the screen when several are active at the same time.
In addition, to the right of each parameter, you can adjust the scale factor to change the size of the graph display in the viewer.
Other configuration options
Further down, you will find the following options for configuring the display of stress laws:
- The "Axes in the window plane" option displays the stress plots in a coordinate system with the axes drawn on the window plane. This can be useful for making the plots visible in certain views.
- The "Plot maximum and minimum values" option adds information about the maximum and minimum values reached, as well as their positions, to each graph.
- Finally, if only one graph is active, you can select "Show maximum and minimum values". In this case, you must hover the mouse cursor over the bars for the programme to display the maximum and minimum values for each one.
- You can also configure the stress curves to be displayed as filled shapes by ticking the "Draw curves with fill" box.
- Finally, the "View the structure" option allows you to display the structure on screen in its original position.
Plastic hinges
In the "Plastic hinges" panel, you can define the "Classification" of the hinges by selecting one of the following options:
- "According to the acceptance criteria" ("Immediate occupancy (IO)", "Life safety (LS)", "Collapse prevention (CP)"); additionally, the ball joint can be found under "Elastic behaviour (shown in grey).
- Or "according to the performance zones" of the ball joints ("Zone AB", "Zone BC", "Zone CD", "Zone DE", "Zone EF").
In this way, the hinges will be represented as coloured spheres in the "Work area", scaled according to their state based on the defined classification and the selected load case, load pattern and load step, thereby enabling the behaviour of the structure to be analysed and potential failure mechanisms to be identified.
Selected combination
The results obtained for the load case and lateral load pattern selected from the drop-down menus in the "Selected Comb." panel will be displayed.
On the label of the load case and/or load pattern, the fundamental mode considered is shown in brackets, whilst the percentage value indicates that the results shown have been obtained by applying that percentage of the target displacement.
In addition, in this panel, you can select a specific level from the drop-down menu or navigate between levels using the various buttons provided.
This panel also displays a warning if convergence is not achieved for the selected load pattern.
If the target displacement is reached, the "Limit displacement" value is displayed, the "Monitored displacement" (Dx or Dy) is indicated, and the "Control node" reference is shown.
| Note: |
|---|
| The settings defined in the "Selected Comb." and "Plastic hinge" panels are shared with the other options for viewing pushover analysis results and are synchronised across them. In this way, the settings defined when viewing specific results upon accessing one option (for example, the display of results for a specific step) are retained when accessing another related option. |