Checking results for plastic hinges obtained from the pushover analysis
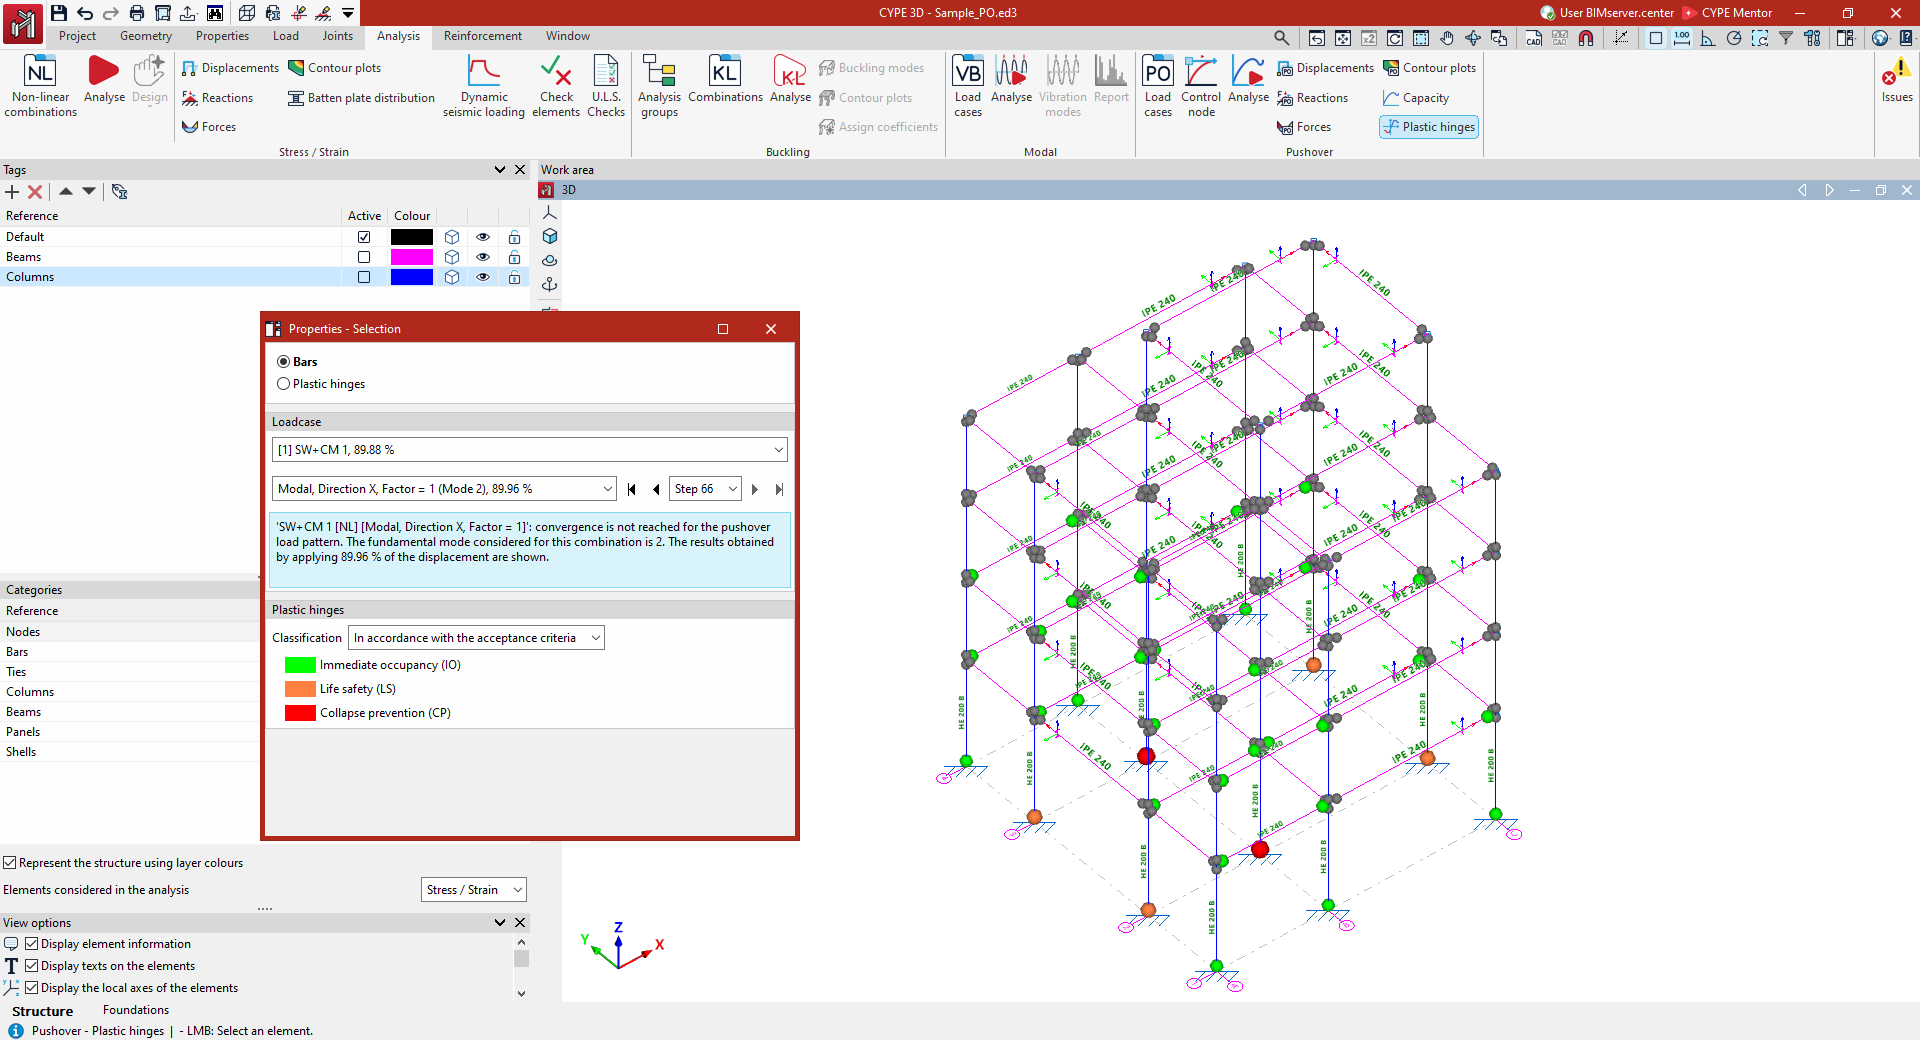
The results for plastic hinges obtained following the pushover analysis can be viewed using the "Plastic hinges" option, available in the "Pushover analysis" section of the top toolbar, within the "Analysis" tab (under the "Structure" tab):

Plastic hinges
Options in the "Properties-Selection" panel
Clicking on the "Plastic hinges" option opens the "Properties-Selection" window. Here, you must first select one of the following options:
- Bars
Displays the results for the plastic hinges defined in the selected bar. - Plastic hinges
Displays the individual results for the selected plastic hinge.
Load case
The results for the selected load case and lateral load pattern from the drop-down menus in the "Load case" panel on the left will be displayed.
On the label of the load case and/or load pattern, the fundamental mode considered is shown in brackets, whilst the percentage value indicates that the results shown have been obtained by applying that percentage of the target displacement.
In addition, in this panel you can select a specific level from the drop-down menu or navigate between levels using the various buttons provided.
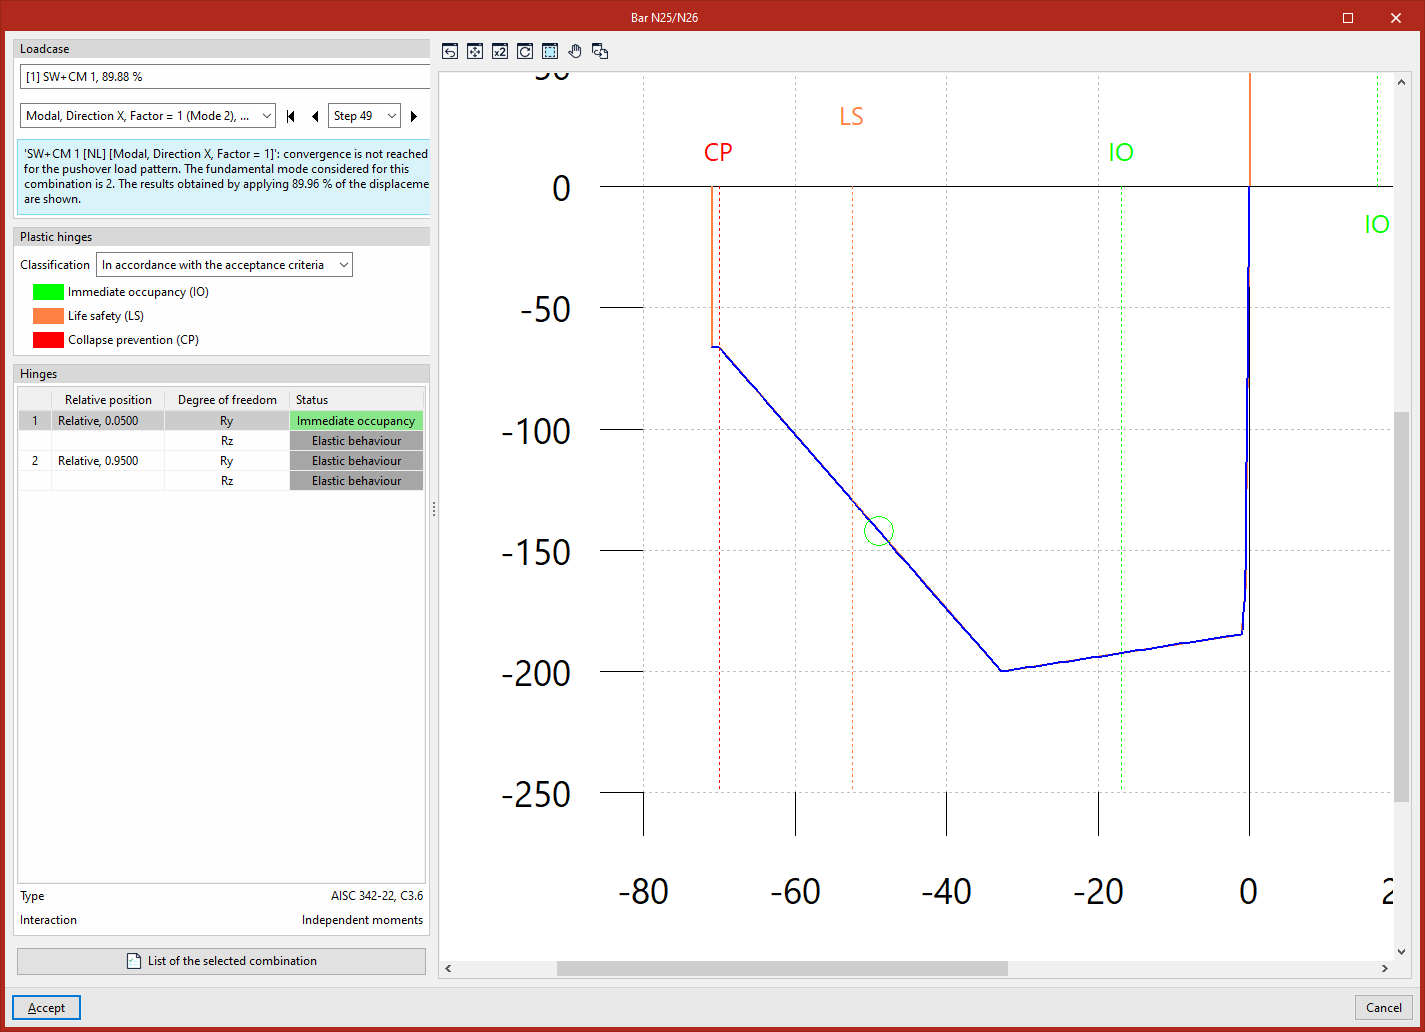
This panel also displays a warning if convergence is not achieved for the selected load pattern.
If the target displacement is reached, the "Limit displacement" value is displayed, the "Monitored displacement" (Dx or Dy) is indicated, and the "Control node" reference is shown.
Plastic hinges
In the "Plastic hinges" panel on the left, you can define the "Classification" by selecting one of the following options:
- "In accordance with the acceptance criteria" ("Immediate occupancy (IO)", "Life safety (LS)", "Collapse prevention (CP)"); additionally, the hinge can be found under "Elastic behaviour (shown in grey);
- "In accordance with the performance zones" of the hinges ("Zone AB", "Zone BC", "Zone CD", "Zone DE", "Zone EF").
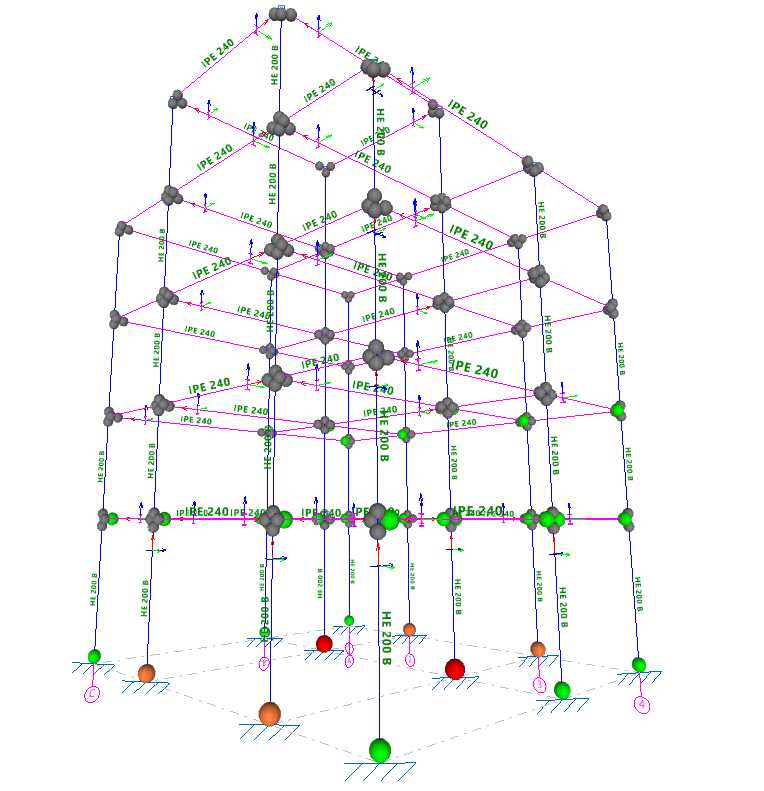
This way, the hinges will be represented as coloured spheres in the "Work area", scaled according to their state based on the defined classification and the selected load case, load pattern, and load step, thereby enabling the structure's behaviour to be analysed and potential failure mechanisms to be identified.
Checking the moment-rotation diagram for plastic hinges
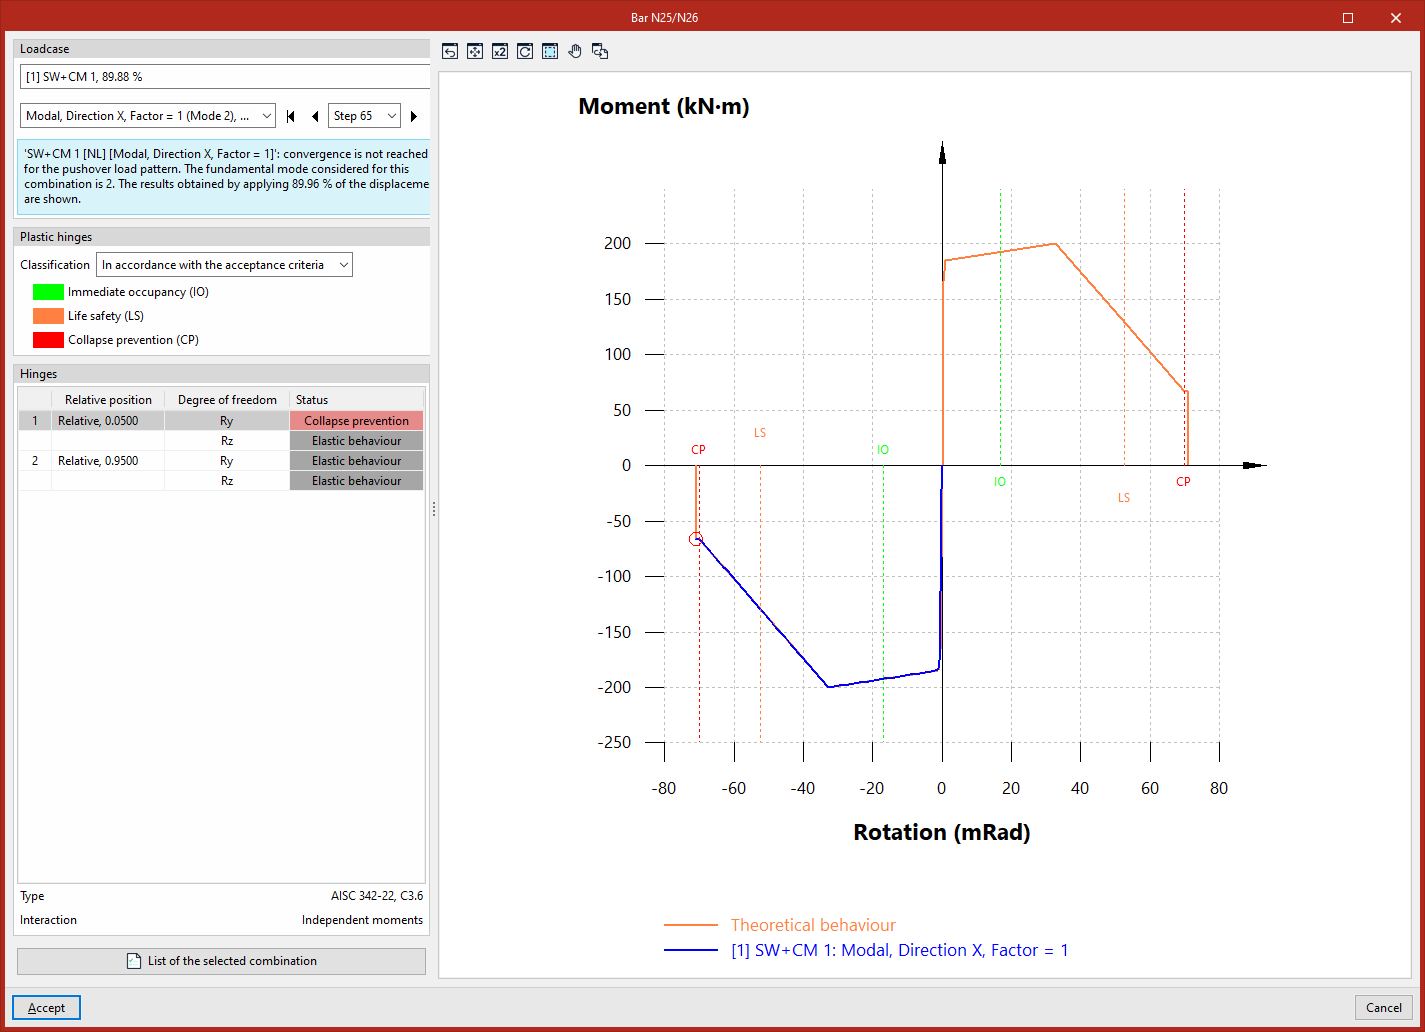
When you click on a bar or a plastic hinge (depending on whether the "Bars" or "Plastic hinges" option has been selected in the "Properties-Selection" panel), the program will open a window allowing you to view the moment-rotation diagram (backbone curve) for the hinges assigned to the selected beam or the selected plastic hinge.
Here, you first select the load case, lateral pattern and step from the drop-down menus in the "Load case" panel on the left, in the same way as when viewing the other results of the pushover analysis.
In the "Plastic hinges" panel on the left, you can define the "Classification" as "According to acceptance criteria" or "According to the performance stages of the hinges". This will mark and label the different stages on the diagram using a dashed line.
The "Hinges" panel at the bottom lists the hinges that can be viewed in the window. For each entry in the list, the hinge number, its "Relative position" with respect to the bar, its "Degree of freedom", and its "Status" at the selected step and according to the previously selected classification are indicated. The bottom section displays the "Type" of each hinge and its "Interaction" ("Independent moments" or "Axil-My-Mz" interaction).
Moment-rotation diagram for plastic hinges with independent moments
The graph shows the "Theoretical behaviour" of the selected ball-and-socket joint (at the selected degree of freedom) in orange, and the actual behaviour of the joint obtained from the pushover analysis performed by the software in blue.
A circle (coloured according to the condition of the hinge, using the same criteria as in the workspace)marks the exact point on the actual performance curve where the hinge is located at the selected step. Thus, by navigating between different steps, you can observe the movement of the circle along the actual performance curve.
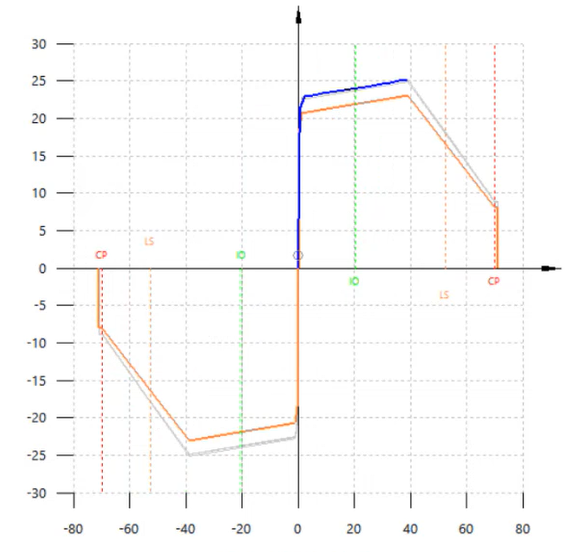
Moment-rotation diagram for plastic hinges with axial-moment-moment interaction
In the "Axil-My-Mz" interaction hinges, the "Theoretical behaviour" curve is different for each step. However, the hinge’s operating point (represented by the circle shown) always lies on both the actual performance curve (in blue) and the theoretical performance curve for the selected stage (in orange). This curve is scaled by the value of the axil.
The remaining theoretical performance curves associated with the unselected steps are shown in light grey.
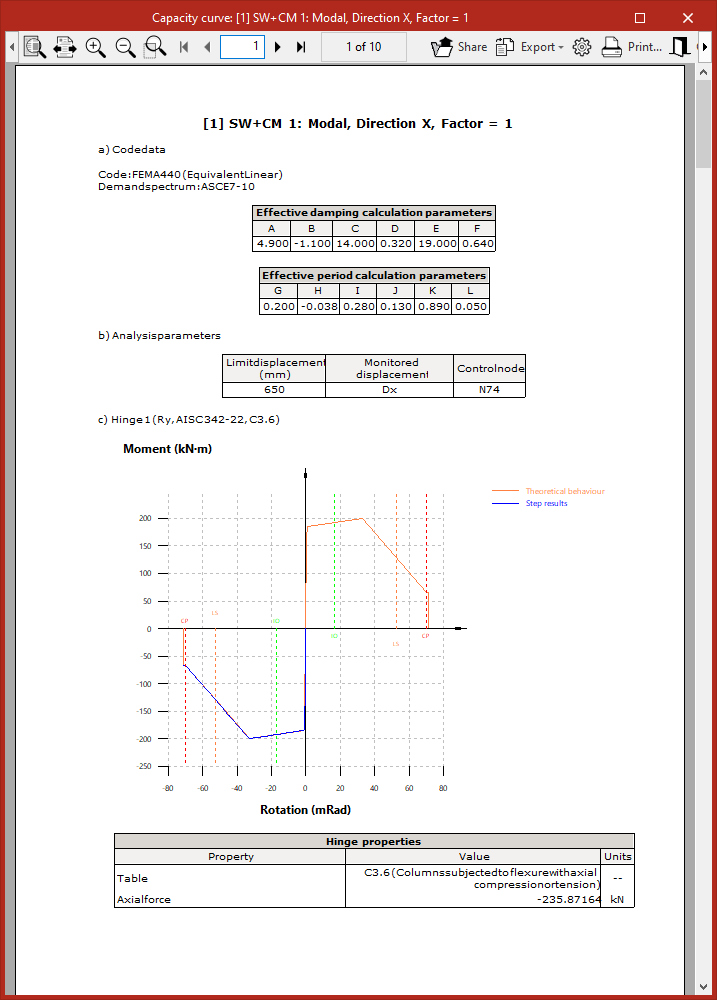
Report
Finally, the program allows you to display on screen or print the "List of selected combinations" by clicking on the relevant button in the plastic hinge query window.
This report lists the data for the selected standard, the analysis parameters, and the moment-rotation diagram for each hinge and selected degree of freedom, including the "Hinge properties" and a numerical table showing the "Results per step".