
Display of modal analysis results by vibration mode
The results of the modal vibration analysis can be displayed on screen using the following option, which is available in the "Modal" section of the top toolbar, within the "Analysis" tab (under the "Structure" tab).

Vibration modes
Once the analysis has been carried out, the "Vibration modes" option allows you to view the results of the modal analysis graphically on screen for each defined loadcase and each vibration mode, including animations.
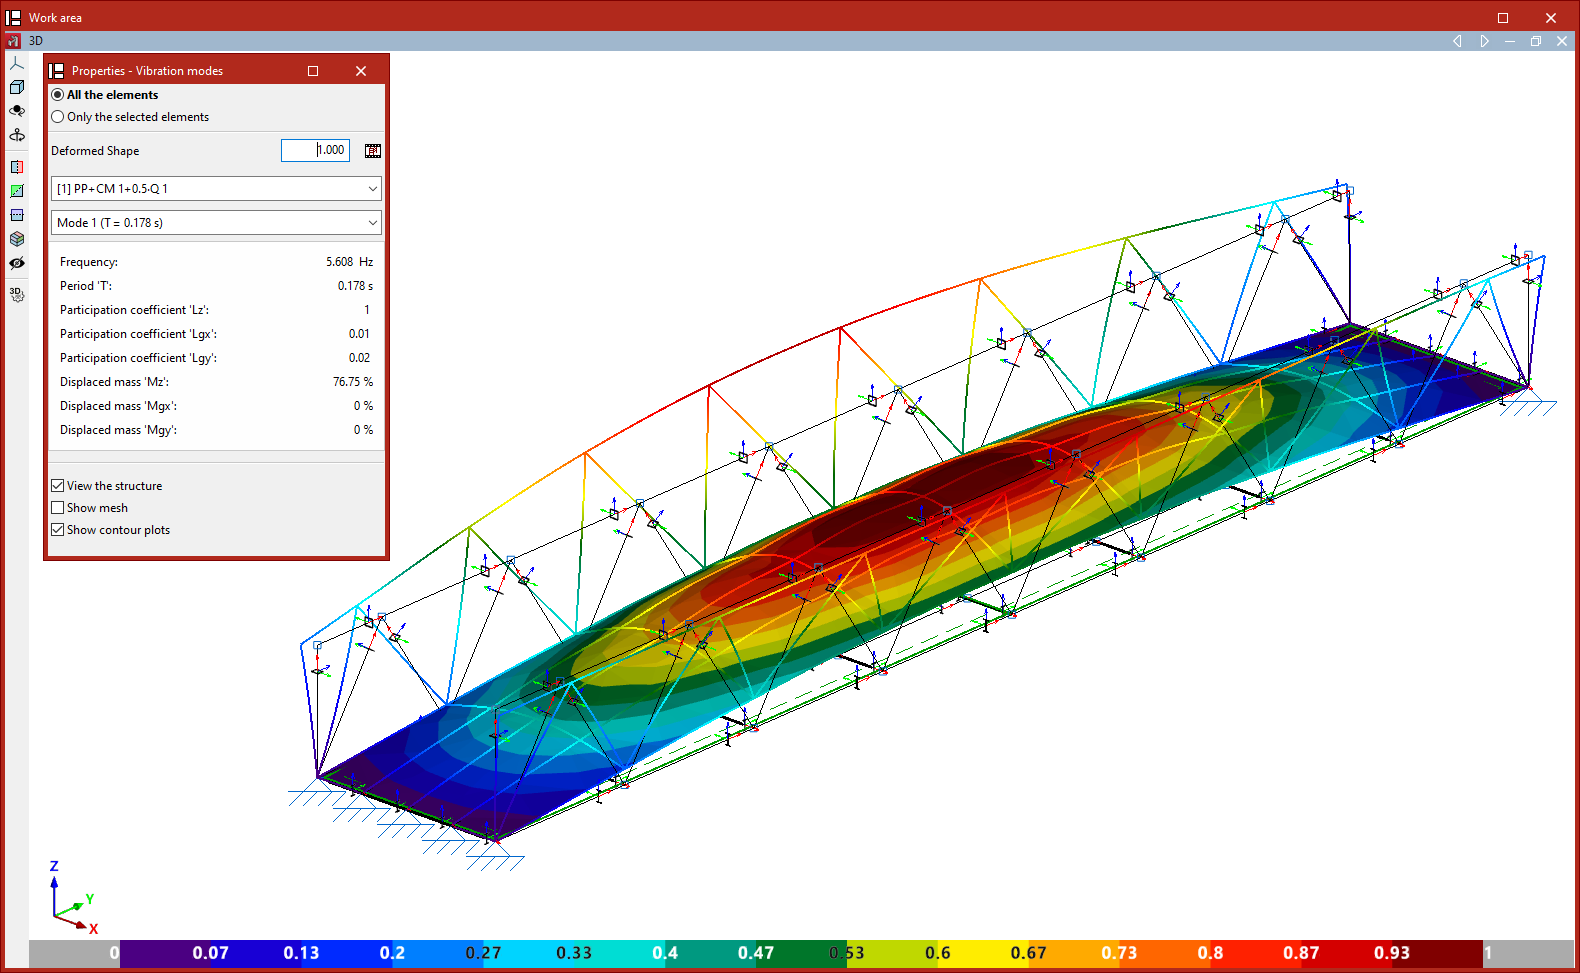
In the "Properties - Vibration modes" window that appears, you can configure how the results are displayed.
First, you must specify whether you wish to view "All the elements" or "Only the selected elements"; in the latter case, you must select the elements in the template by clicking on them with the left mouse button.
Next, a factor is defined for the "Deformed shape" view. Next to this, the button allows you to view an "Animation" of the selected loadcase and vibration mode.
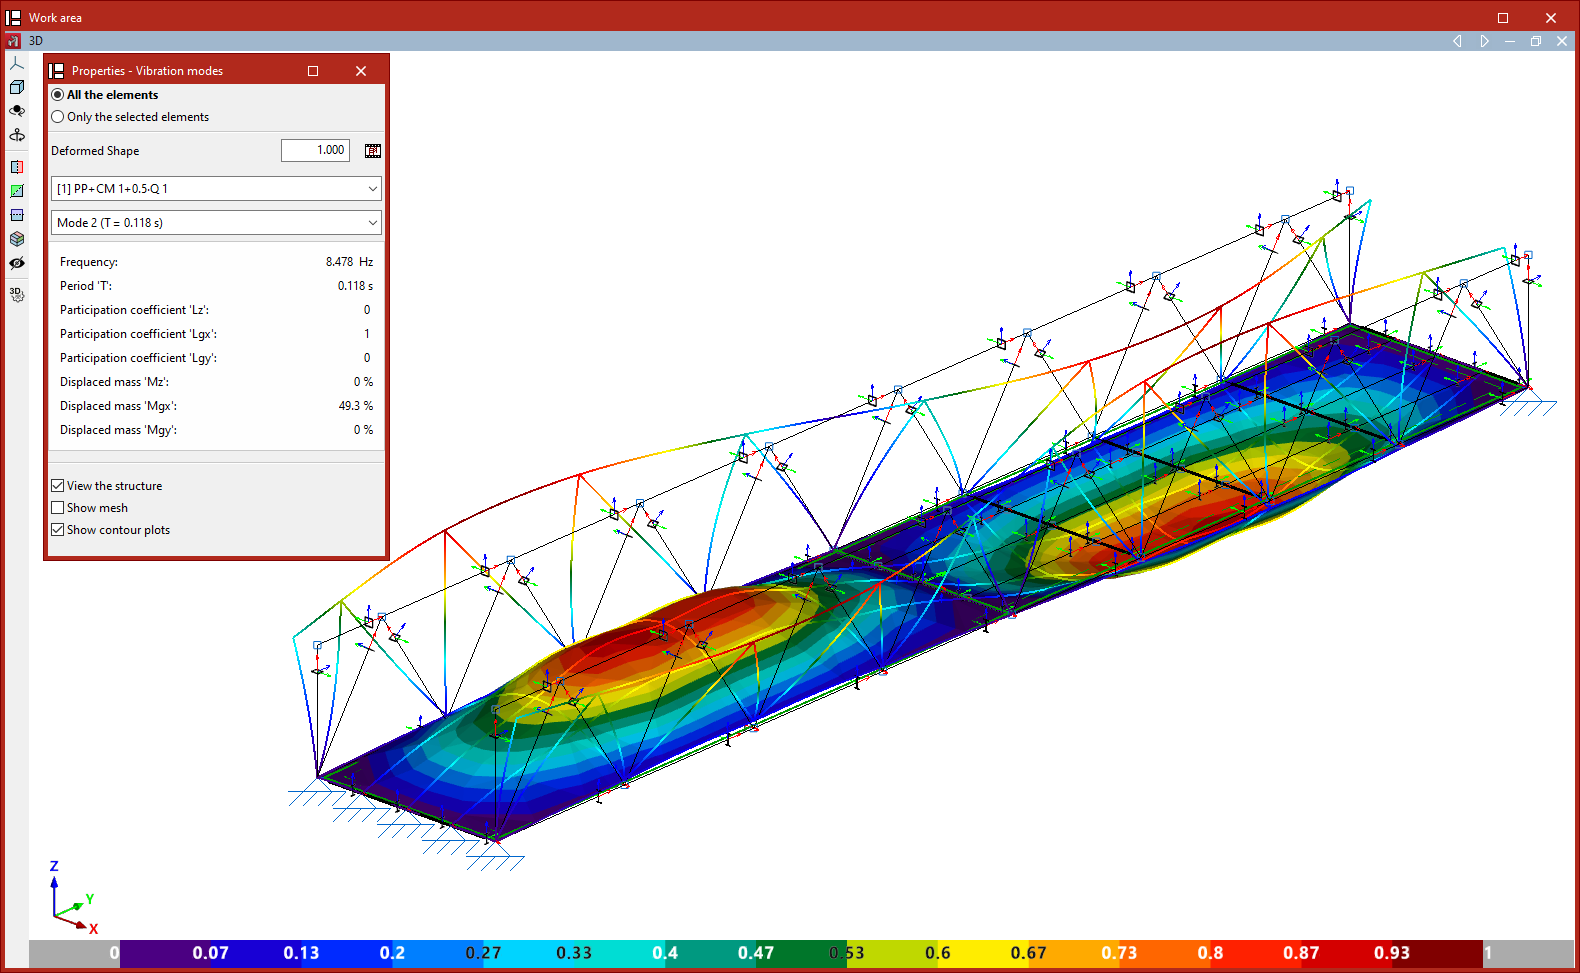
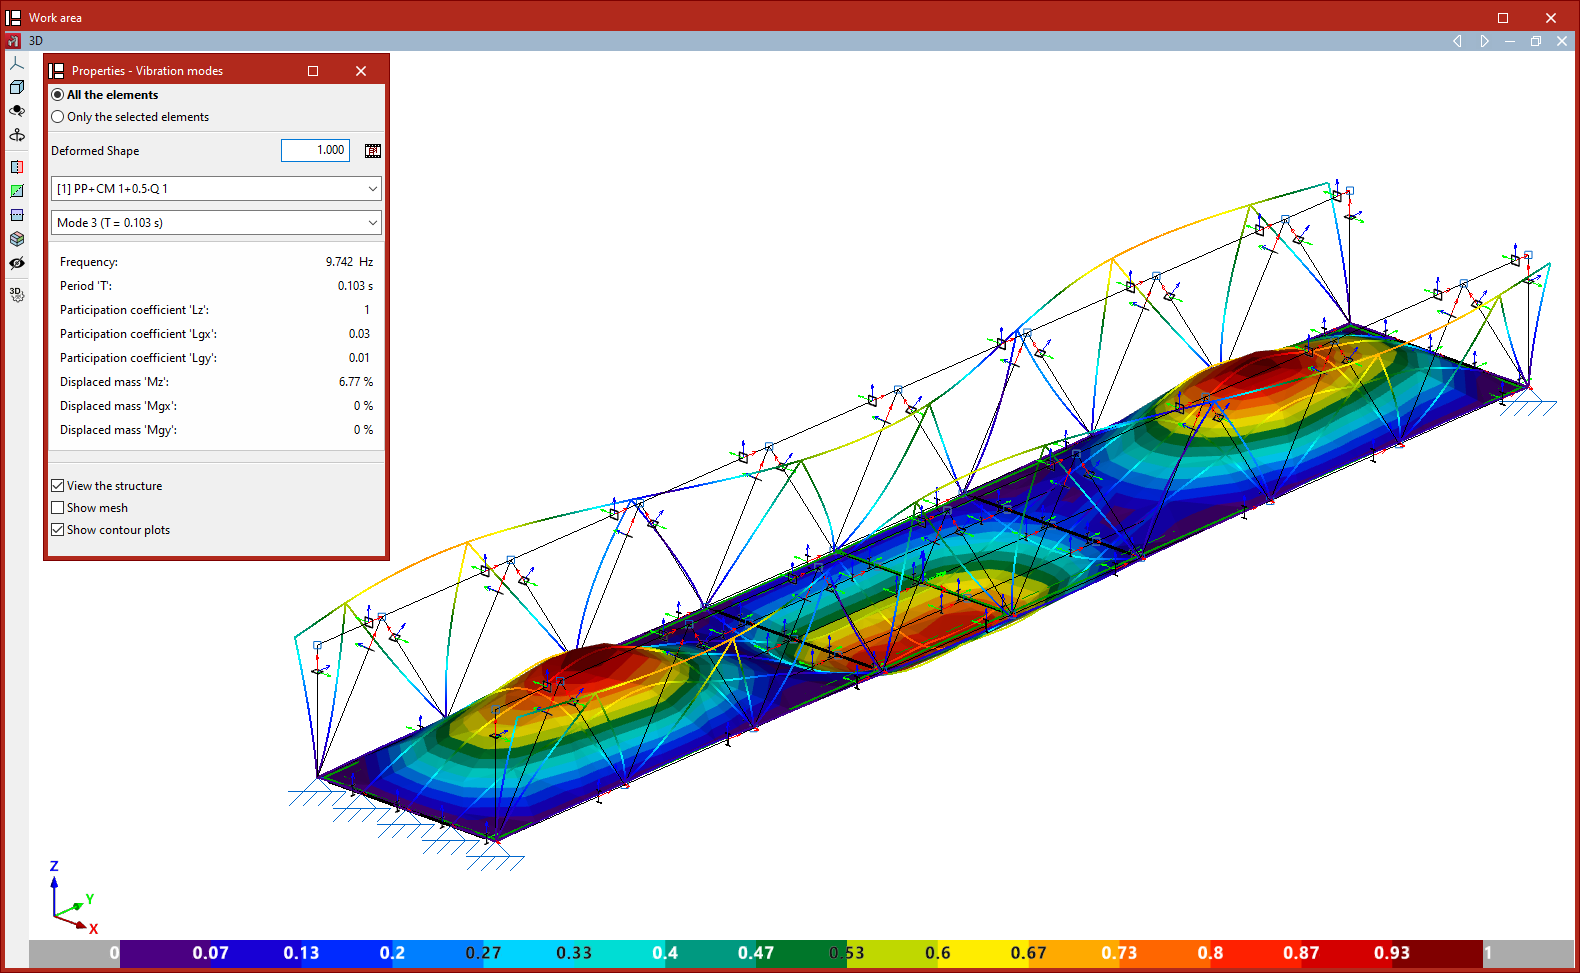
The following two drop-down menus allow you to select the loadcase and vibration mode you wish to view.
The table below shows the values obtained when analysing various parameters for the selected loadcase and vibration mode, such as:
- the frequency,
- the period,
- the participation coefficients in the analysis directions,
- and the percentages of displaced mass in the directions of analysis.
Finally, the "View structure" option allows you to overlay the structure view in the workspace alongside the deformed view.
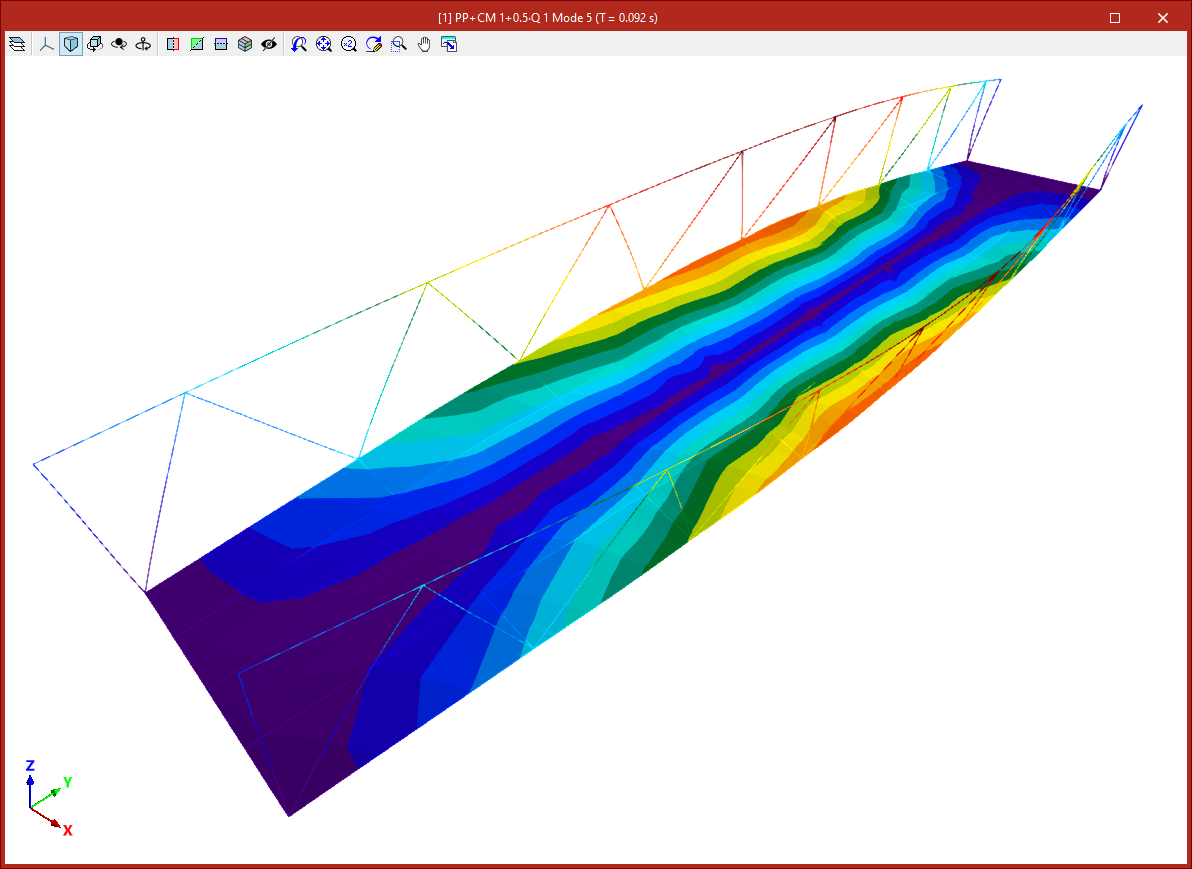
If the model includes shells, the "Show mesh" and "Show contour plots" checkboxes also appear, allowing you to visualise the mesh elements and display the analysed contour plots using a colour gradient.
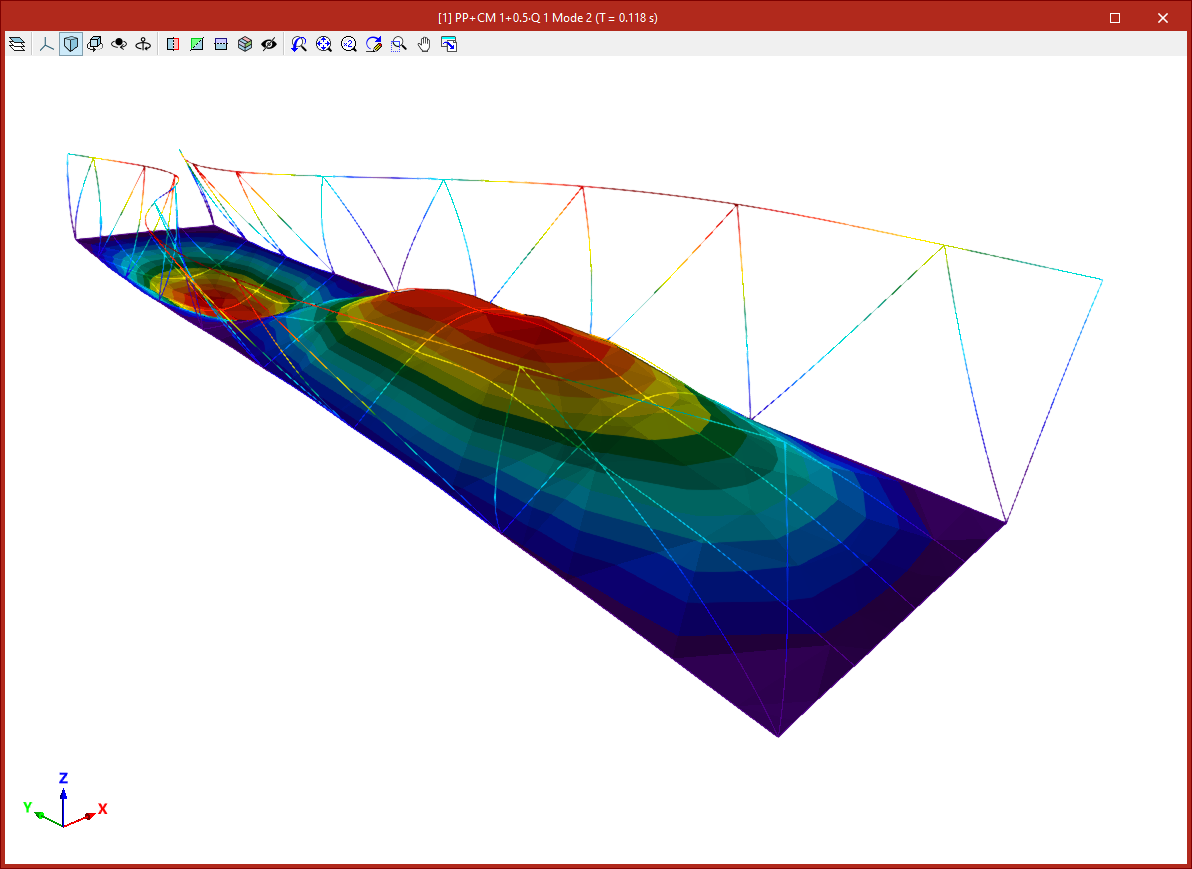
Animations