

The "Analysis" tab interface in the connection editor
Once you have finished defining the connection model in the "Model" tab, you can access the "Analysis" tab in the connection editor, where the connection is analysed and checked.
The interface on this tab displays the following areas:
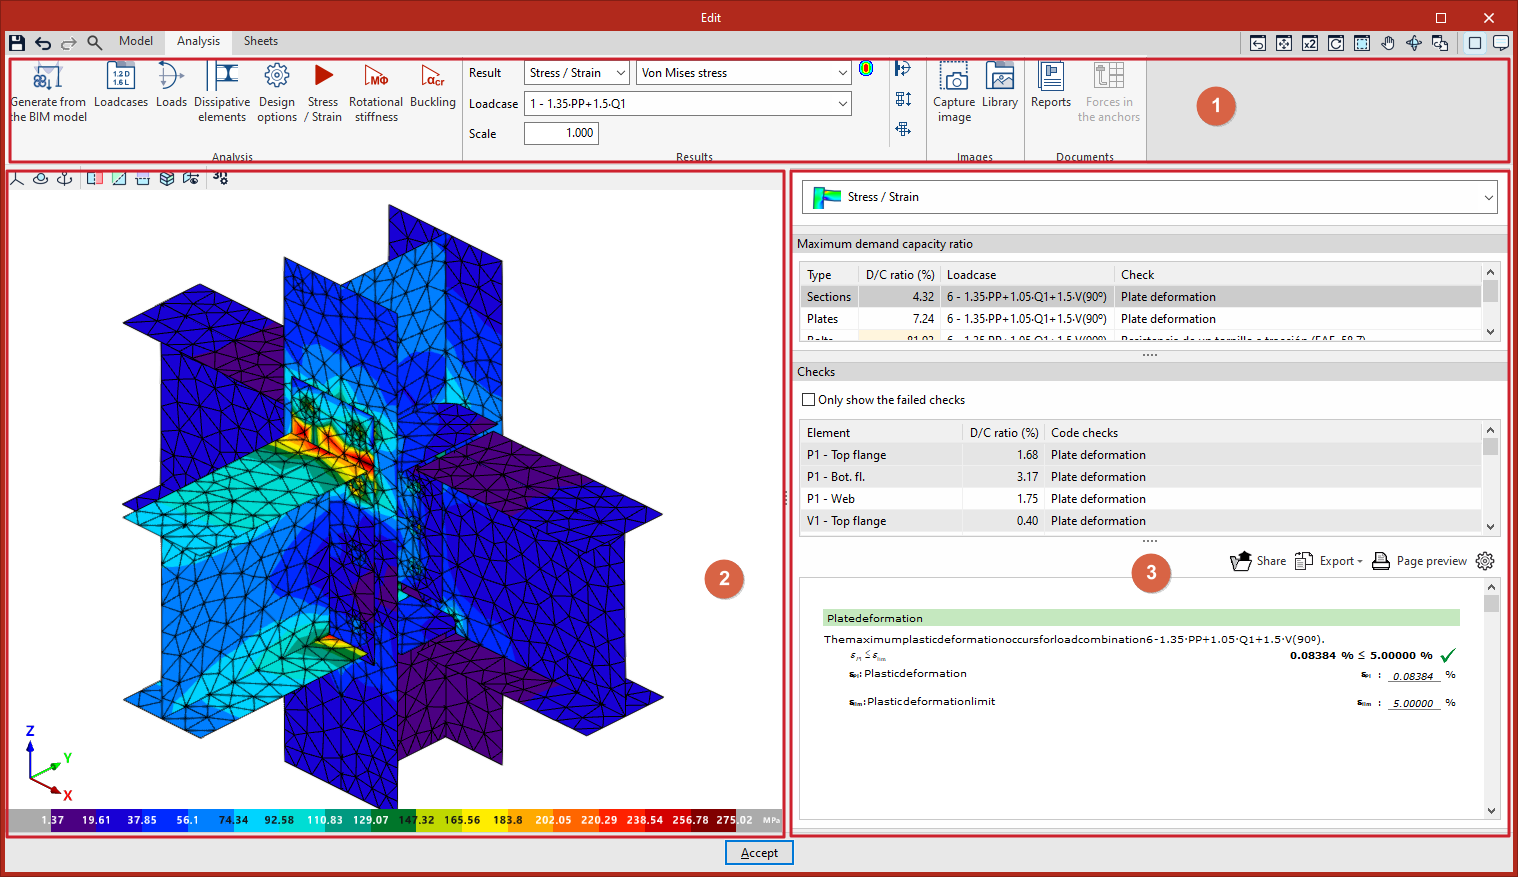
1. Top toolbar
- Define the "Load cases" to be considered, as well as the "Loads" applied to each section.
- Add them manually or generate them from a structural analysis model created using programs such as CYPECAD or CYPE 3D.
- Run the relevant analysis and checks by selecting:
- Stress / Strain
- Rotational stiffness
- Buckling
- View the "Results" using the drop-down menus, then go to the "Images" and "Document" sections associated with the connection.
2. Viewer (left)
View the model with colour coding based on the selected result. Depending on the type of result, you can also display the discretisation (mesh) used for the analysis.
3. Results tables (right)
View the summary tables for the analysis. For example, for "Stress / Strain", you can display:
- The "Maximum demand capacity ratio" of the connection's elements.
- The "Checks" carried out on these components.
Continuation of the workflow
Once you have finished modelling and performing the analysis, go to the "Sheets" tab to create the detailed drawings.