
Viewing buckling analysis results in the connection editor
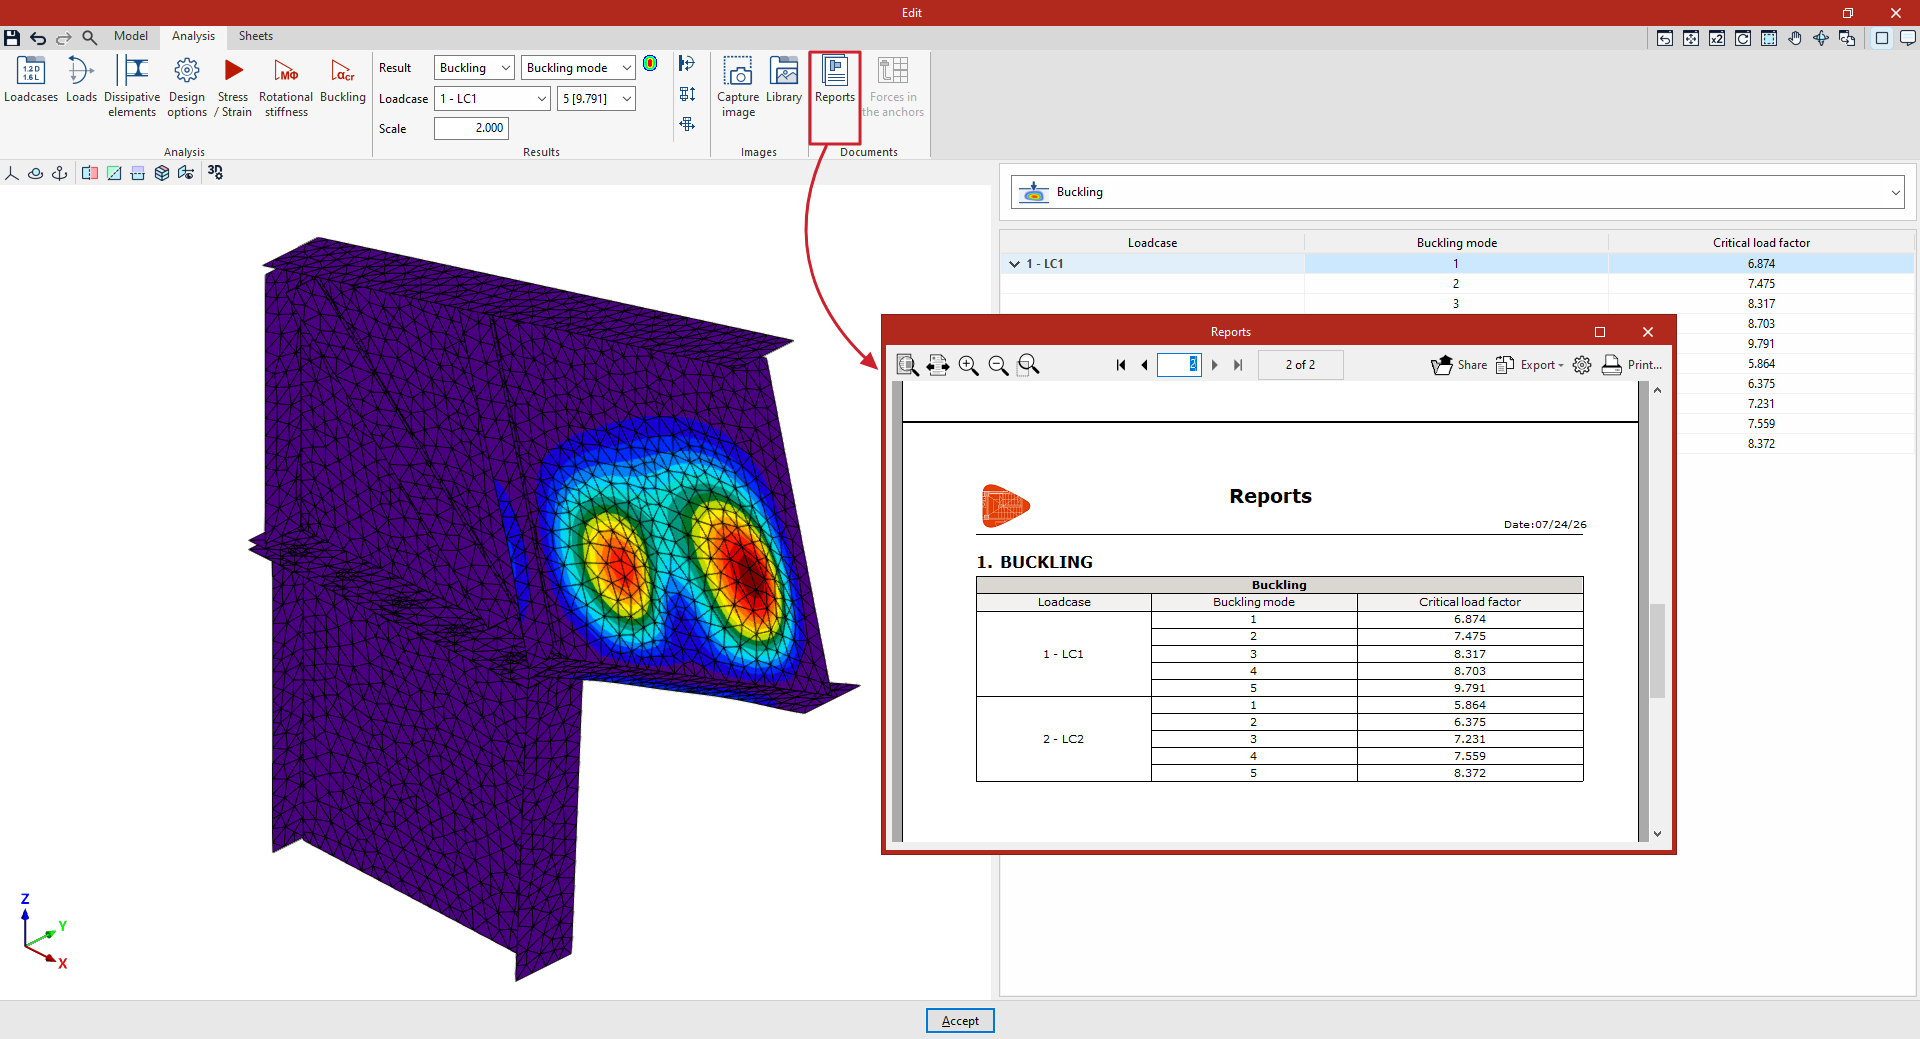
You can view the results after carrying out the buckling analysis of a connection in the program by using the options in the "Results" group on the top toolbar of the "Analysis" tab within the connection editor.

From the "Result" drop-down menu, select "Buckling" and then, from the drop-down menus below, select the "Loadcase" and "Buckling mode" you wish to view.
You can also change the model’s display "Scale" by entering the value in the relevant field.
Deformation
The viewport on the left displays the deformation and contour plots for the selected loadcase and buckling mode, using a colour code, as well as the discretisation of the connection elements.
Critical load factors
In the right-hand panel, selecting "Buckling" from the drop-down menu displays a table showing the "Buckling mode(s)" for each "Loadcase" and their corresponding "Critical load factors".
Clicking on each mode in the table will display the corresponding deformation in the viewer.
Display options
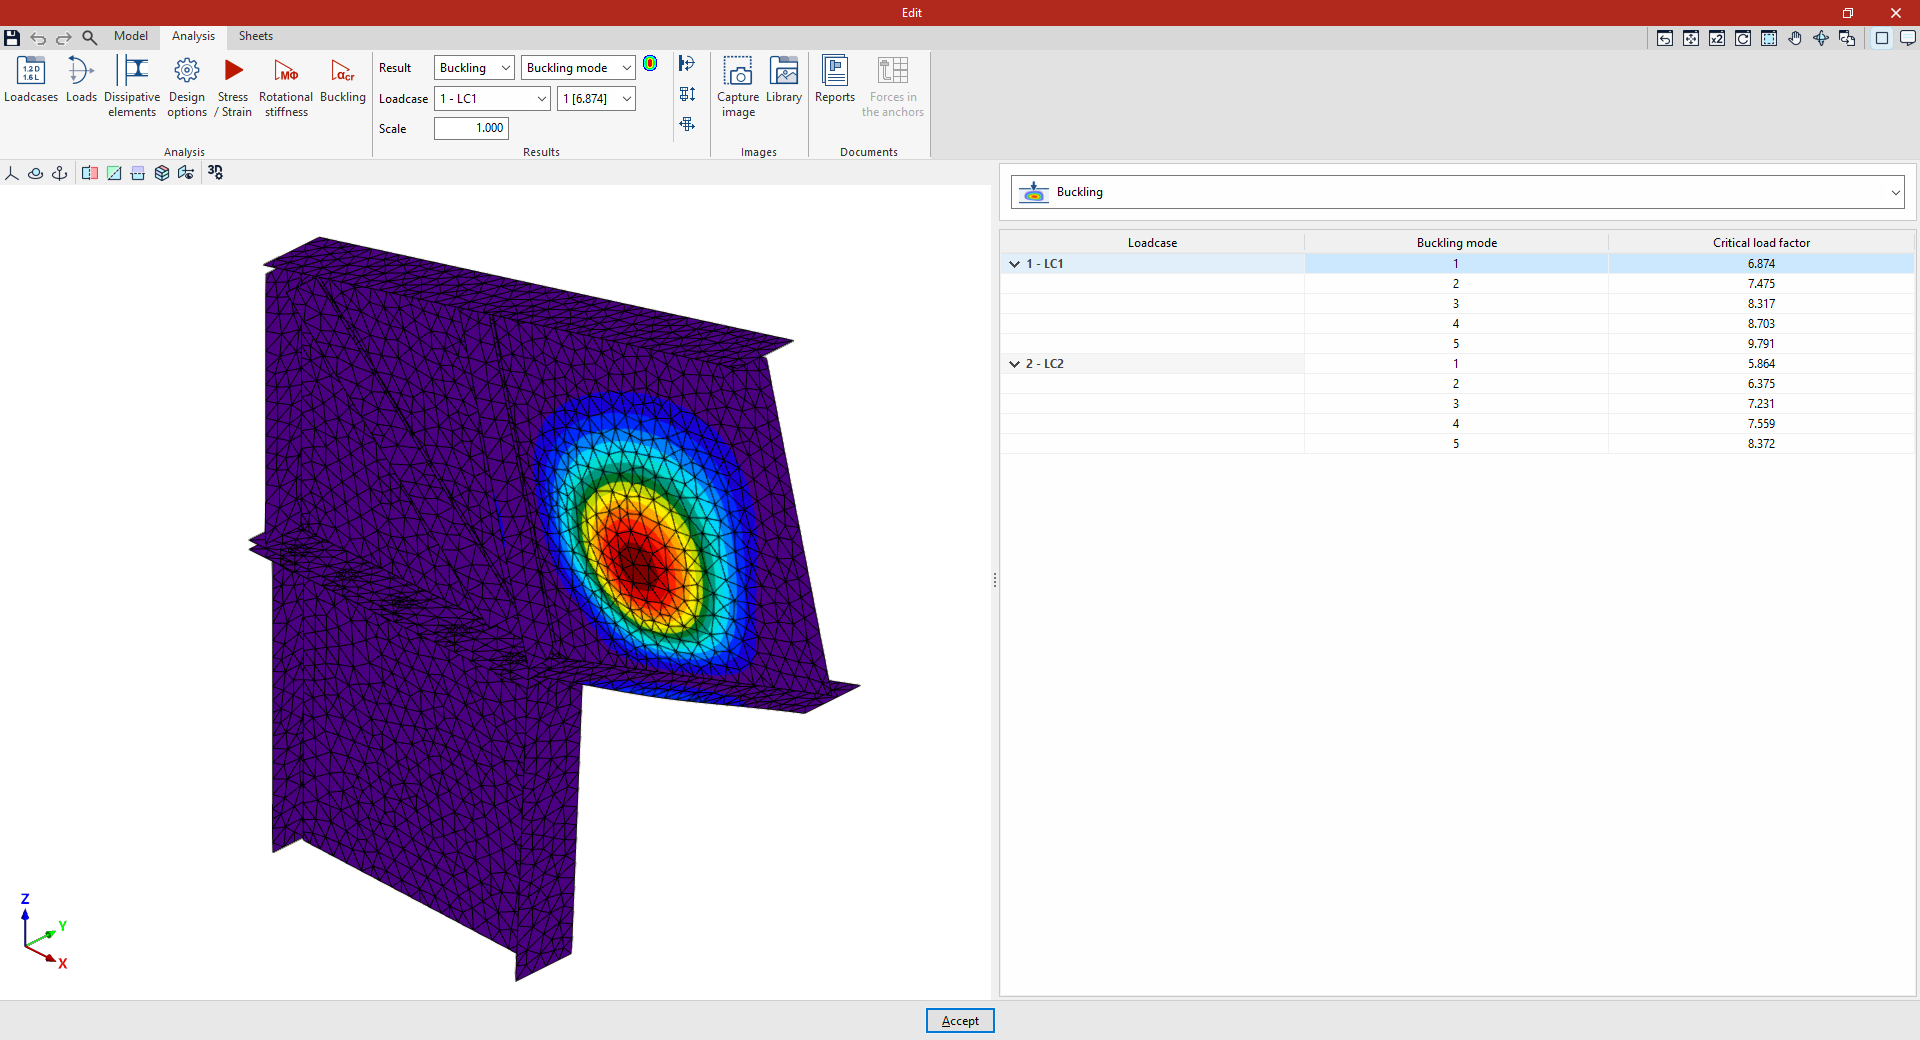
To the right of the "Result" drop-down menu, you can configure the "Display options" to adjust the result views by contour plots:
- The "Contour plot representation" can be "Discrete", if you want the program to use a finite colour scale, or "Continuous" if you want it to use a gradient.
- The "Show discretisation" option is also included, which allows you to show or hide the finite element mesh by toggling it on or off.
- In addition, "Limit values" can be specified for the display of results by adjusting both the "Minimum value" and the "Maximum value" of the scale.
Reports
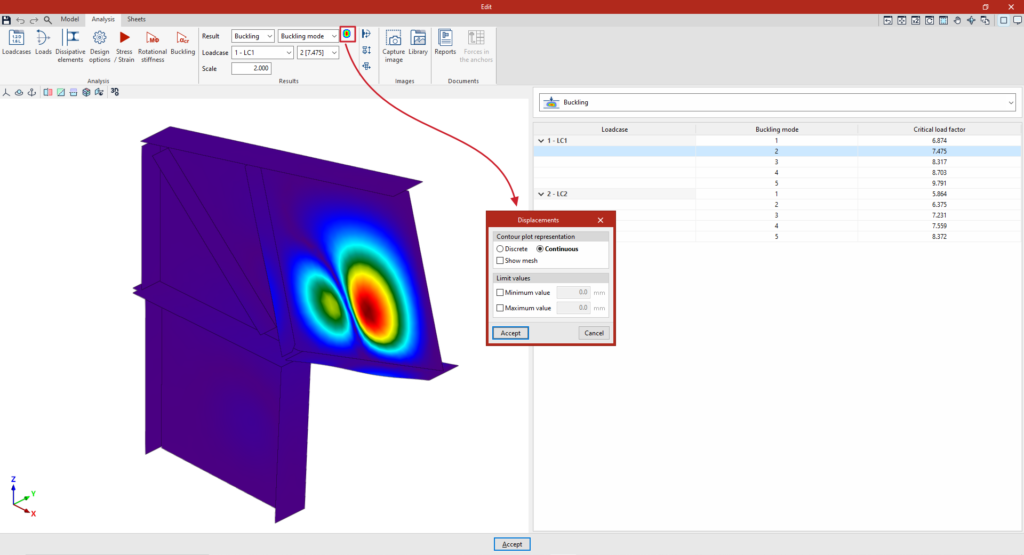
In the connection report, under the "Buckling" section, there is a table showing the number of buckling modes calculated for each loadcase, as well as the critical load factors associated with each of them.