Contour plot diagrams in two-way slabs
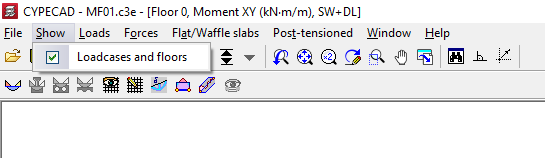
To view the contour plot diagrams for slabs and composite slabs in CYPECAD, first open the "Contour plots" tab after analysing the project and select the desired group. Then, select the "View" menu at the top of the interface and ensure that the "Loadcases and floors" option is enabled.
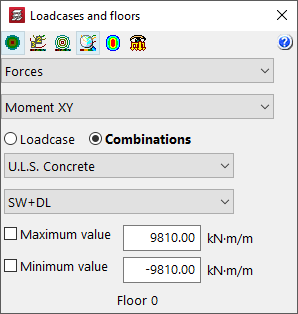
The program will open the "Loadcases and floors" dialogue box, where you can configure the options related to the display of contour plots.
In addition, the screen will display the contour plot diagram for the magnitude selected in the drop-down menus of the dialogue box. Each colour in the graph represents a different value. At the bottom of the screen, a scale shows the range of contour plots displayed, from the lowest to the highest value.
Options in the "Loadcases and floors" dialogue box
At the top of the "Loadcases and floors" dialogue box, you will find the following options:
- The options "View contour plots", "View contour lines with values" and "View contour lines without values" allow you to activate the display of information in the indicated formats.
- It is also possible to "Automatically adjust the scale when zooming" so that the colours, lines and values displayed on the screen are adjusted according to the visible area when using the zoom.
- Optionally, you can modify the "Colours for representing contour plots" and, if there are loads drawn on the model, activate the "View loads" option to display them on screen.
Next, select the contour plot diagram you wish to consult from the drop-down menus for one of the available "Loadcase" or "Combinations", as appropriate.
You can limit the "Maximum value" and "Minimum value" of the contour plot map by ticking the corresponding boxes at the bottom and entering the limit value. This will colour only those areas on the screen where the value is below or above the specified limits.
Checking displacements
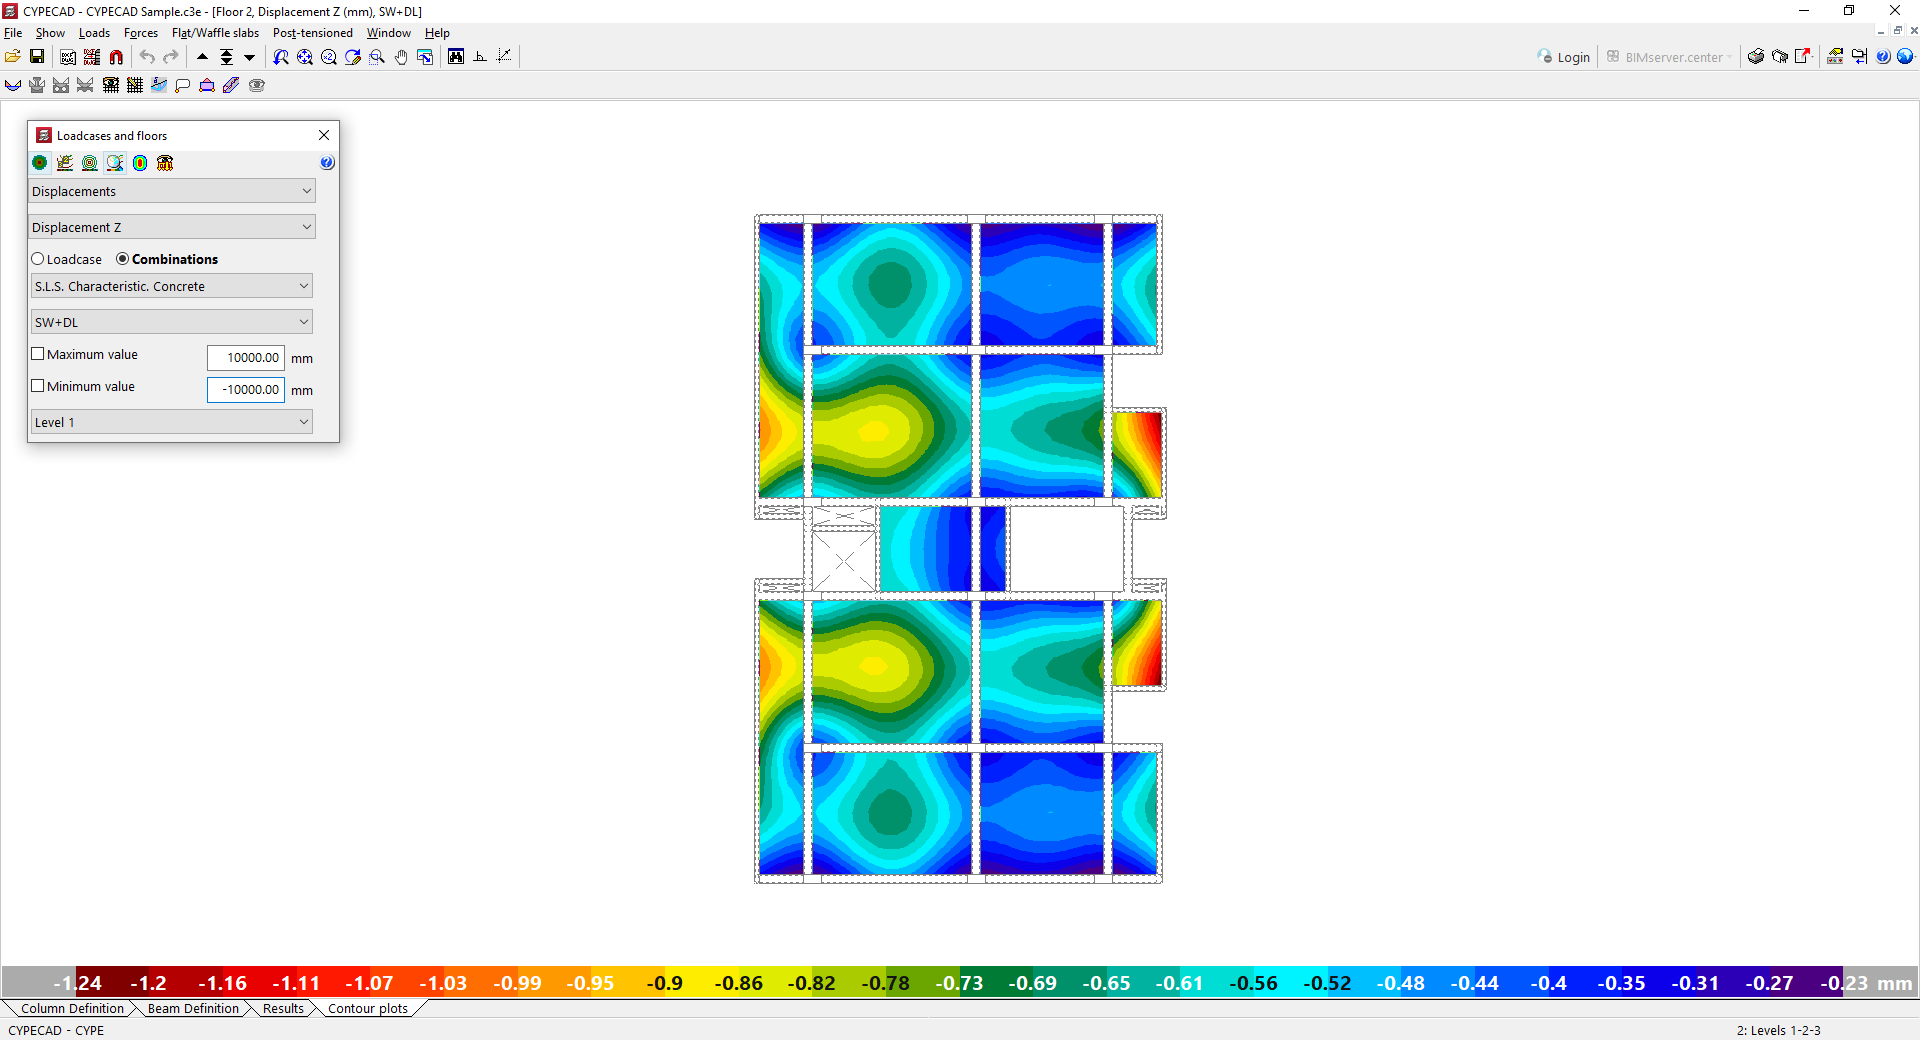
If "Displacements" is selected in the first drop-down menu, it is possible to view the displacement on the Z axis, the rotation on the X axis, and the rotation on the Y axis for the selected loadcase or combination.
- Z Displacement
- X Rotation
- Y Rotation
In the case of displacements, negative values represent a vertical decrease.
Checking forces
It is also possible to consult the "Efforts" resulting from the analysis for the selected loadcase or combination, including the following:
- Total shear
- X Shear
- Y Shear
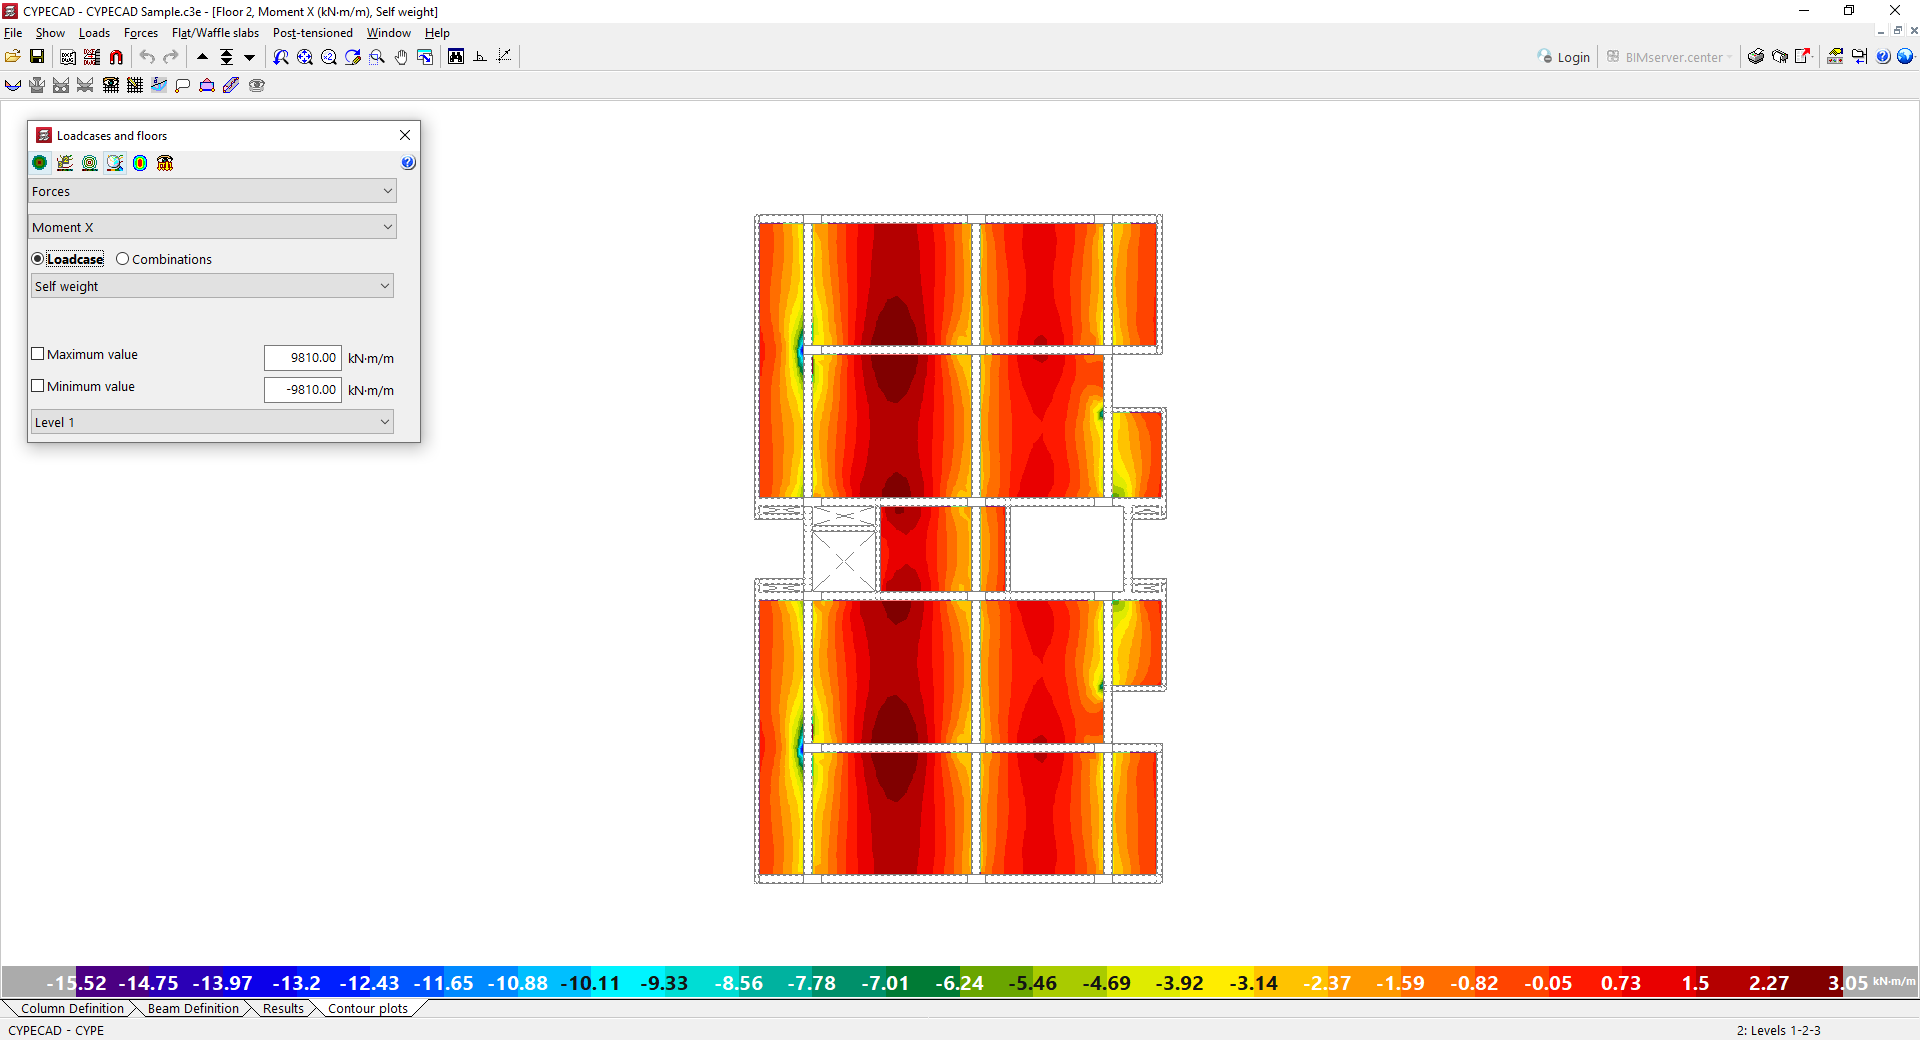
- X Moment (moment contained in the XZ plane)
- Y moment (moment contained in the YZ plane)
- XY moment (torsional moment of the elemental plate)
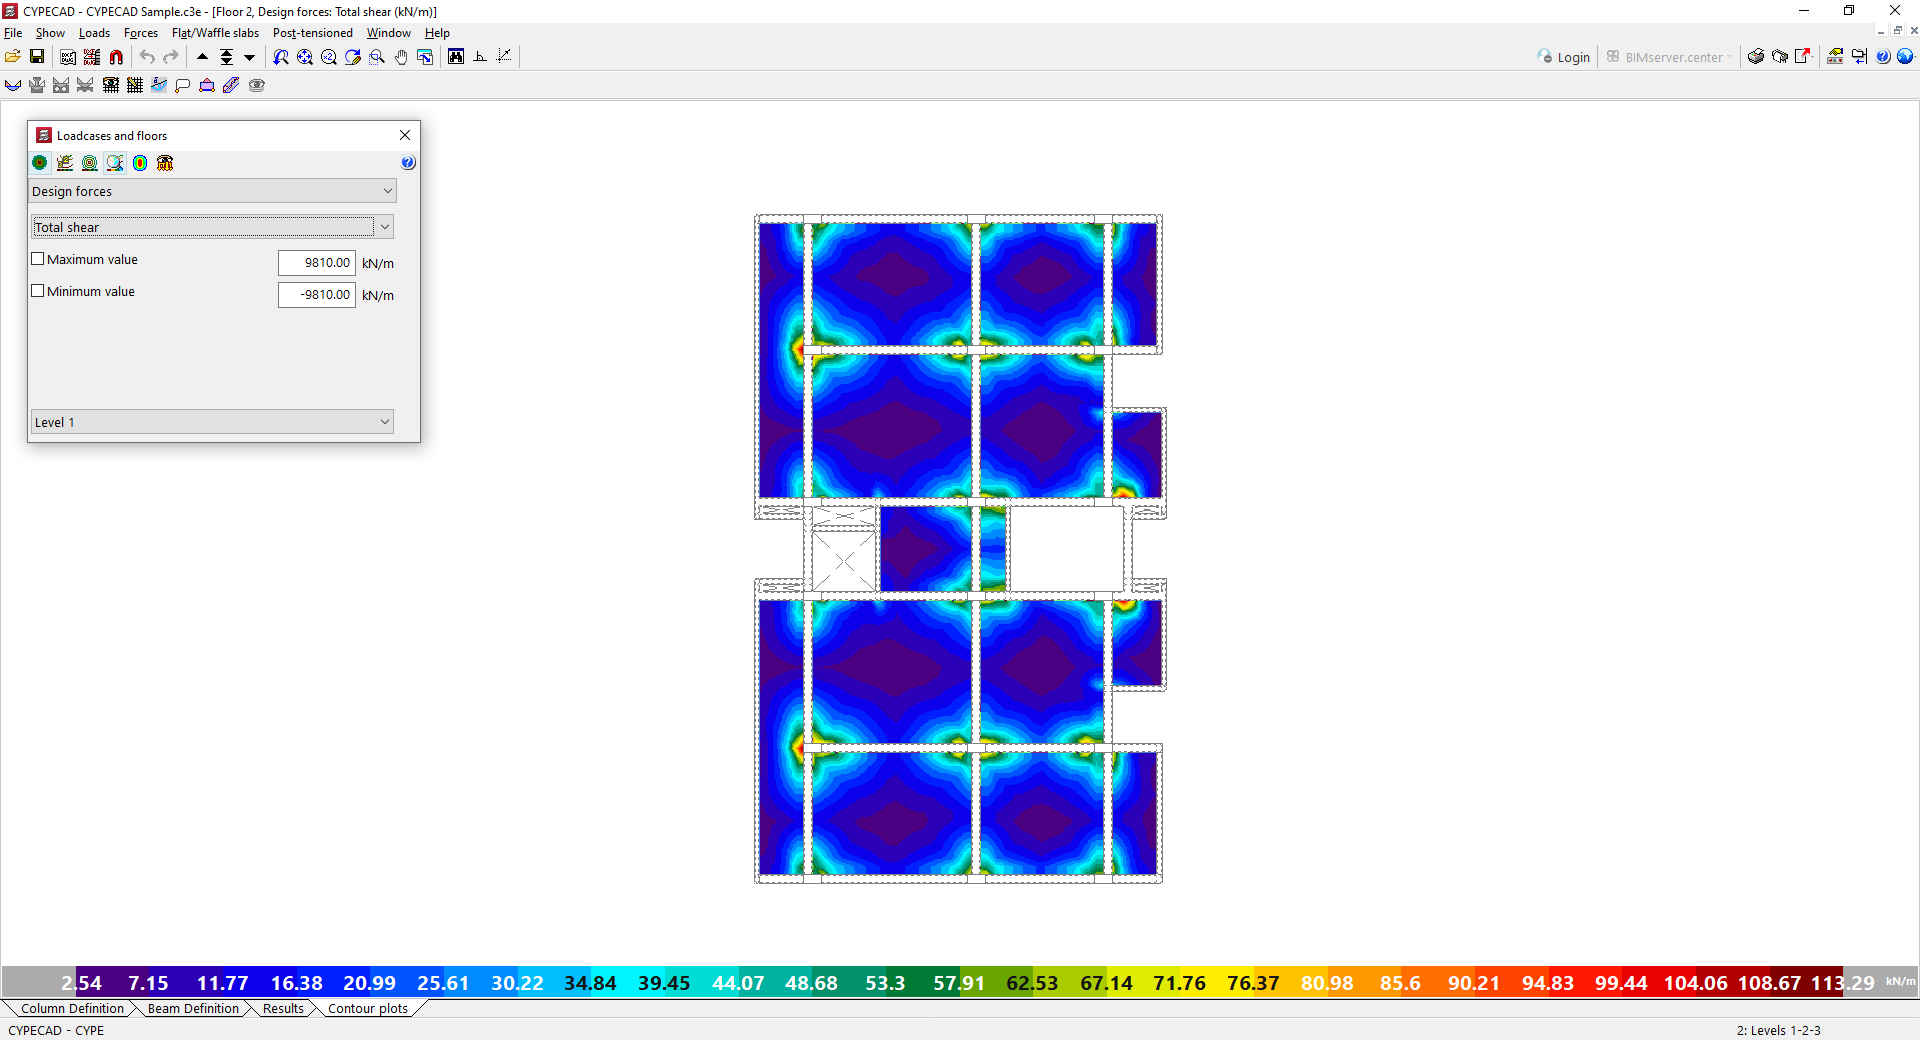
Checking design forces
The "Design forces" are derived from the above and represent the envelope of forces with which the reinforcement has been designed.
- Total shear
- X Shear
- Y Shear
- X moment, lower amount
- Y moment, lower amount
- X moment, higher amount
- Y moment, higher amount
In particular, the design moments for the upper and lower quantities are obtained from the analysis moments using the Wood and Armer method.
| Note: |
|---|
| The Wood and Armer method is used to obtain, from the analysis moments Mx, My and Mxy (which can be consulted in the "Forces" section of the "Contour plots" tab), the design moments in each direction and each face, Mx* and My* (corresponding to moments X and Y, upper and lower amounts in the "Design forces" section). Thus, in the case of the lower reinforcement, considering that Mx and My are positive bending moments, which pull on the lower face of the slab, the reinforcement is calculated as follows: Design moment X, Mx*=Mx + |Mxy| Design moment Y, My*=My + |Mxy| If Mx and My were of opposite sign, and Mx* and My* were also of opposite sign, the negative value is set to zero, and the positive value is used in that direction: For Mx*<0, My*>0, Mx*=0 My*=My + | (Mxy2/Mx)| For Mx*>0, My*<0, My*=0 Mx*=Mx + | (Mxy2/My)| If Mx* and My* are negative, no lower positive flexural reinforcement is required. On the other hand, in the case of upper reinforcement, considering that Mx and My are negative bending moments, which pull on the upper face of the slab, the reinforcement is calculated as follows: Design moment X, Mx*=Mx - |Mxy| Design moment Y, My*=My - |Mxy| If Mx and My were of opposite sign, and Mx* and My* also have opposite signs, the positive value is set to zero and the negative value is used in that direction: For Mx*<0, My*>0, My*=0 Mx*=Mx - |(Mxy2/My)| For Mx*>0, My*<0, Mx*=0 My*=My - |(Mxy2/Mx)| If Mx* and My* are positive, no additional negative bending reinforcement is required. |
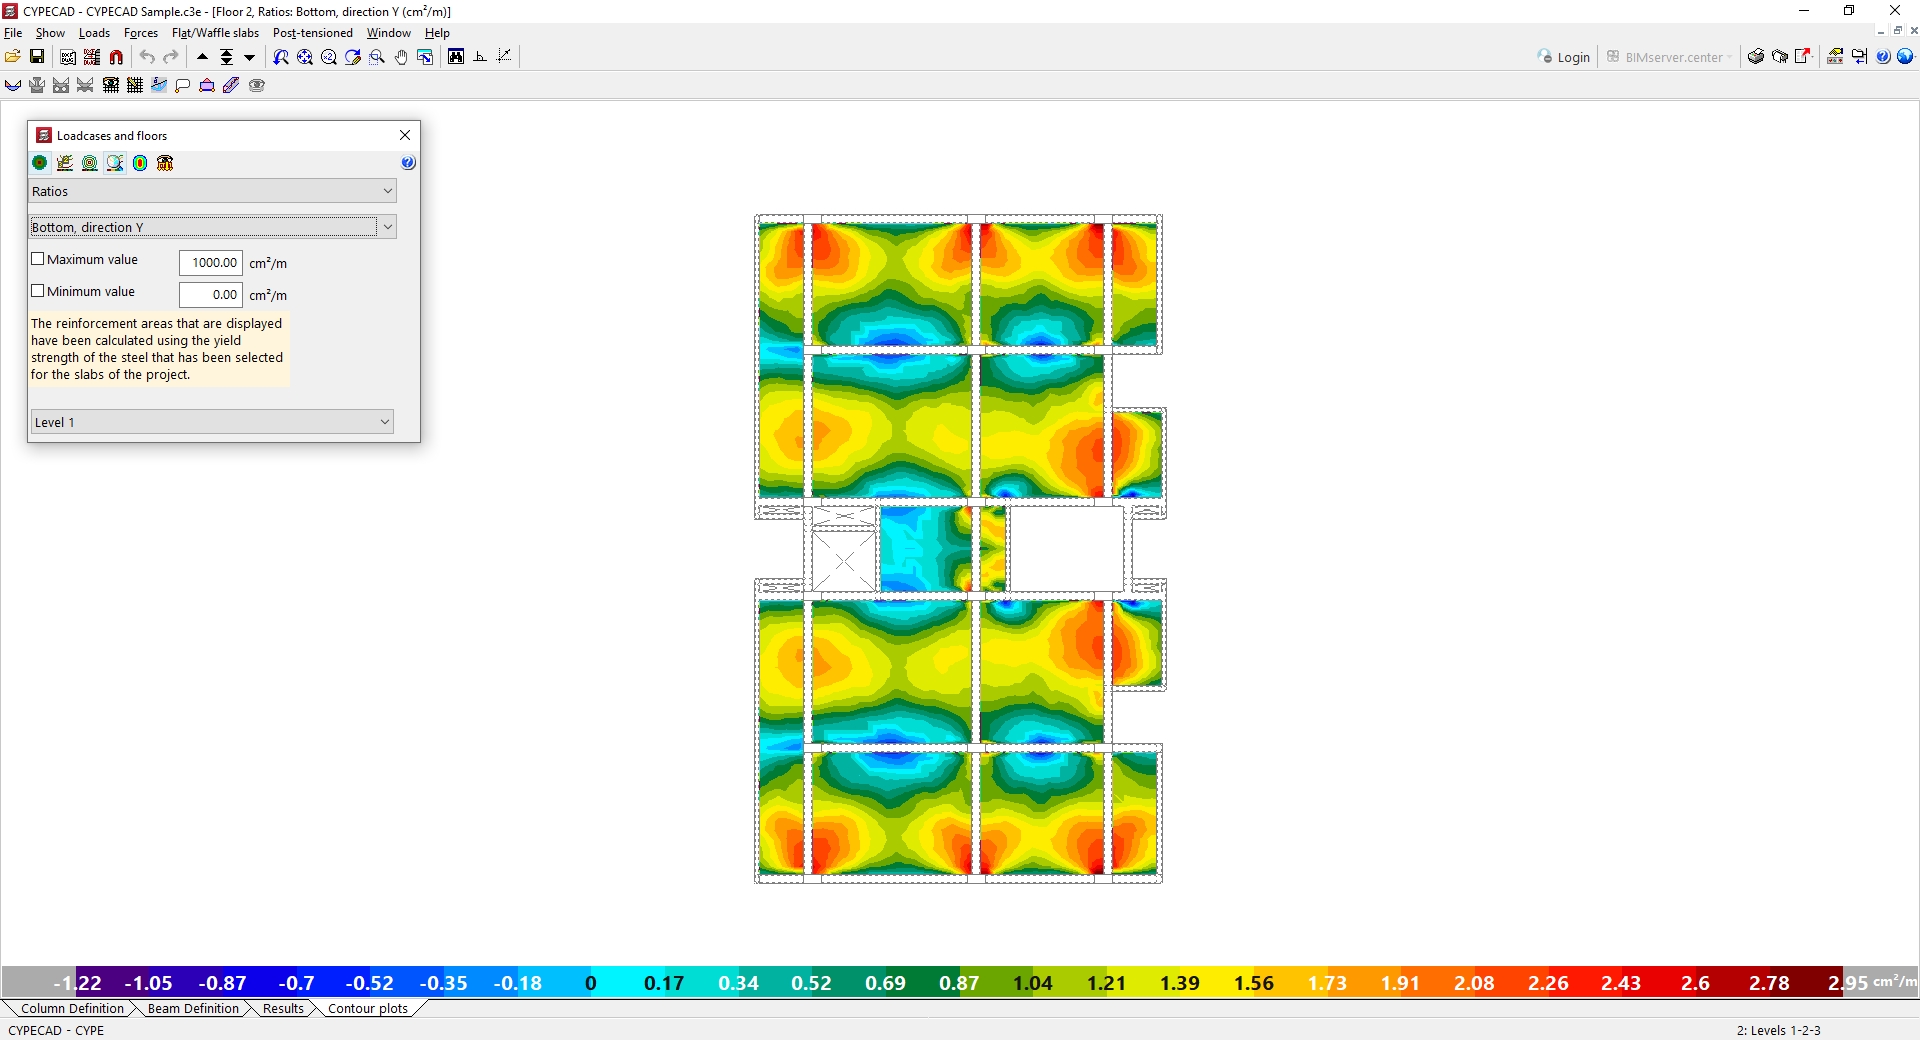
Checking reinforcement quantities
The lower and upper "Quantities" in the X-direction and Y-direction of the slab represent the steel section required by analysis.
- Lower, X direction
- Lower, Y direction
- Upper, X direction
- Upper, Y direction
During the design process, the program approximates these quantities with the reinforcement available in the reinforcement tables.
Checking the field stress
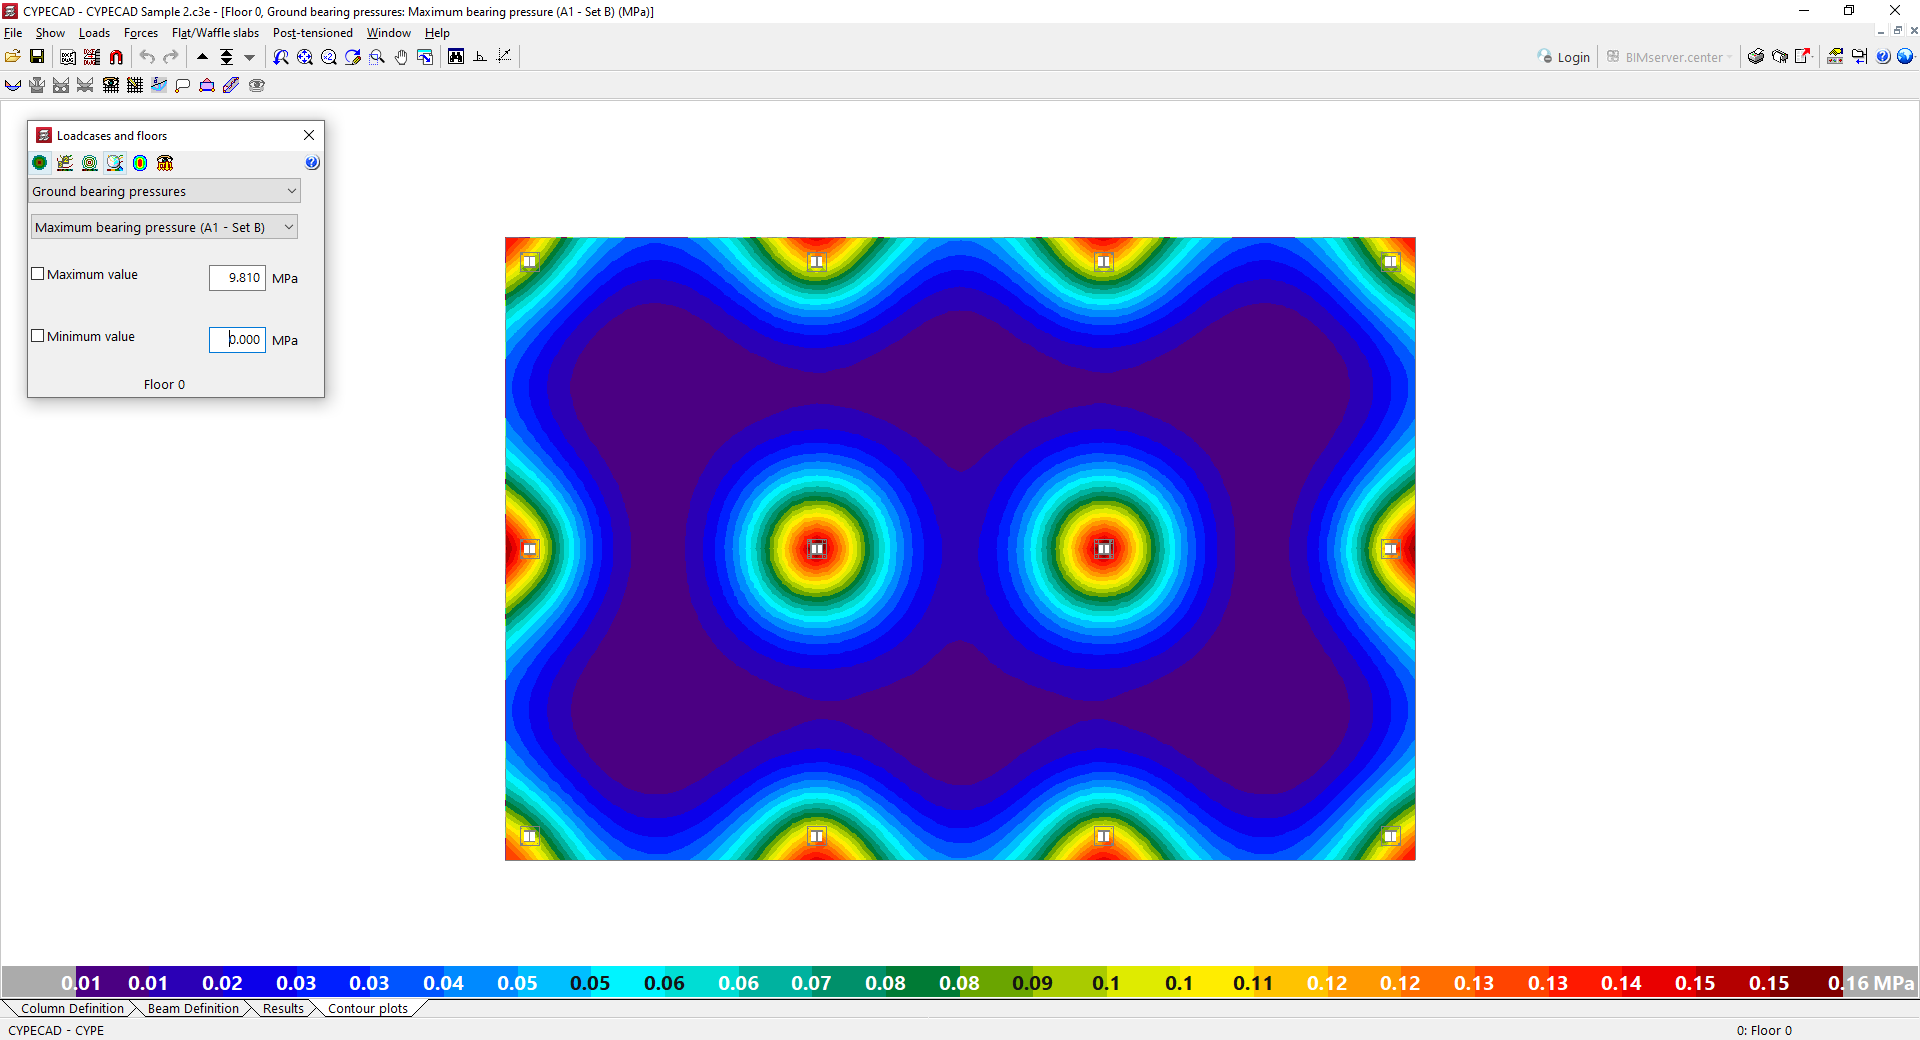
In the case of foundation slabs, the "Ground bearing pressures" can be visualised, including the following:
- Maximum voltage
- Take-off (if applicable)
- Voltage "By loadcase" or selected combination