Displaying results on screen
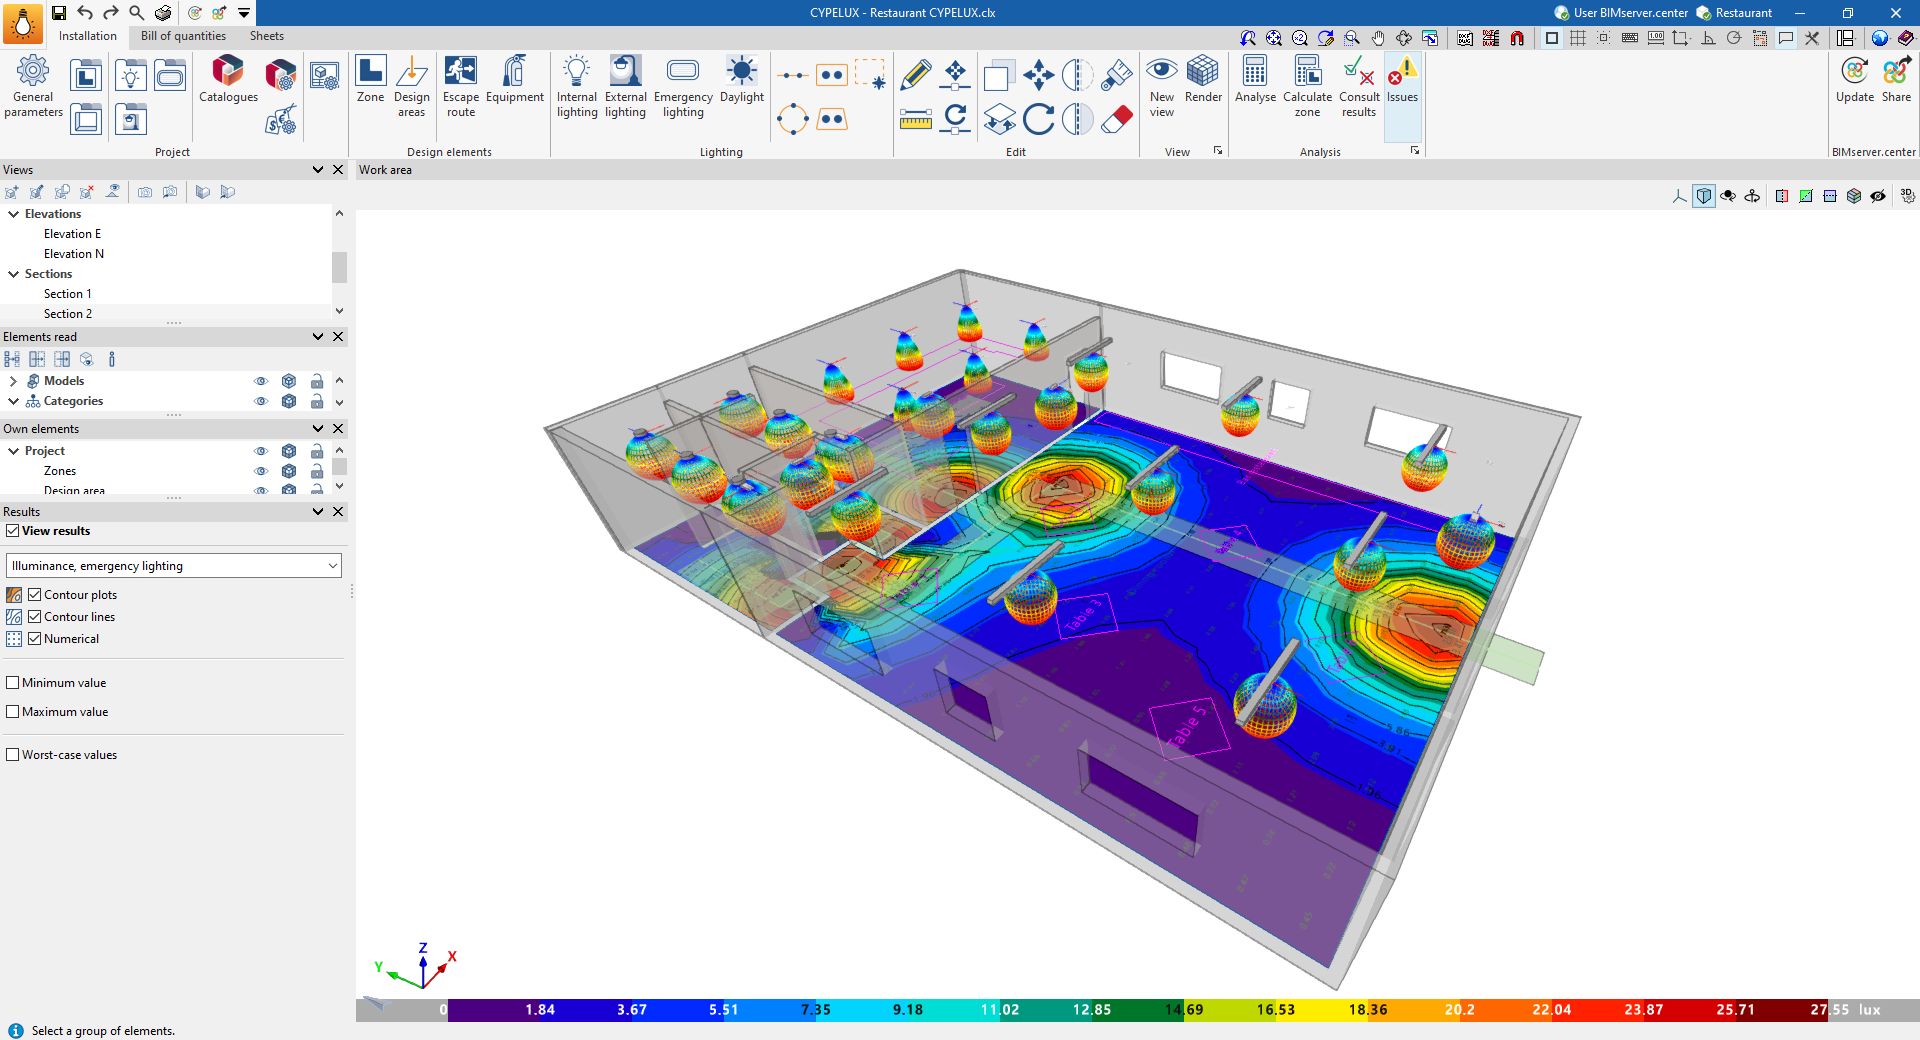
Once the calculation has been performed, the program can display the illuminance (normal and emergency) and glare results for the relevant areas on screen, either using isoline or isovalue graphs, or by showing the numerical values at each point on the floor plan.
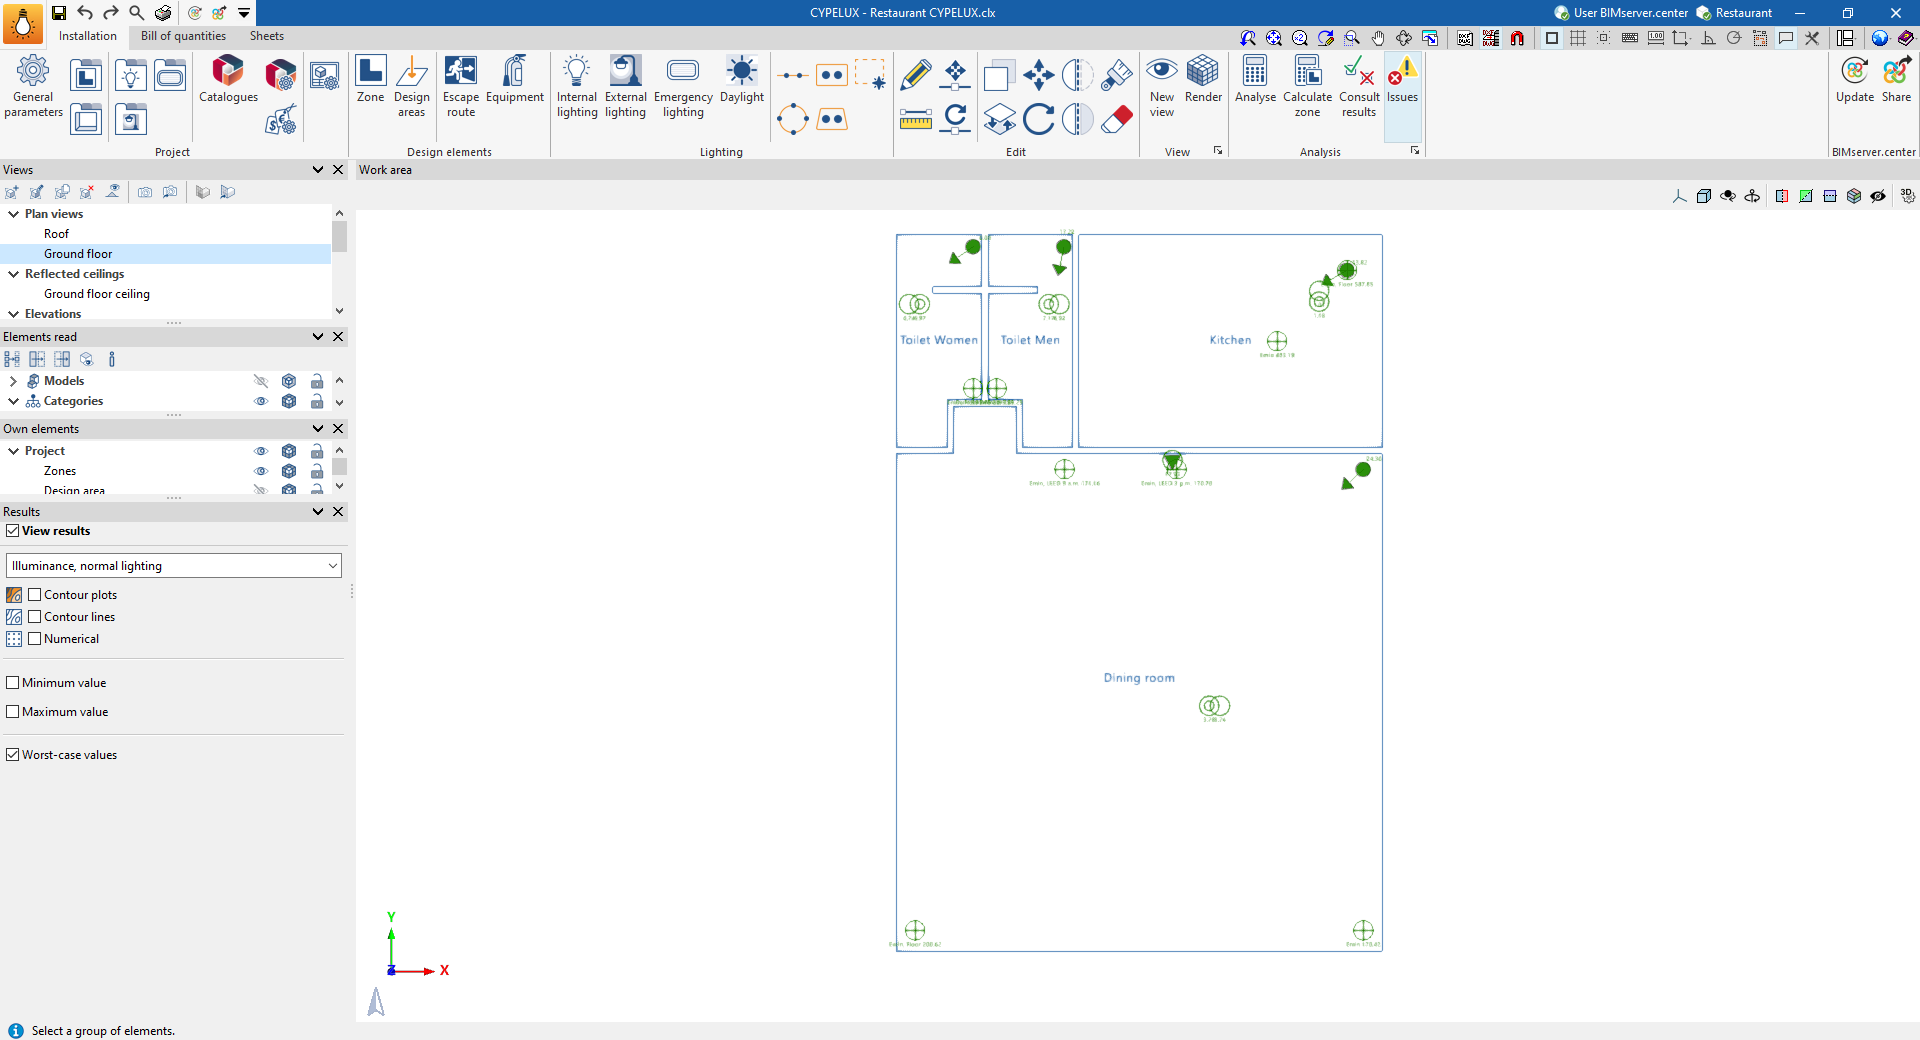
To do this, tick the "View results" box in the "Results" panel, located at the bottom of the left-hand side.
In the first drop-down menu in this section, select the results you wish to view:
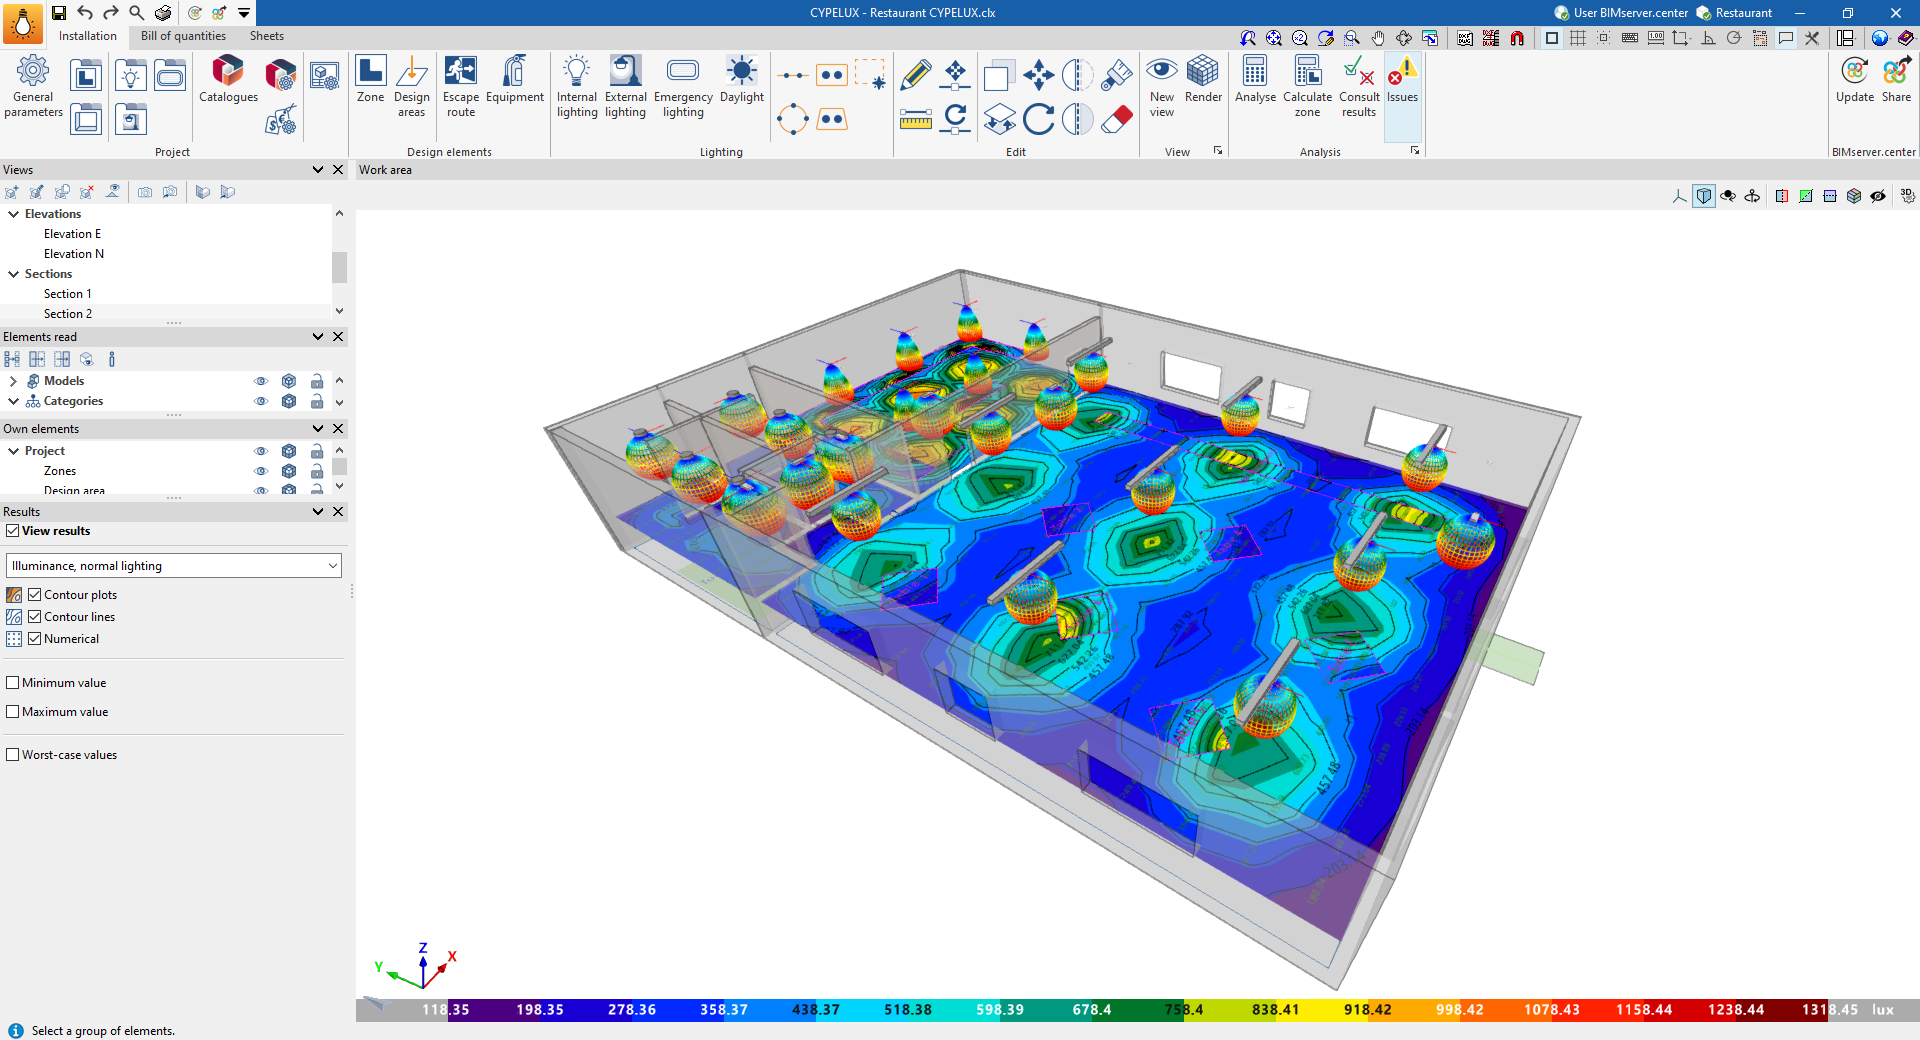
- Illuminance levels, normal lighting
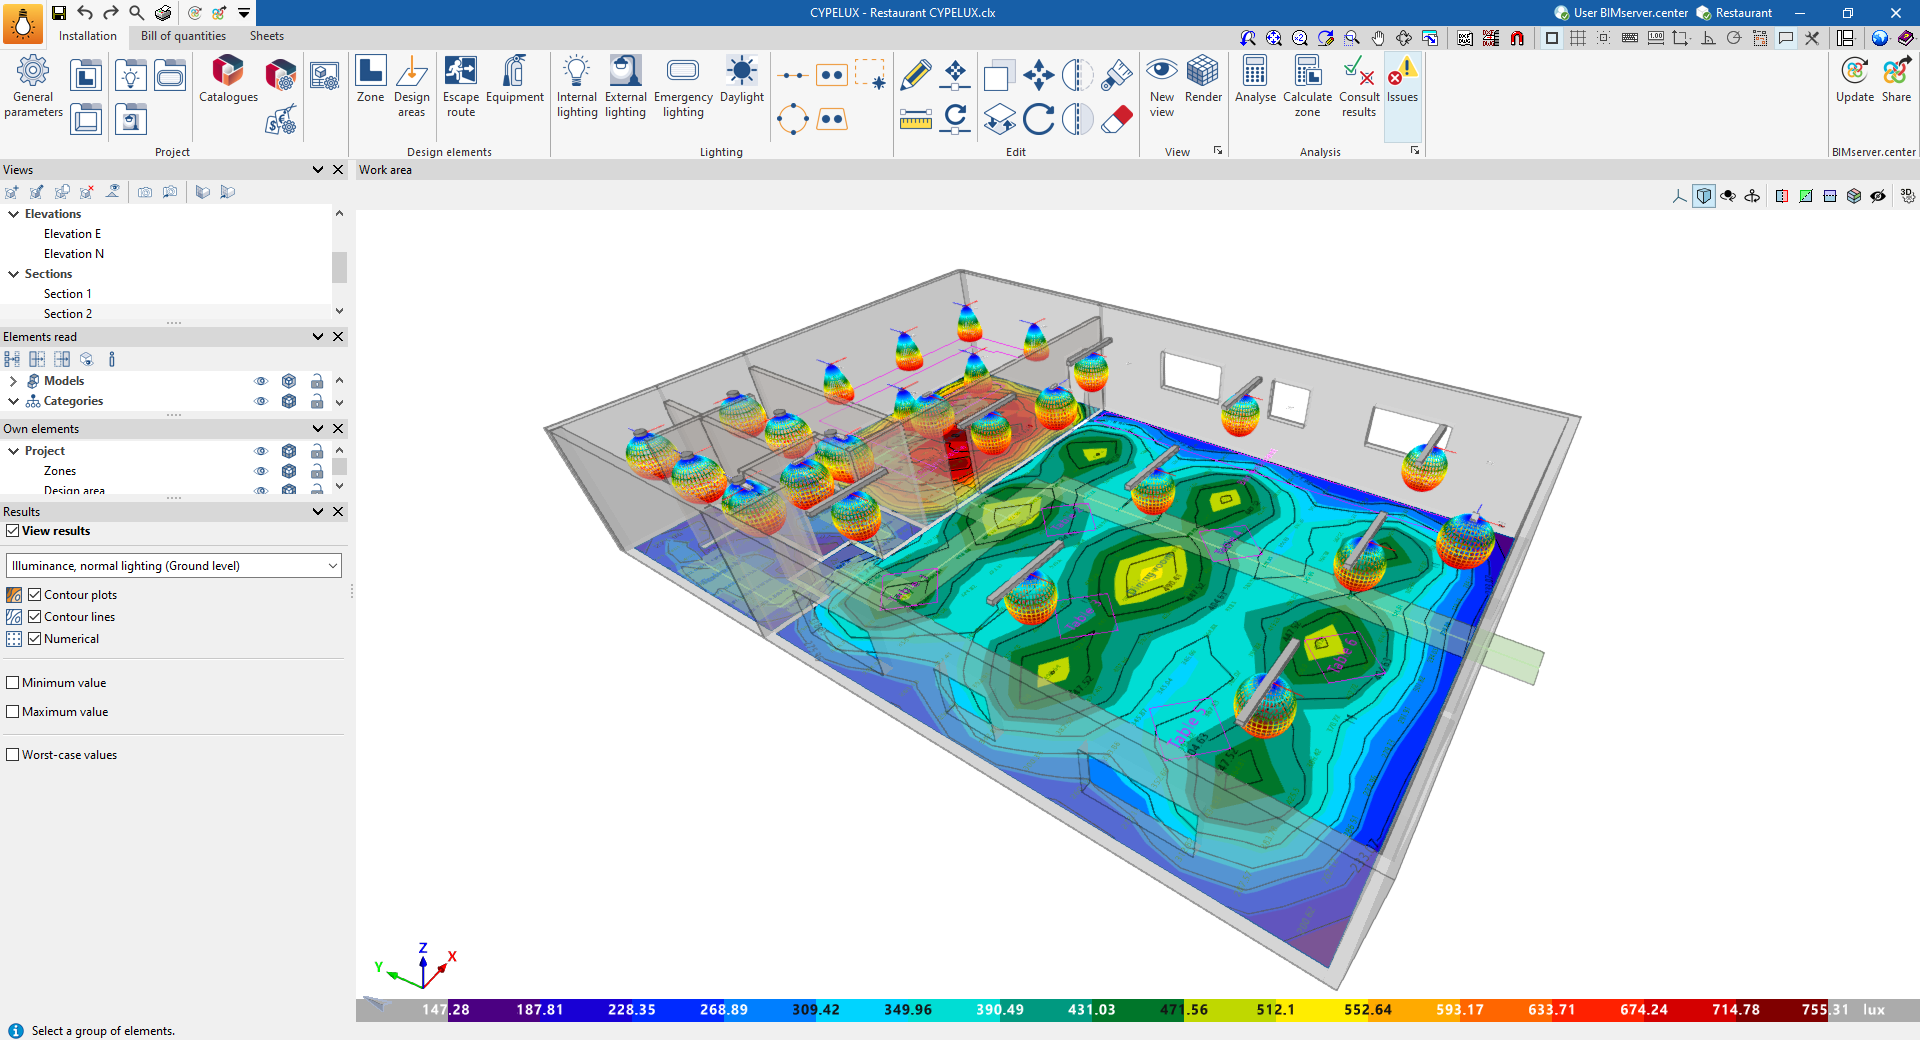
- Illuminance levels, normal lighting (at floor level)
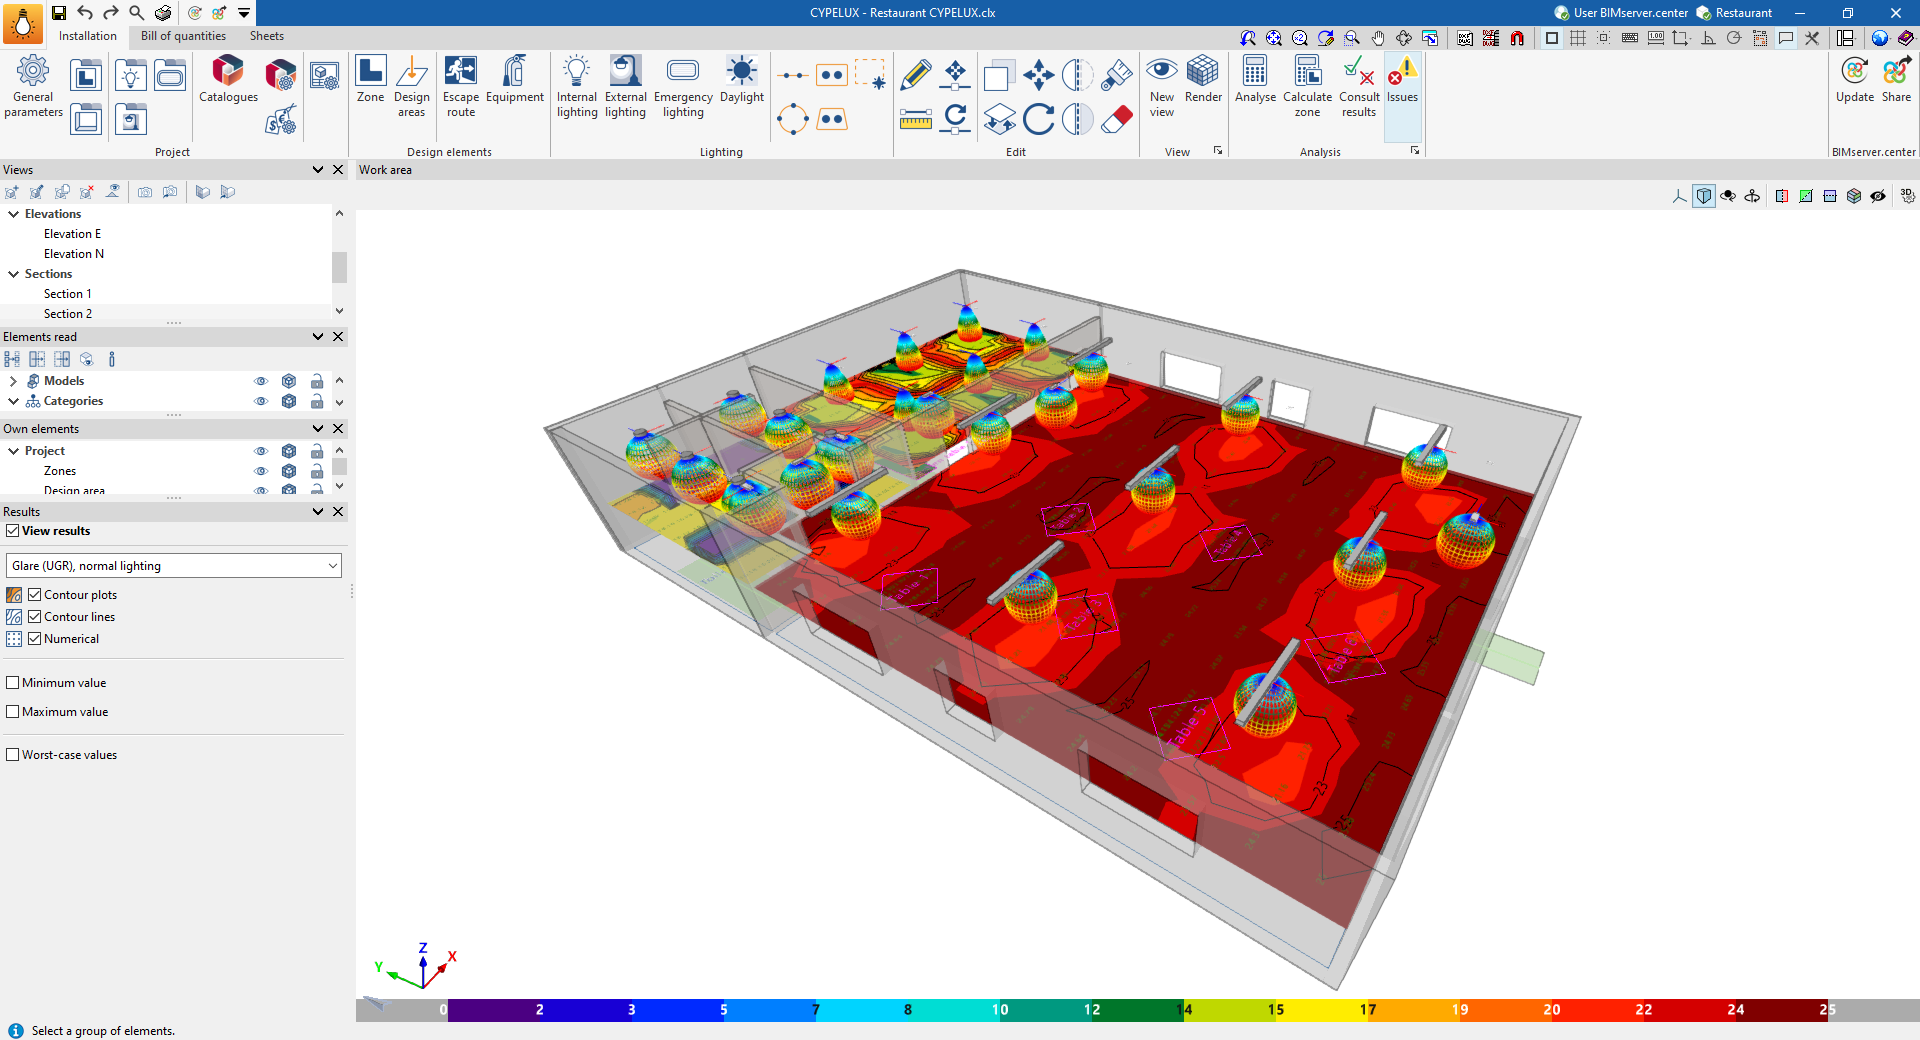
- Glare (UGR), normal lighting
- Illuminance levels, normal lighting (if emergency luminaires have been installed)
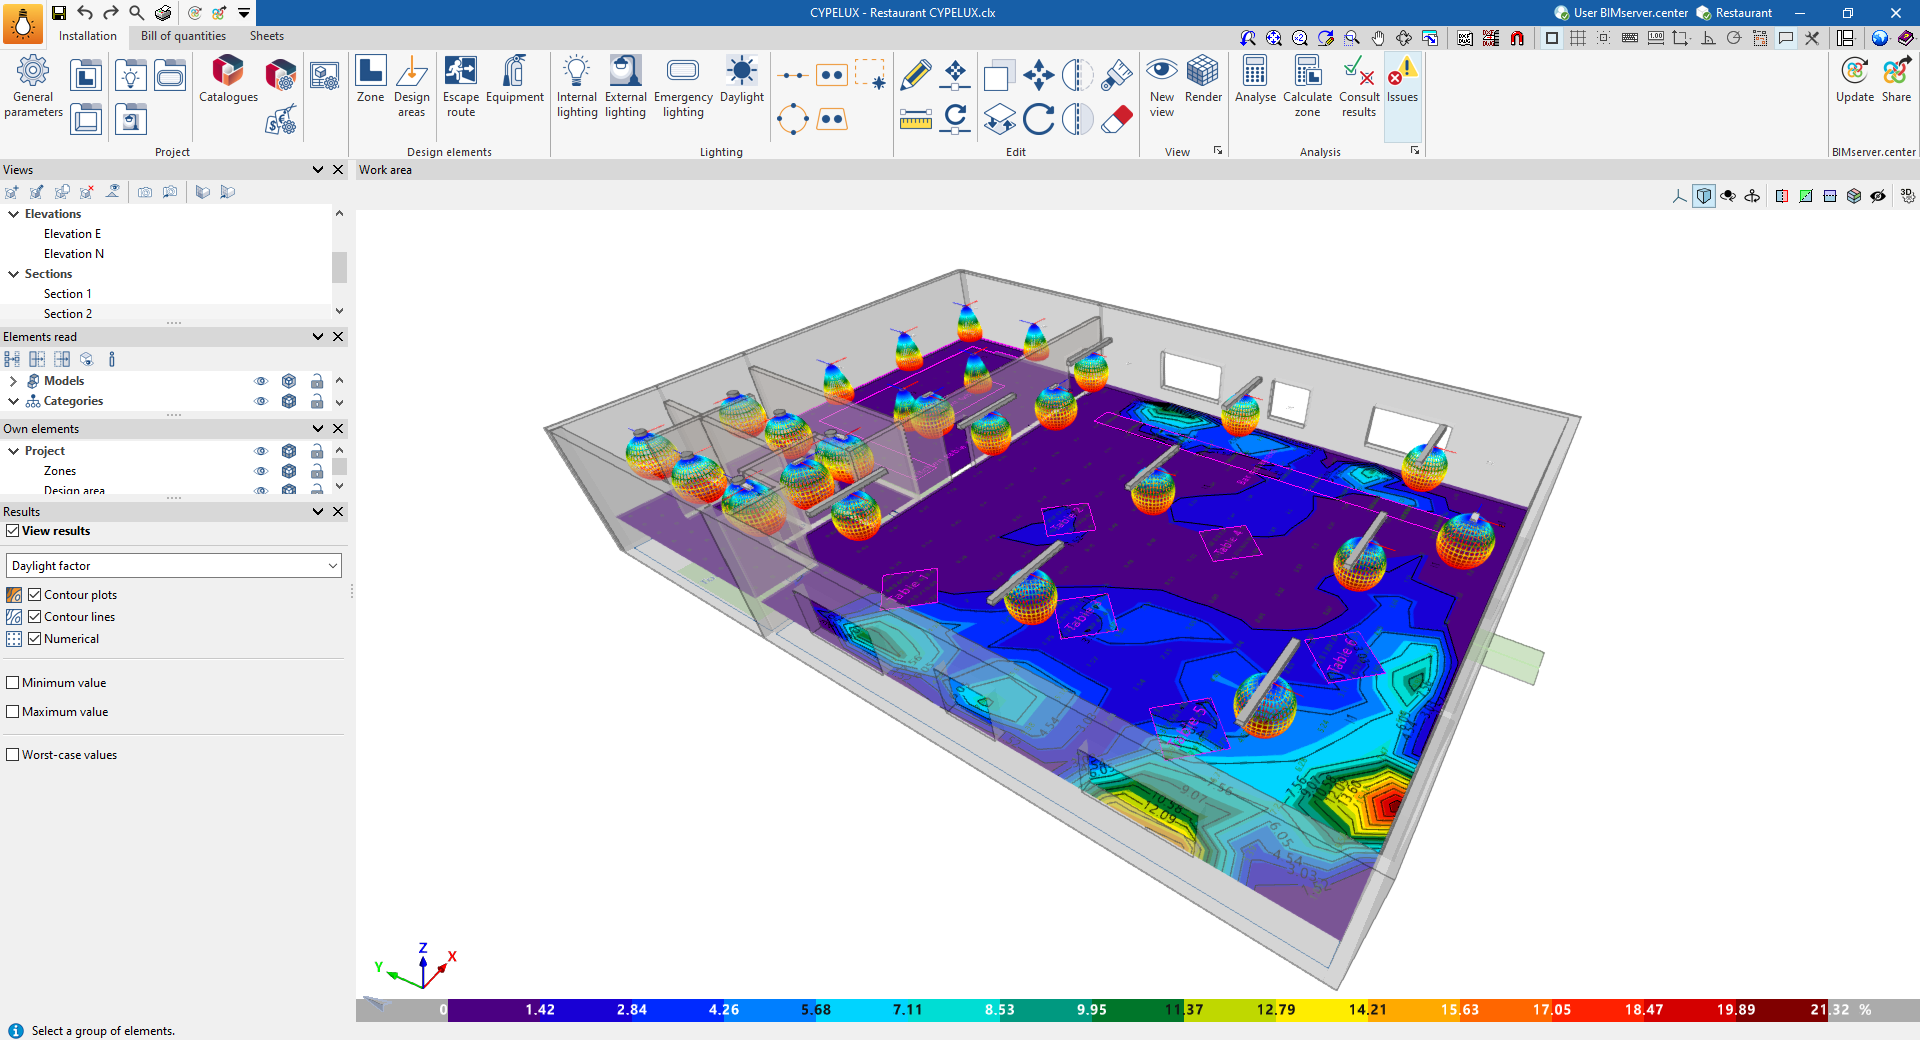
- Daylight factor (if the relevant calculation has been enabled using the "Daylight" option)
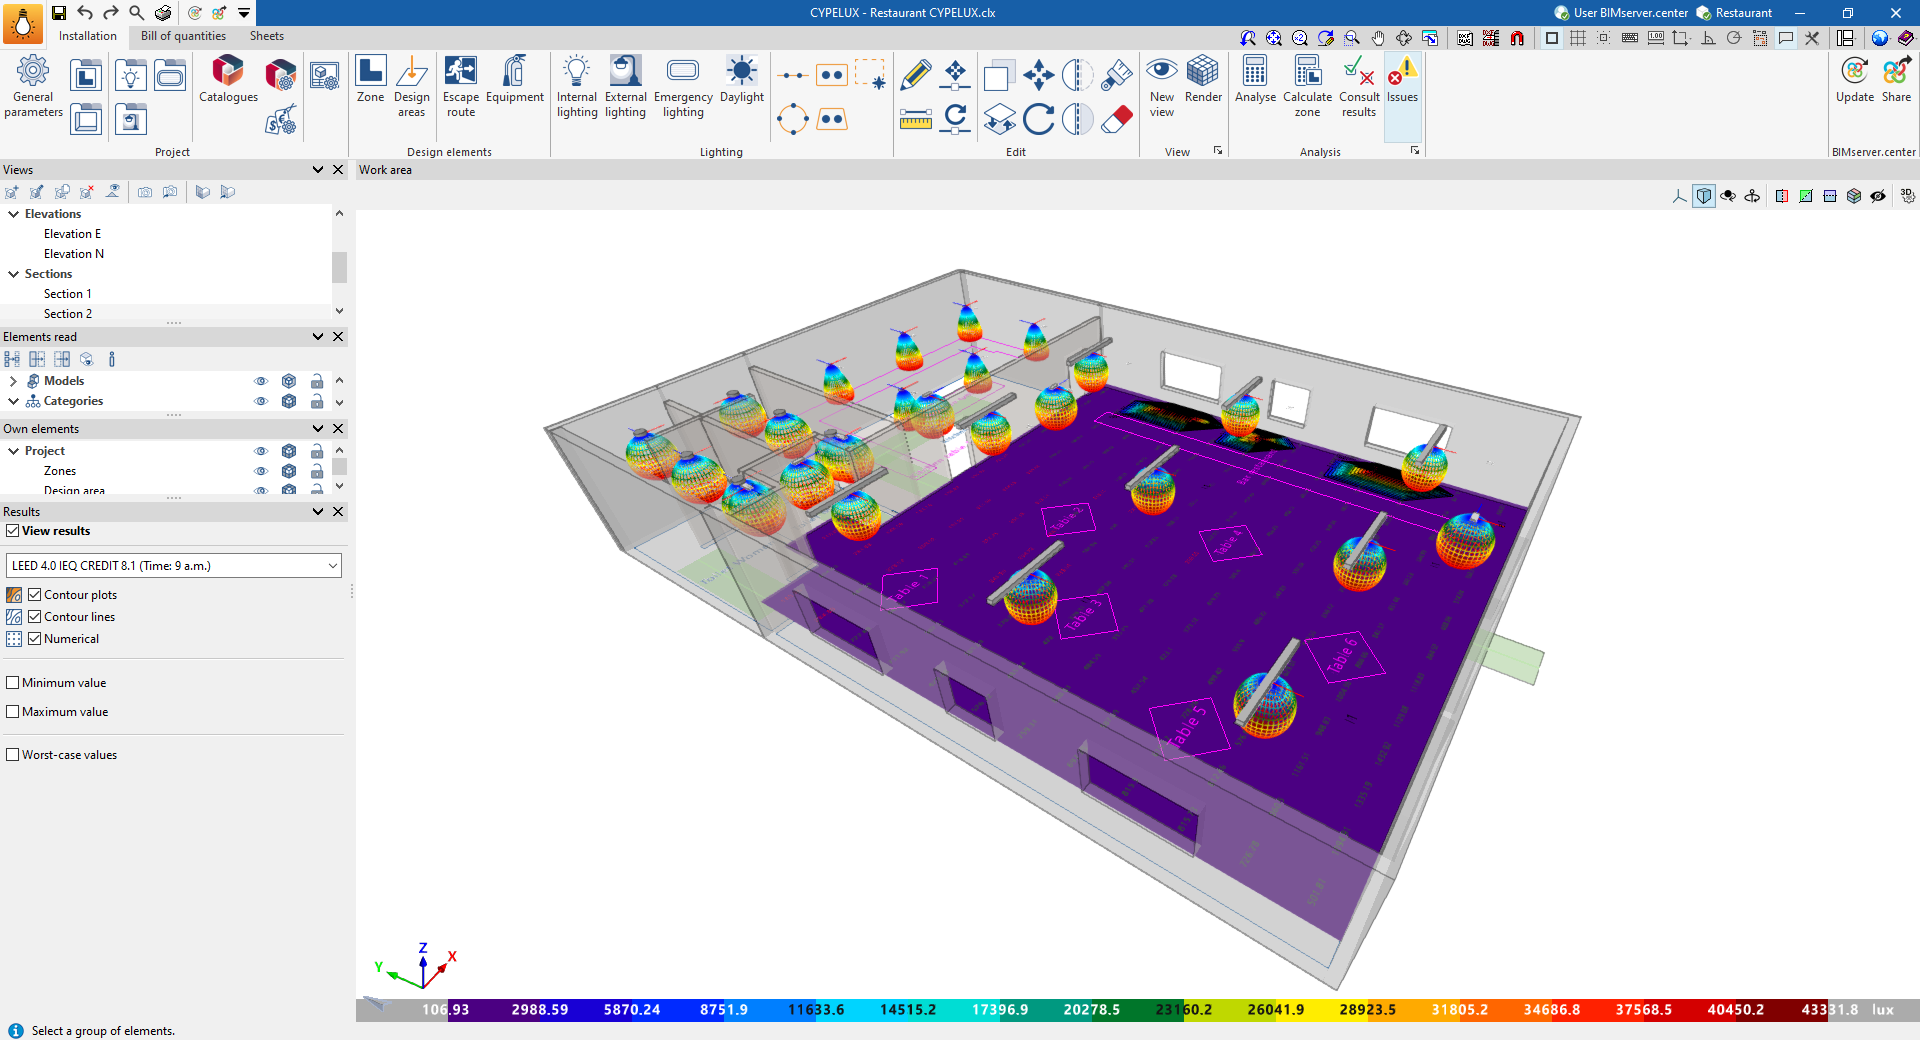
- LEED 4.0 CAI CREDIT 8.1 (Times: 9 am–3 pm) (provided the relevant check has been enabled in the zones)
You can then select one or more of the following display modes. Multiple options can be selected and overlaid simultaneously, allowing for a more detailed representation of the results.
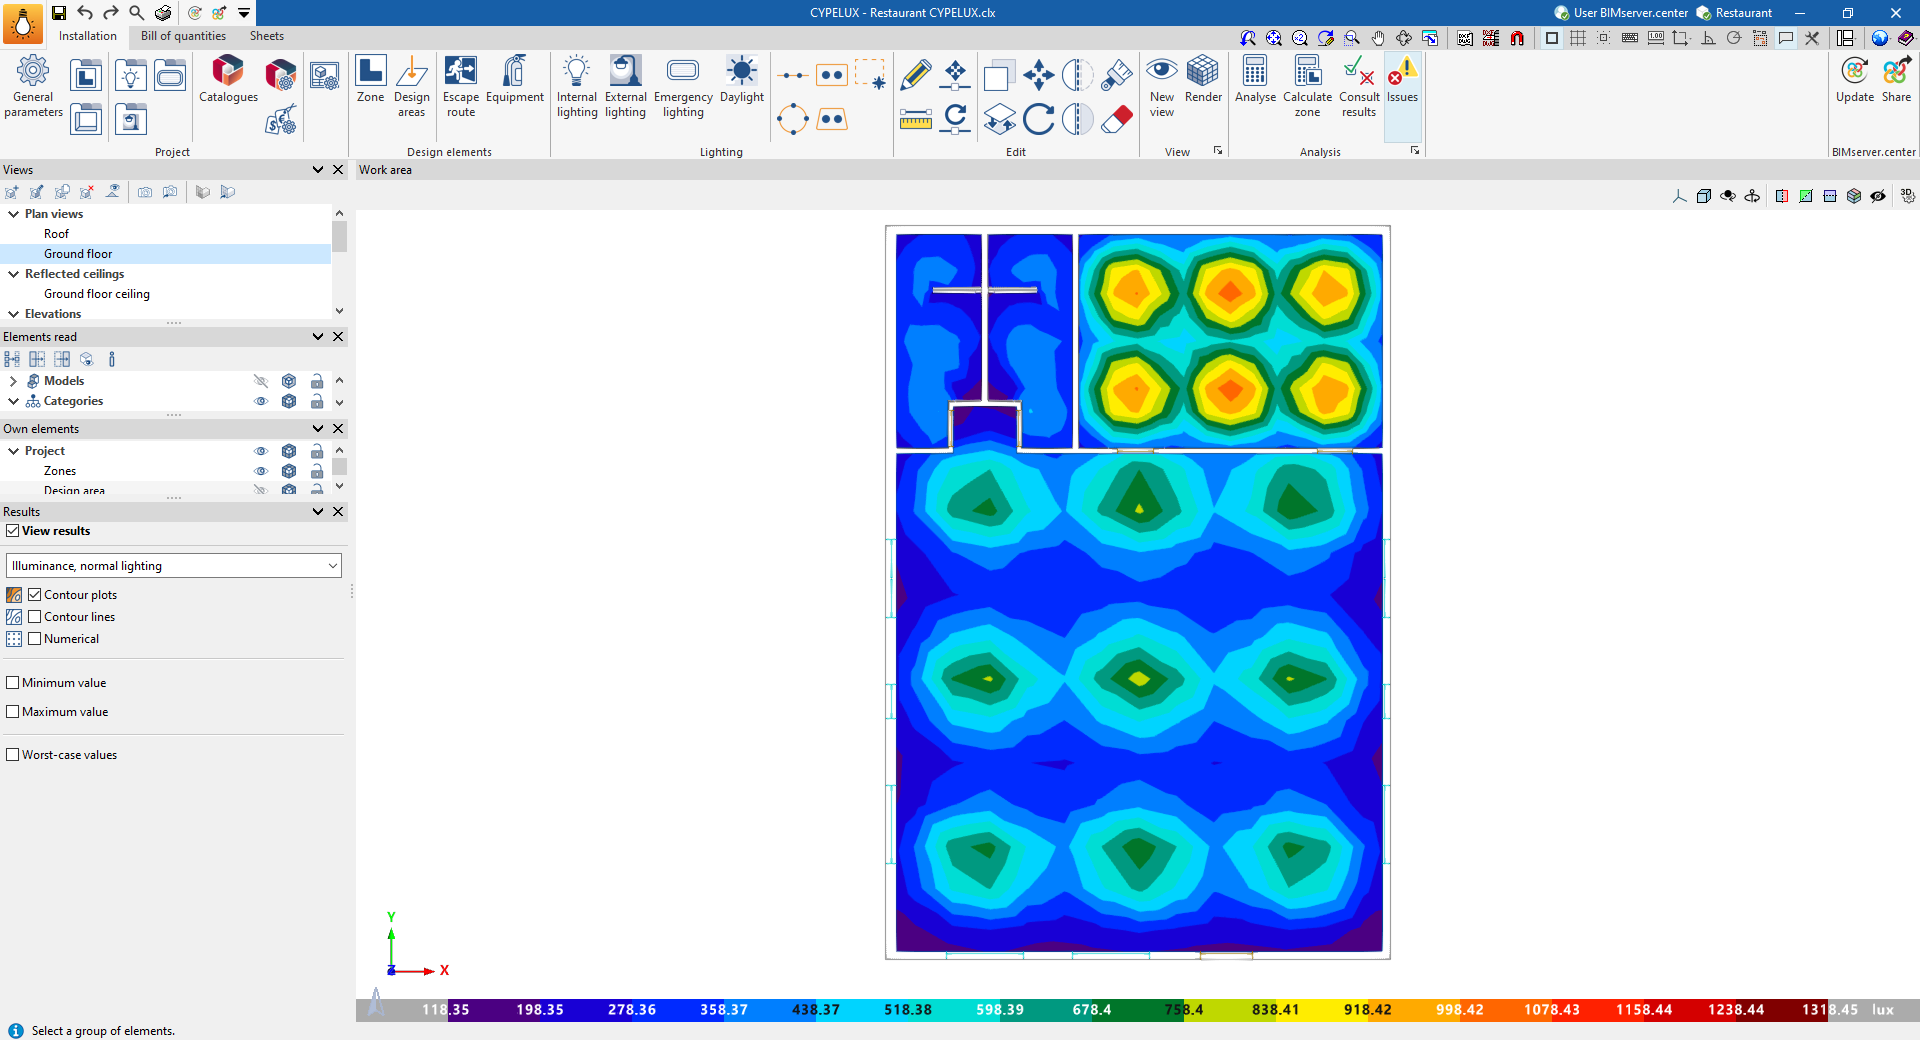
- Contour plots (optional)
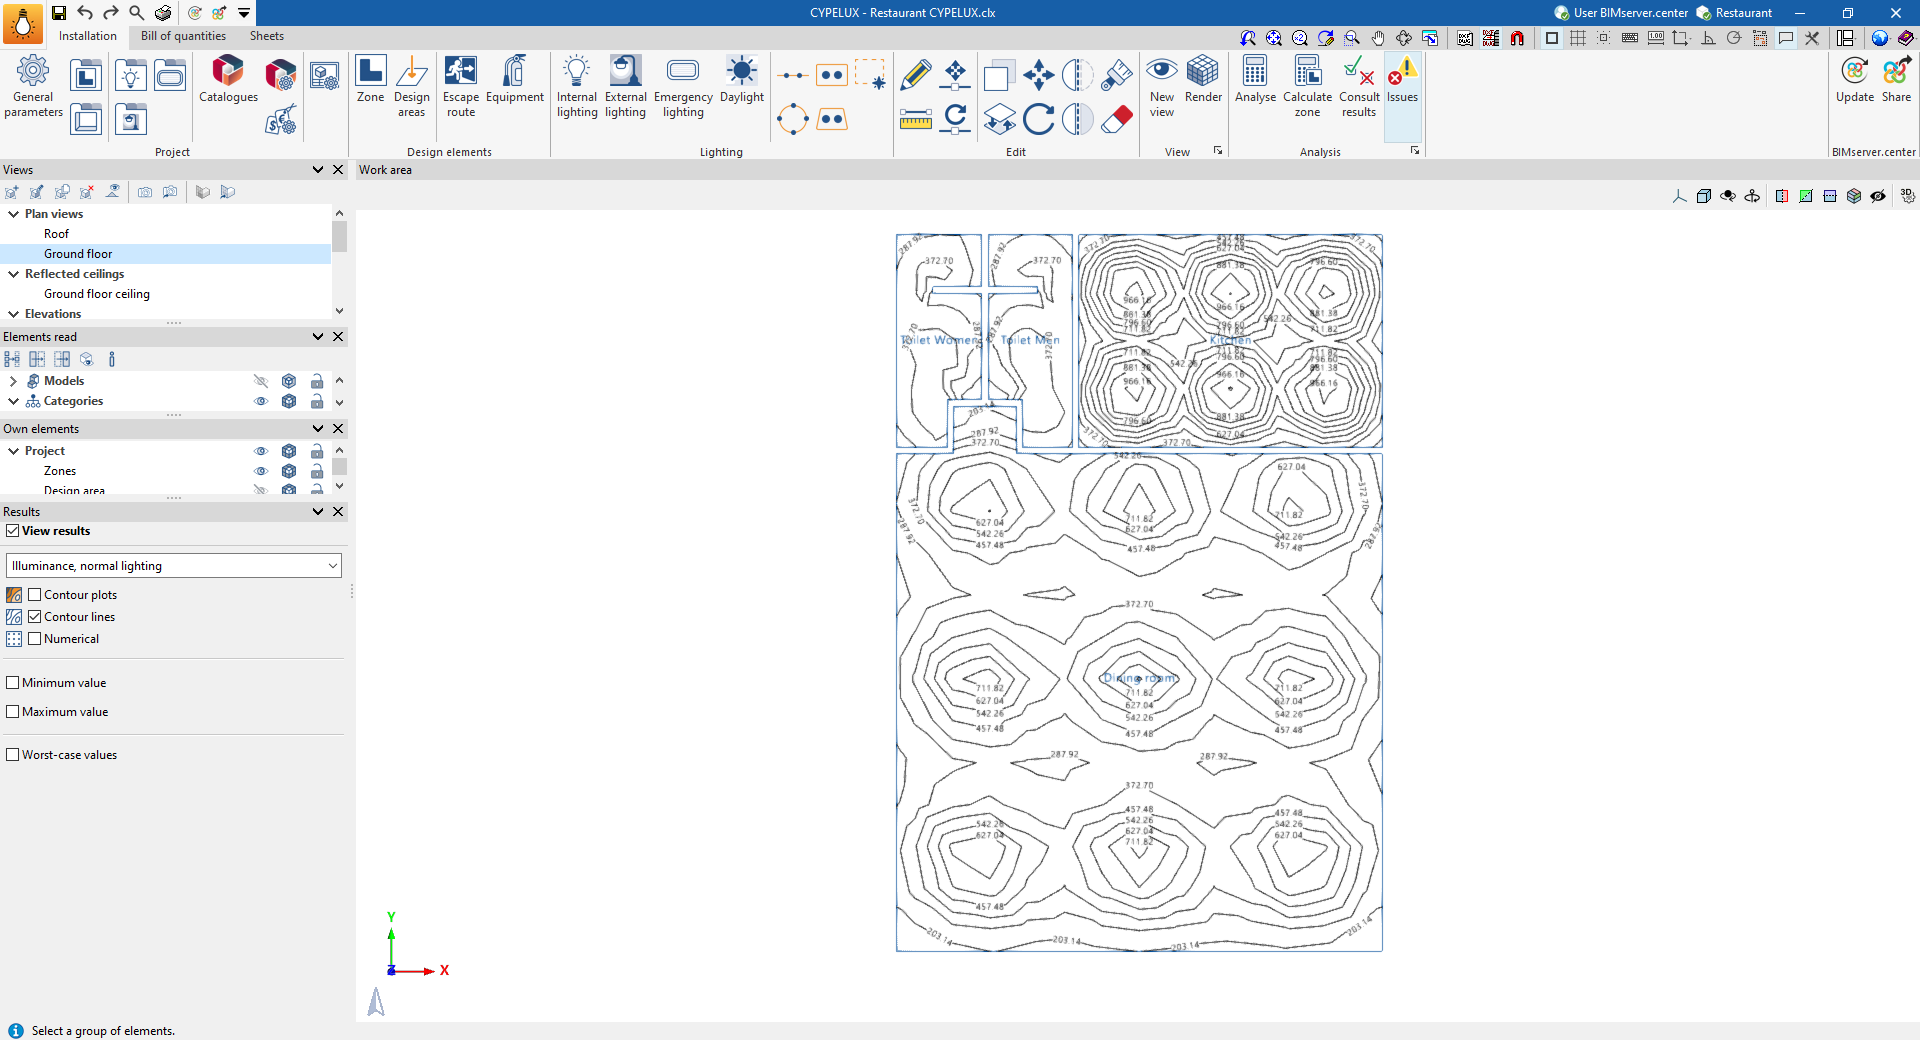
Displays the contour plot diagram using a colour gradient on the plan view, showing the calculated values. A legend for the diagram, in the form of a colour scale, is displayed at the bottom of the screen. - Contour lines (optional)
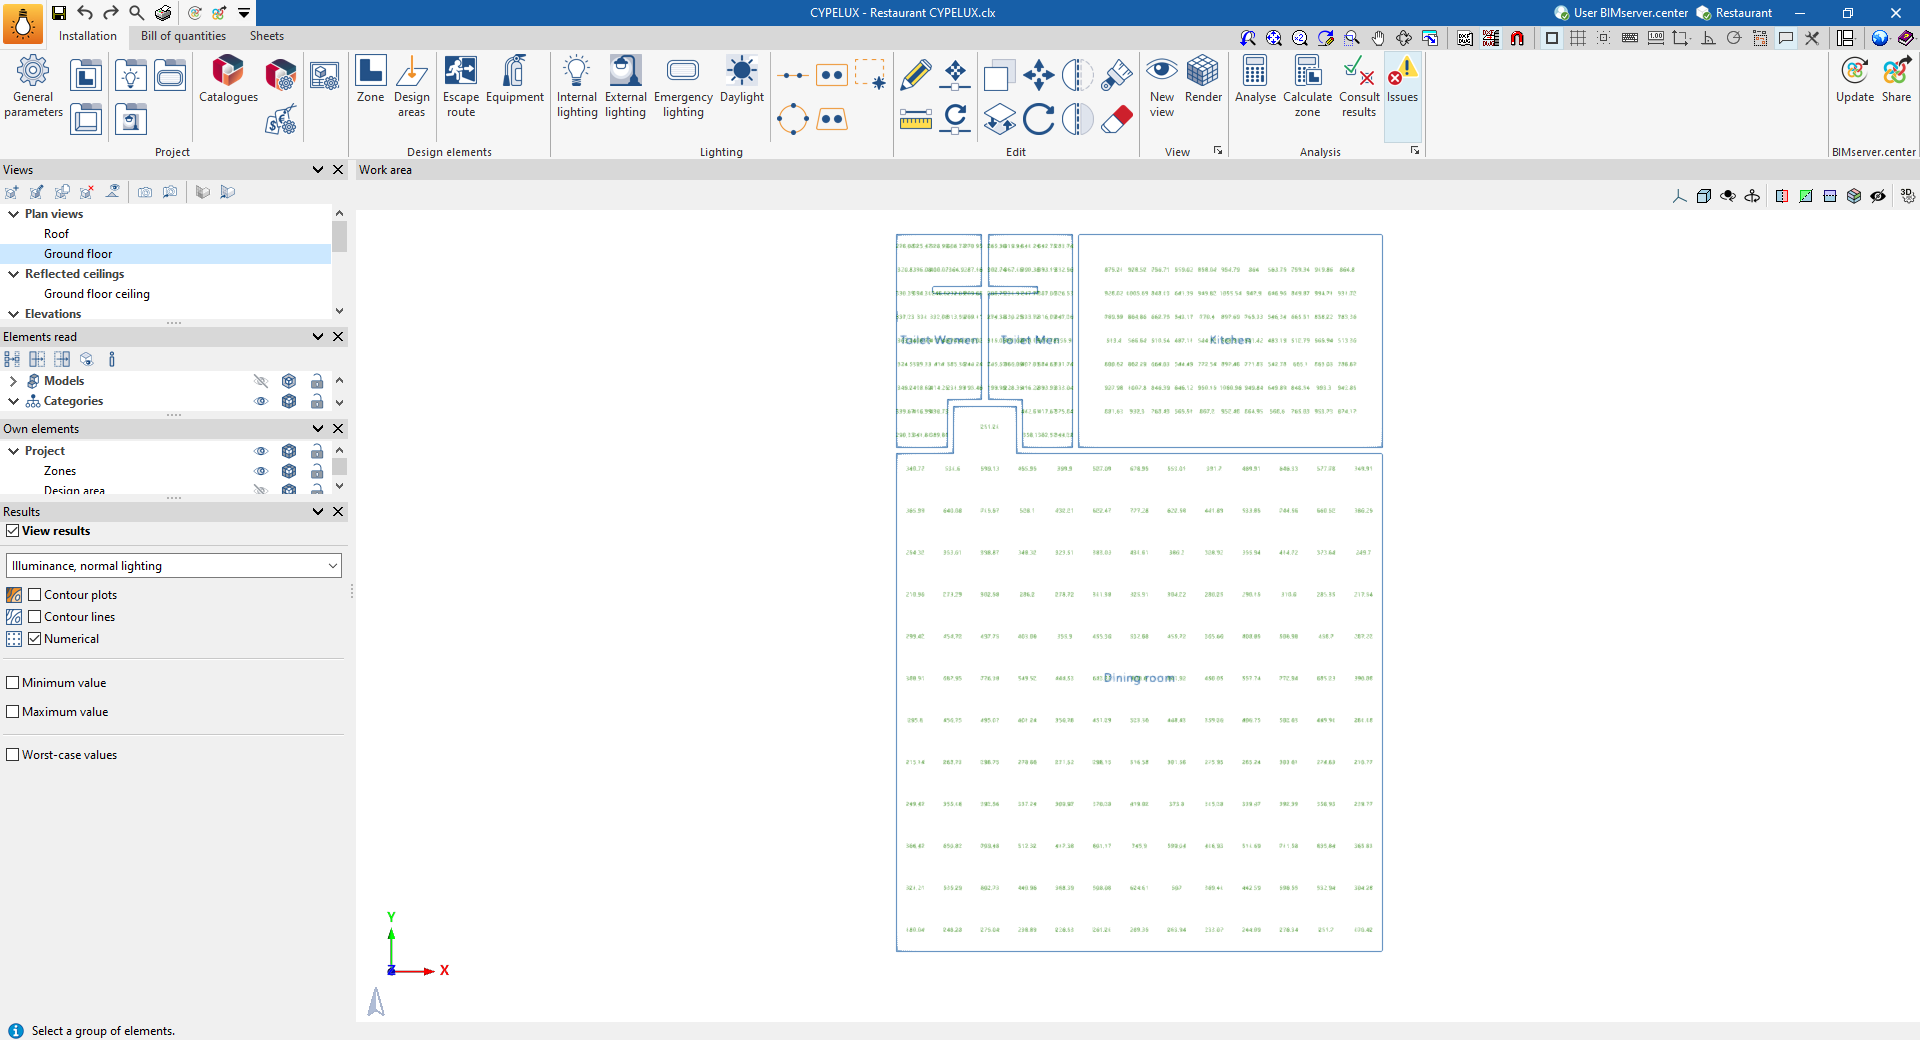
Displays the contour diagram with the values calculated for each contour line. - Numerical (optional)
Displays the calculated numerical values on a grid of points on the plan.
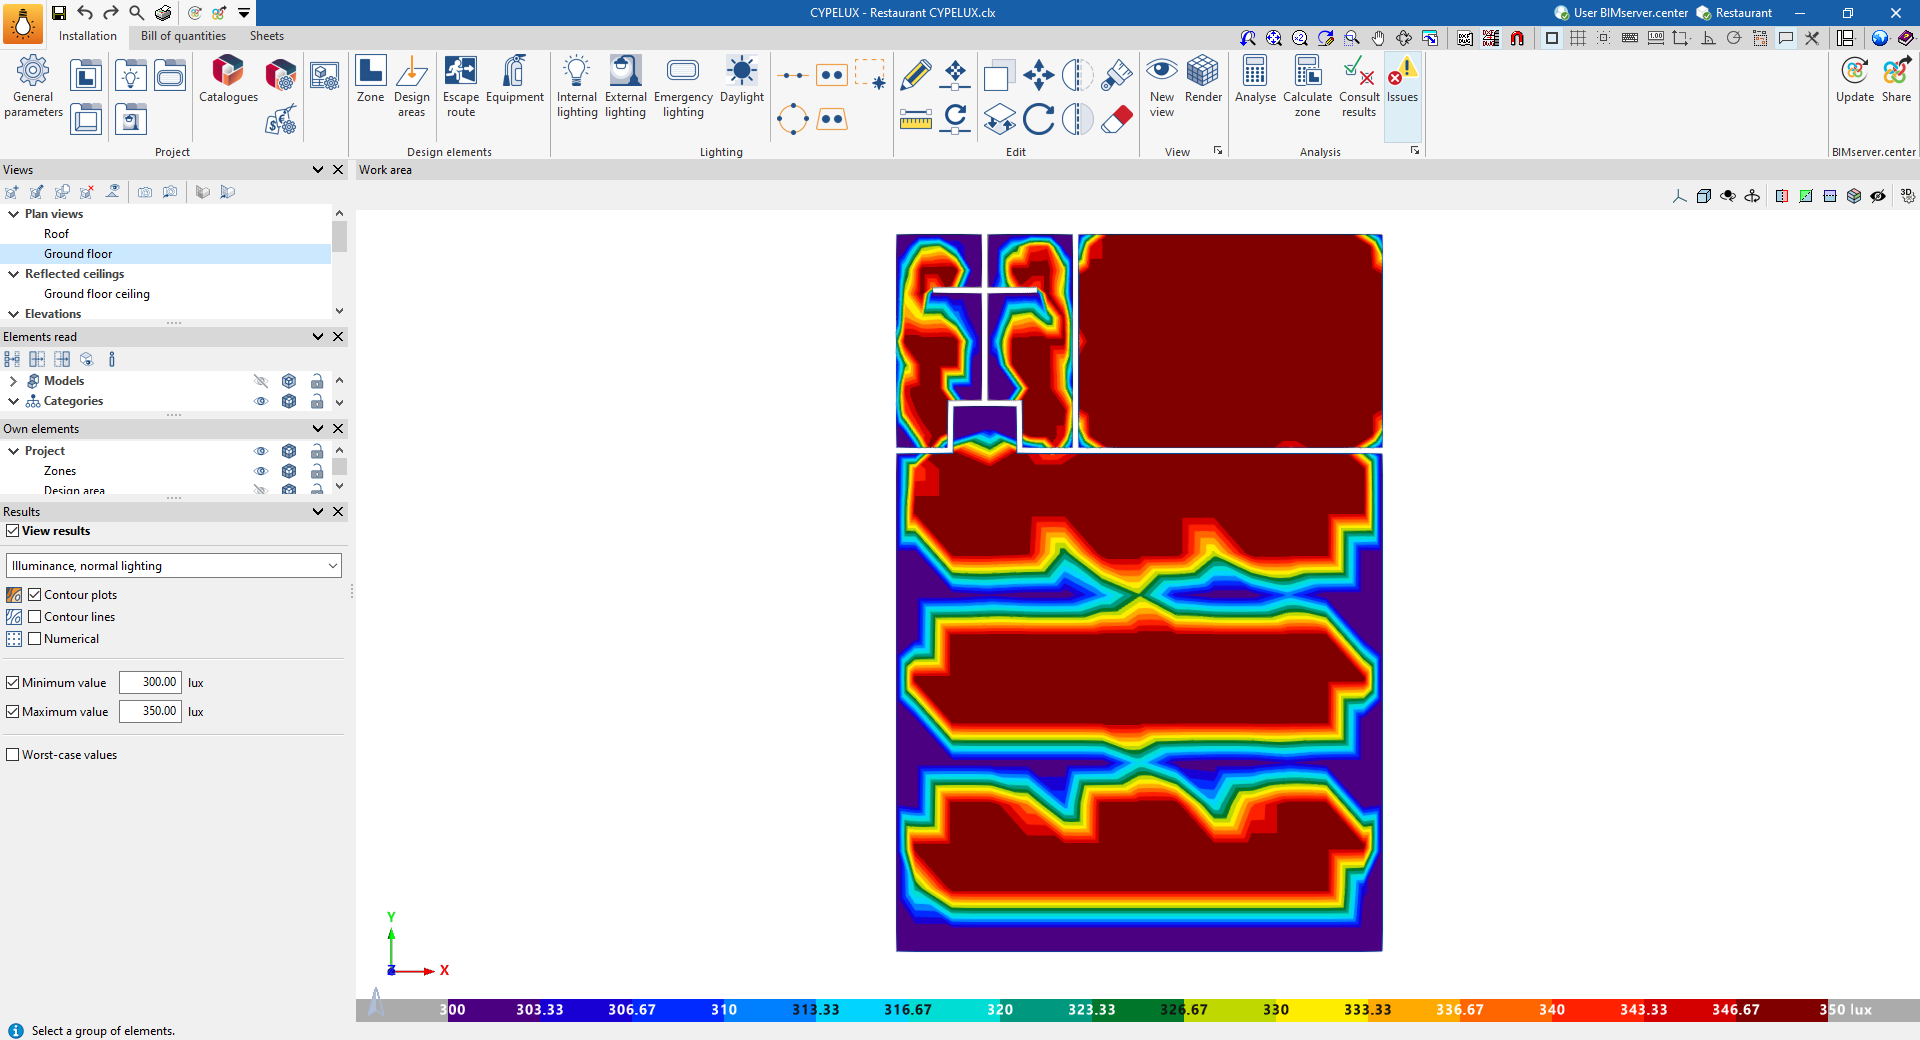
It is also possible to adjust the range of values displayed in the diagrams by entering a "Minimum value" and a "Maximum value" to be plotted, as well as to include the positions of the "worst-case values" obtained in the calculation.