Consulting information in the project tree under the "Analysis" tab
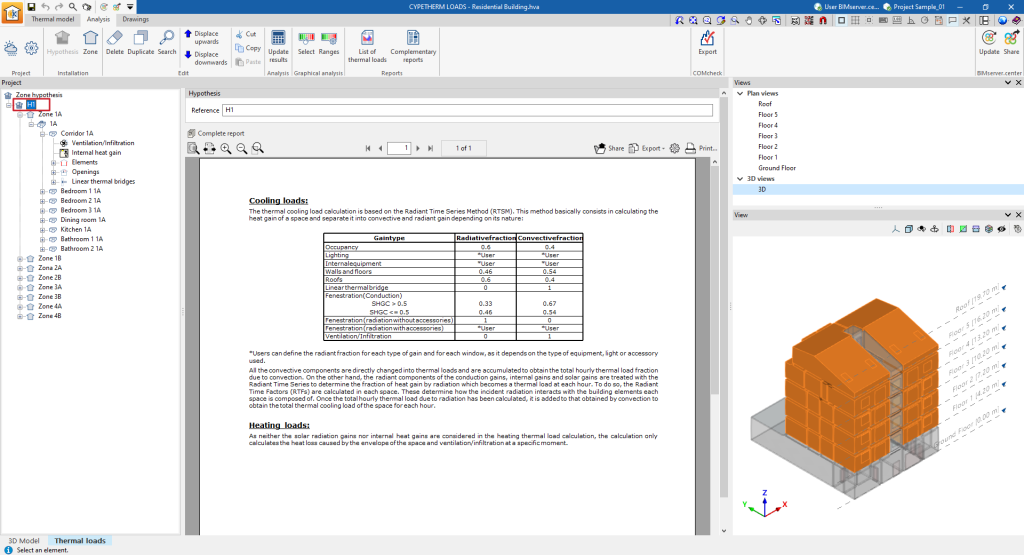
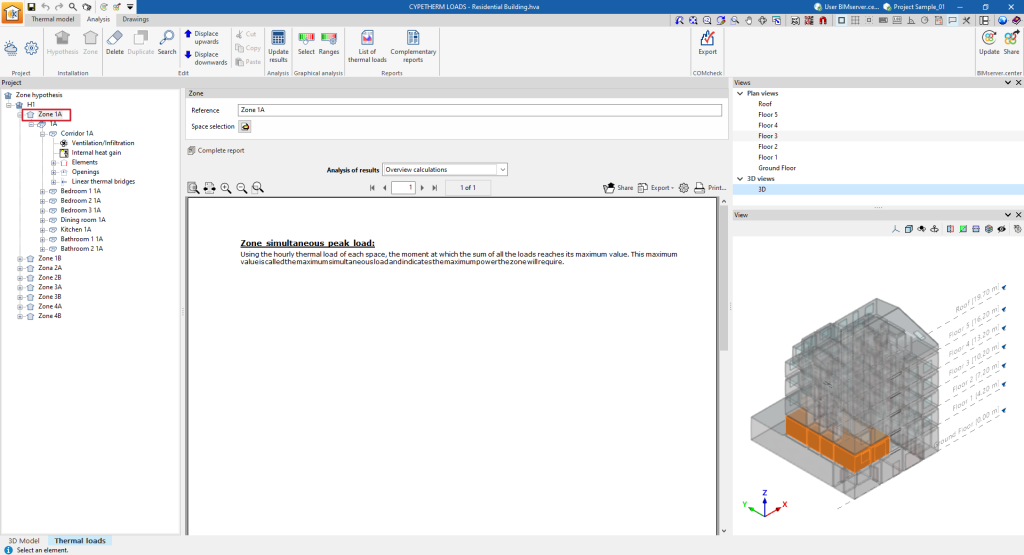
In the "Thermal loads" tab, on the left side of the "Analysis" tab, there is a tree of project elements. This tree is organised according to the different zone hypotheses defined, where the zones are included with the assigned spaces and, within each enclosure, the ventilation and infiltration data, the internal heat gains, and the calculated data for the associated elements, openings and linear thermal bridges.
This information is updated and can be consulted after the thermal load analysis of the building by using the "Update results" option in the top toolbar.
The information available at each level of this tree is as follows:
Information in the "Hypothesis" level
If a zone hypothesis is selected in the tree, the program displays an information text in the central part of the interface with details on the heat load analysis method used.
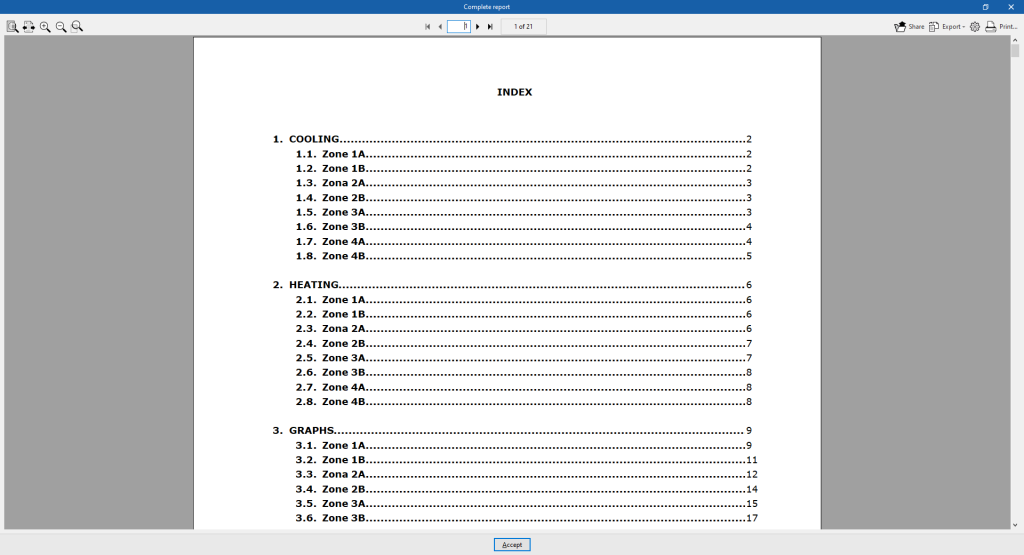
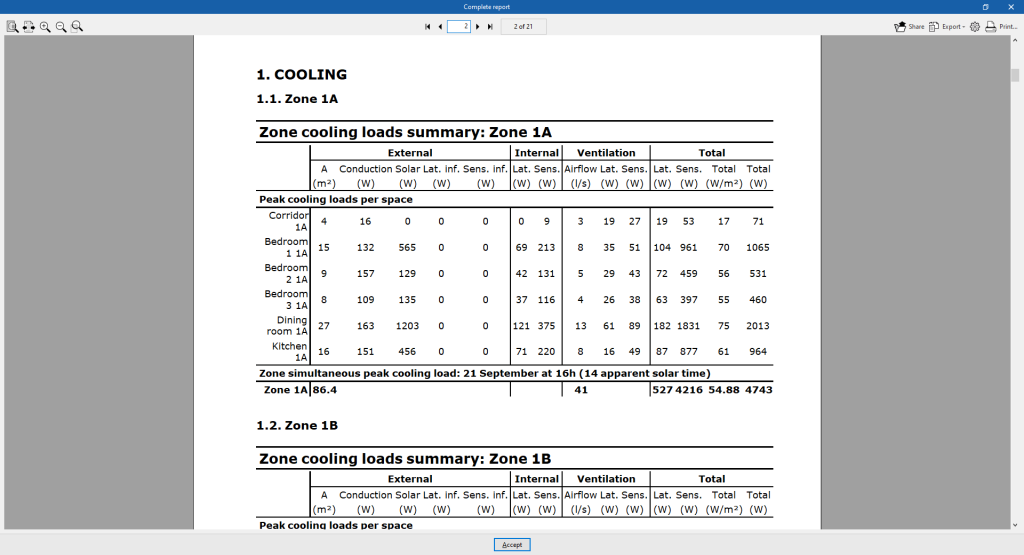
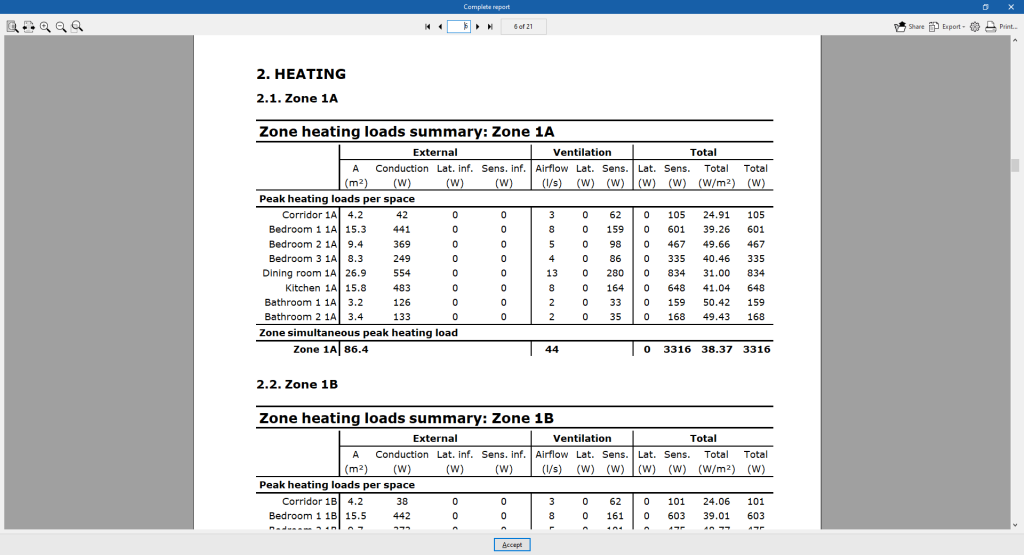
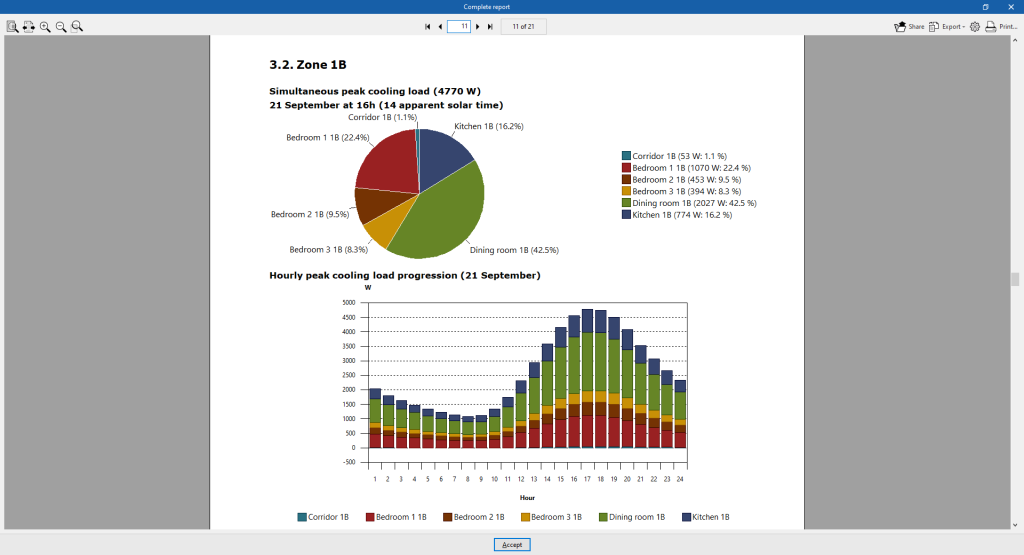
Furthermore, with the "Full report" option a "Thermal loads report" can be generated for all zones defined in the selected hypothesis, containing the following information:
- Cooling
- Zone cooling loads summary (External, Internal, Ventilation, Total)
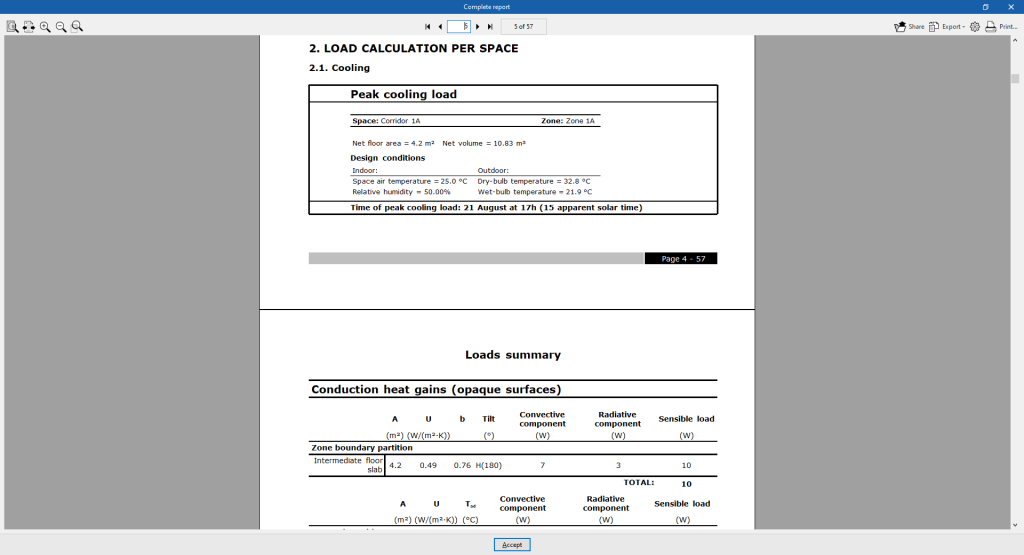
- Peak cooling loads per space
- Zone simultaneous peak cooling load
- Zone cooling loads summary (External, Internal, Ventilation, Total)
- Heating
- Zone heating loads summary (External, Internal, Ventilation, Total)
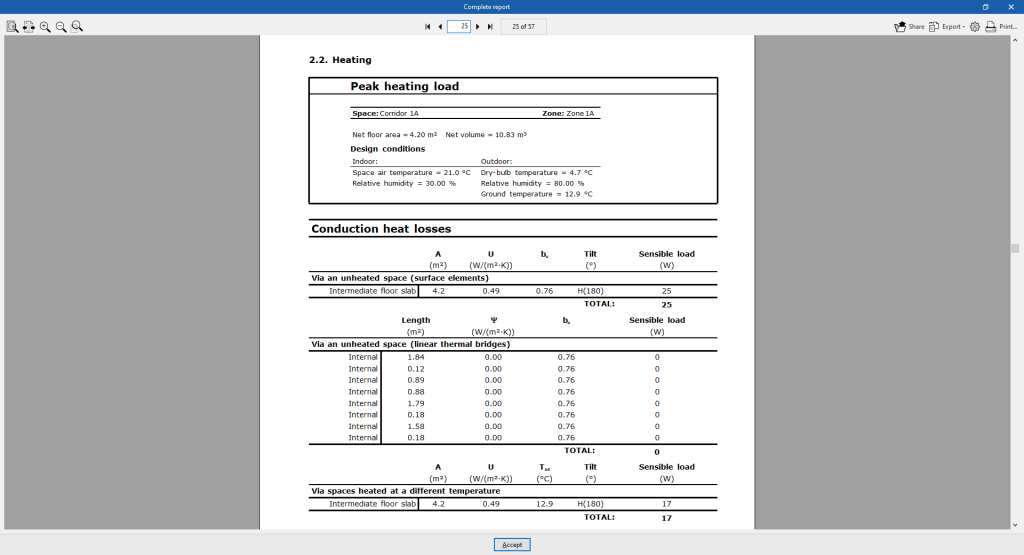
- Peak heating loads per space
- Zone simultaneous peak heating load
- Zone heating loads summary (External, Internal, Ventilation, Total)
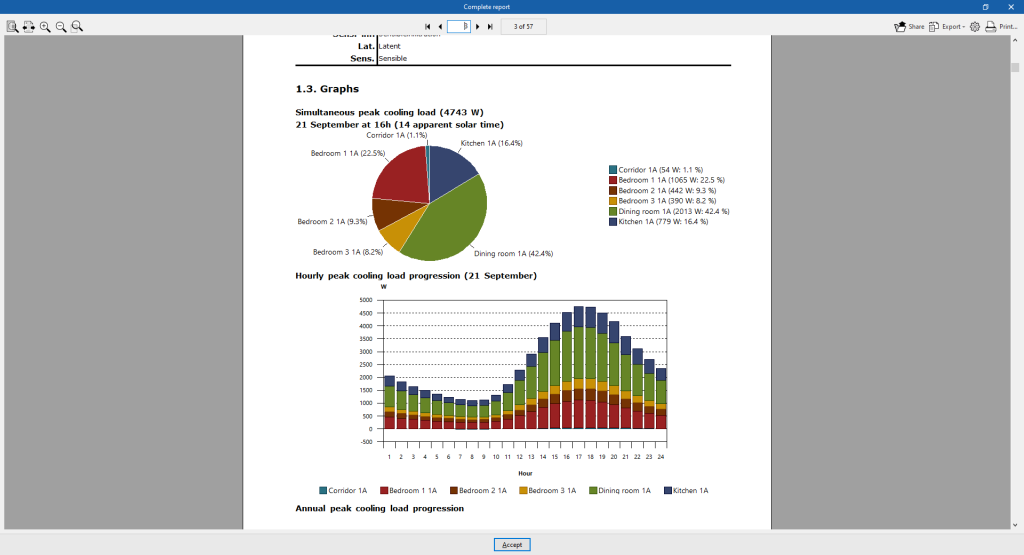
- Graphs
- Simultaneous peak cooling load
- Hourly peak cooling load progression
- Annual peak cooling load progression
- Peak heating load
Information in the "Zone" level
If a zone is selected in the tree, the program displays the drop-down menu "Results analysis", which allows the following information to be displayed in the central part of the program interface, depending on the selection made:
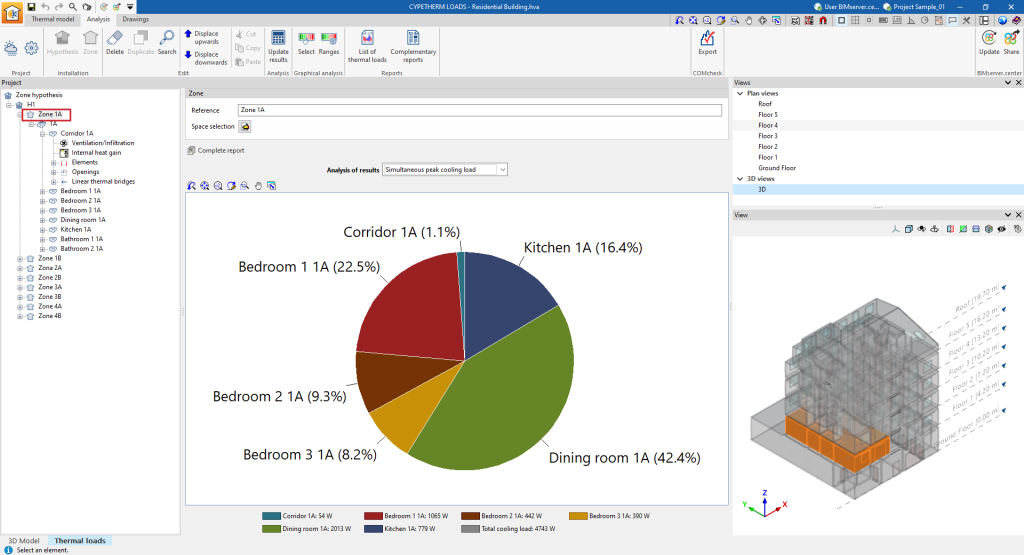
- Simultaneous peak cooling load
Shows a pie chart with the absolute values of cooling thermal loads and the percentage contribution of each space to the total cooling thermal load of the zone.
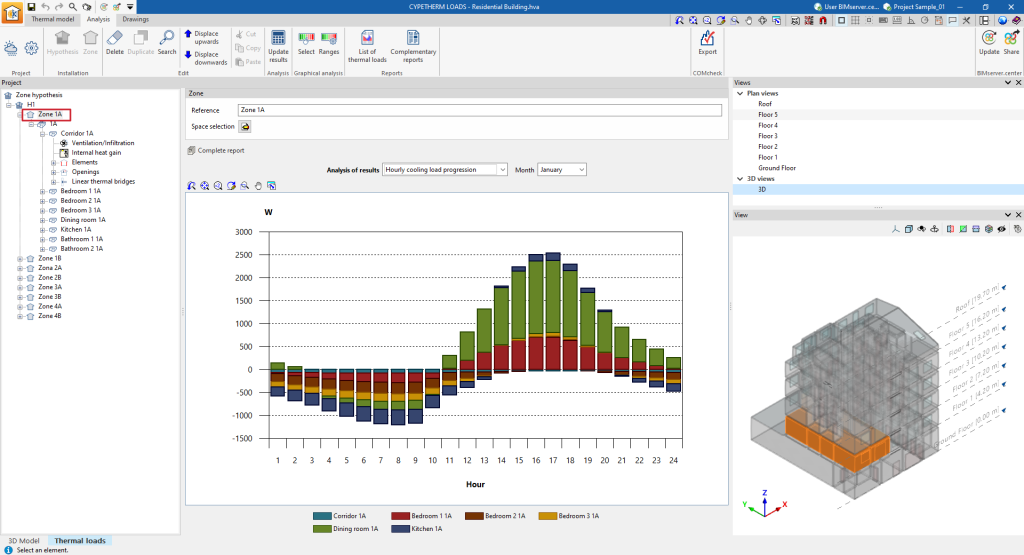
- Simultaneous peak cooling load (for each month)
Displays a bar chart with the values broken down by space and aggregated by hour of the cooling thermal loads of the spaces in the area.
- Annual peak cooling load progression
Displays a bar chart with the values broken down by space and aggregated by month of the cooling thermal loads of the spaces in the area.
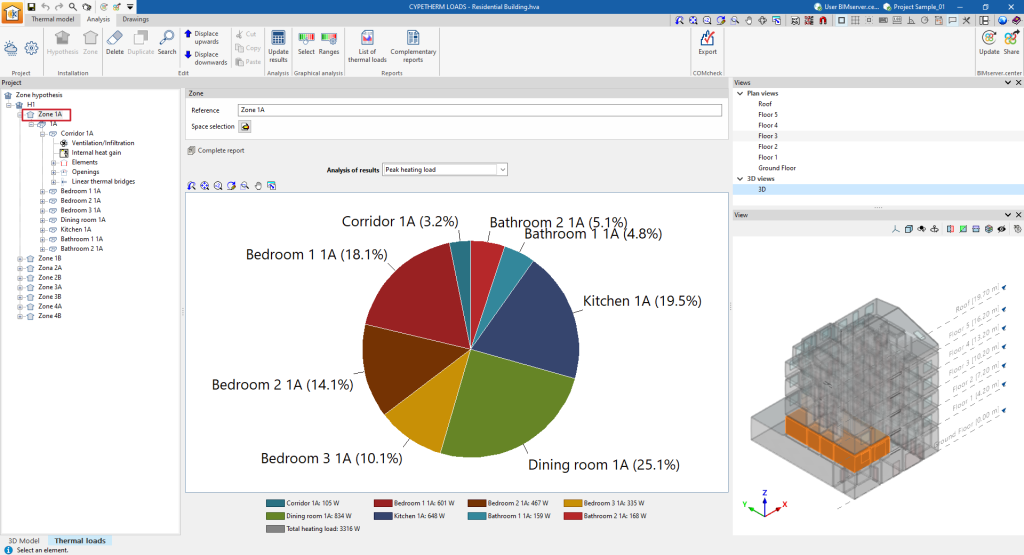
- Peak heating load
Displays a pie chart with the absolute values of heating loads and the percentage contribution of each space to the total heating load of the area.
- Overview calculations
Displays an informative text with details on the analysis of the maximum simultaneous load of the zone.
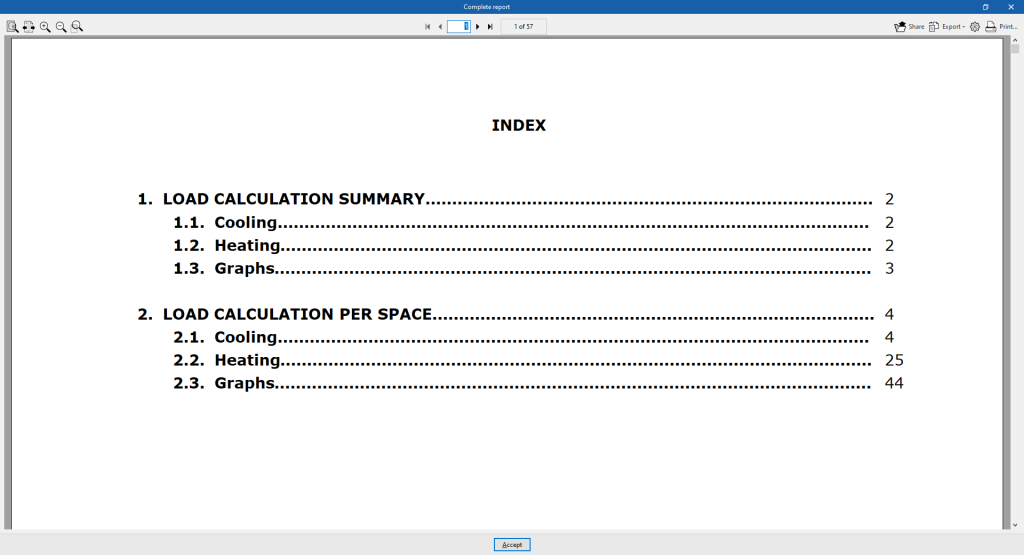
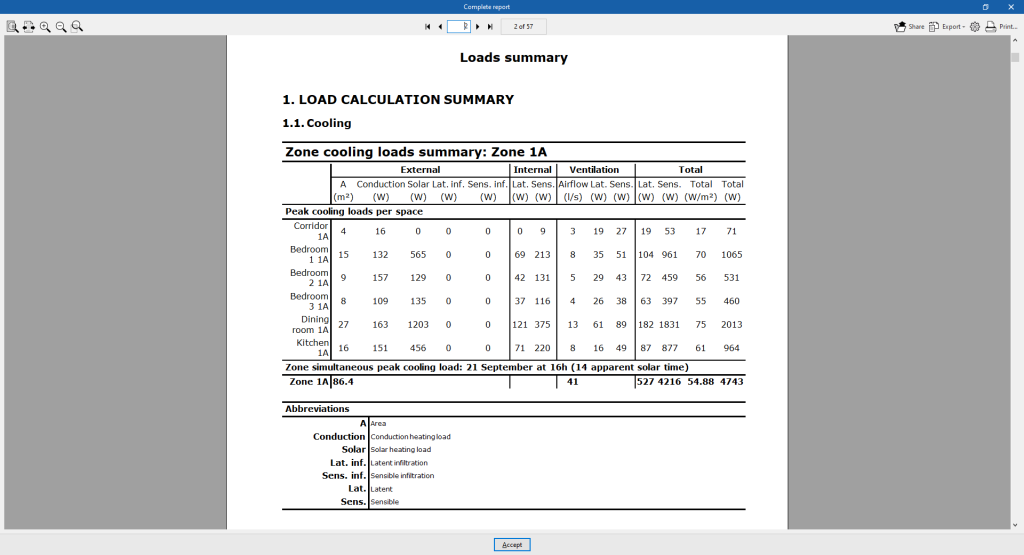
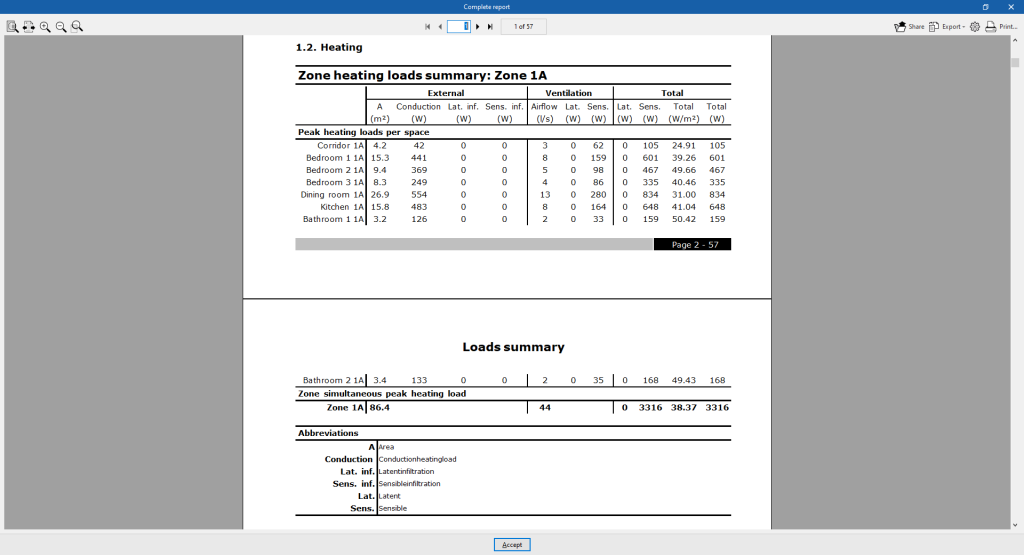
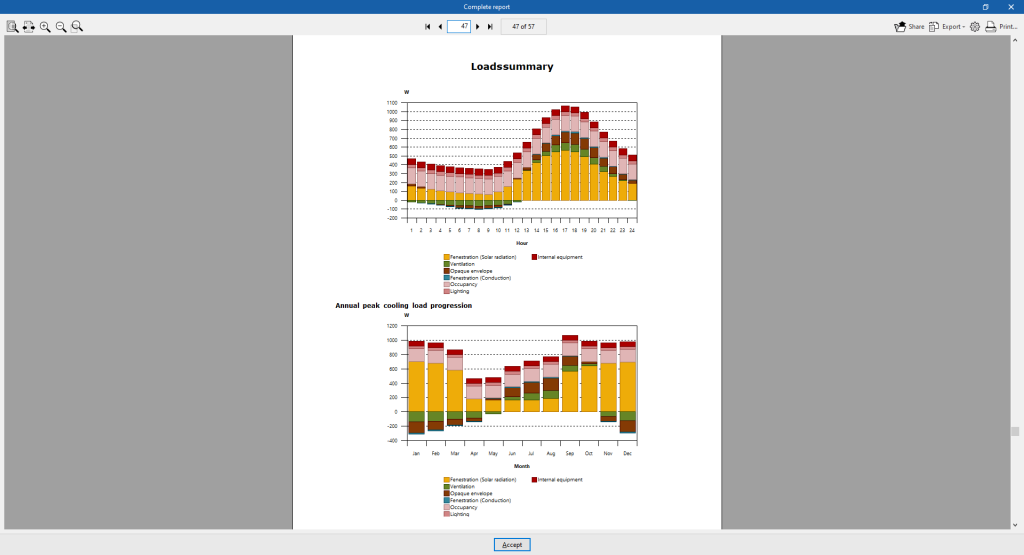
In addition, with the "Complete report" option, a "Loads summary" can be generated, both for the selected zone and for all the spaces that comprise it, containing the following information:
- Load calculation summary (by zone)
- Cooling
- Zone cooling loads summary (External, Internal, Ventilation, Total)
- Peak cooling loads per space
- Zone simultaneous peak cooling load
- Zone cooling loads summary (External, Internal, Ventilation, Total)
- Heating
- Zone heating loads summary (External, Internal, Ventilation, Total)
- Peak cooling loads per space
- Zone simultaneous peak cooling load
- Zone heating loads summary (External, Internal, Ventilation, Total)
- Graphs
- Simultaneous peak heating load
- Hourly peak cooling load progression
- Annual peak cooling load progression
- Peak heating load
- Cooling
- Summary of load analysis results for each space
- Cooling
- Peak cooling load
- Conduction heat gains (opaque surfaces)
- Conduction heat gains (fenestration)
- Internal heat gains
- Ventilation and infiltration heat gains
- Total cooling load
- Peak cooling load
- Heating
- Peak heating load
- Conduction heat losses
- Ventilation and infiltration heat losses
- Total heating load
- Peak heating load
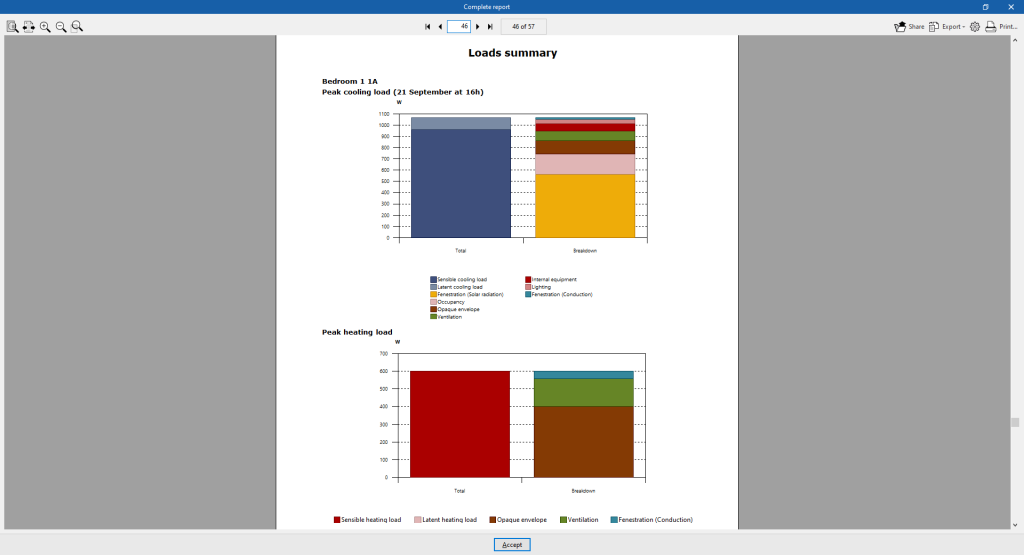
- Graphs
- Peak cooling load
- Peak heating load
- Hourly cooling load progression
- Annual peak cooling load progression
- Maximum heating load
- Cooling
Information in the "Space" level
If a space is selected in the tree, the program displays the "Results analysis" drop-down menu, which allows the following information to be displayed in the central part of the program interface, depending on the selection made:
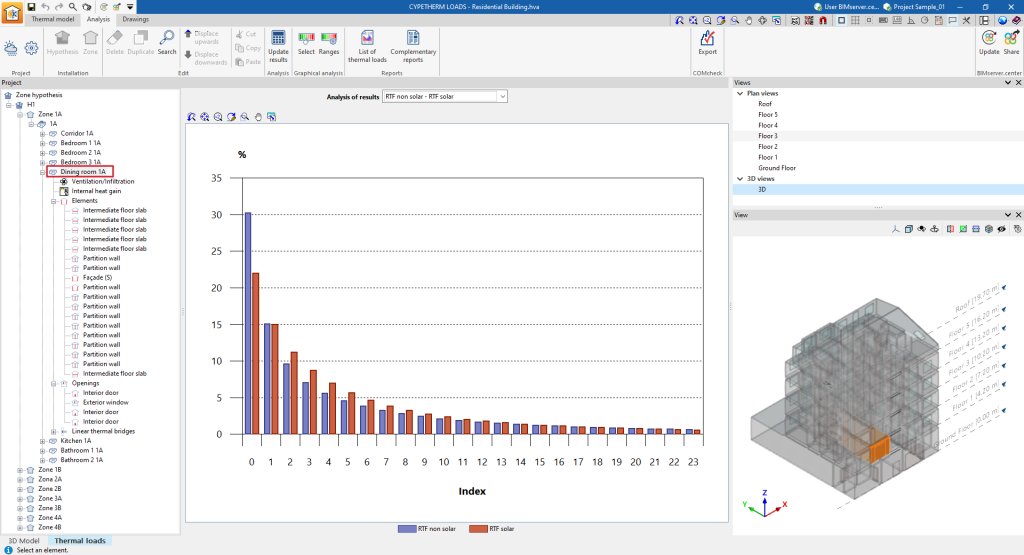
- RTF non solar - RTF solar
Displays a bar chart with the values (%) of the RTF indices obtained in the calculation.
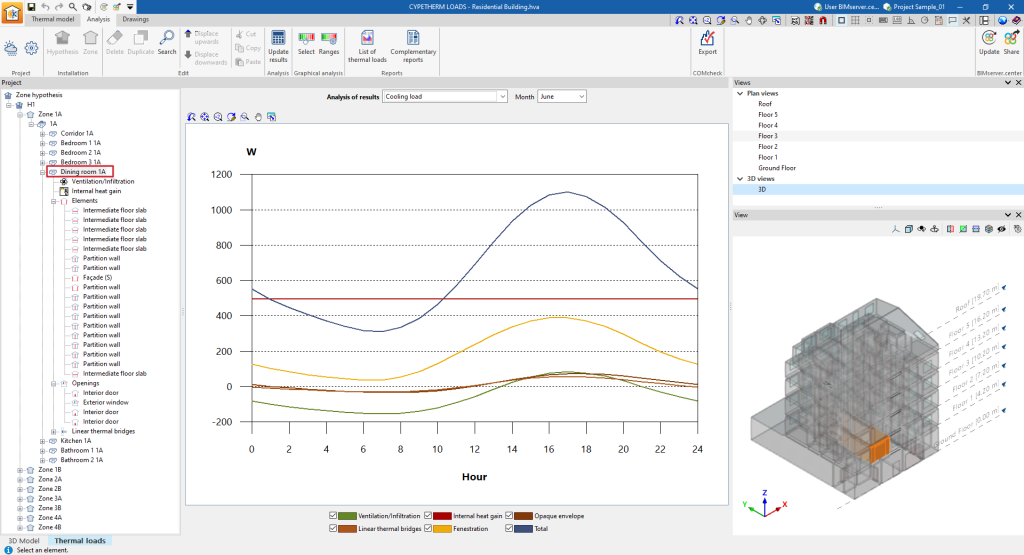
- Cooling load (for each month)
Displays a line graph with broken-down values of the cooling thermal loads of the space for each month.
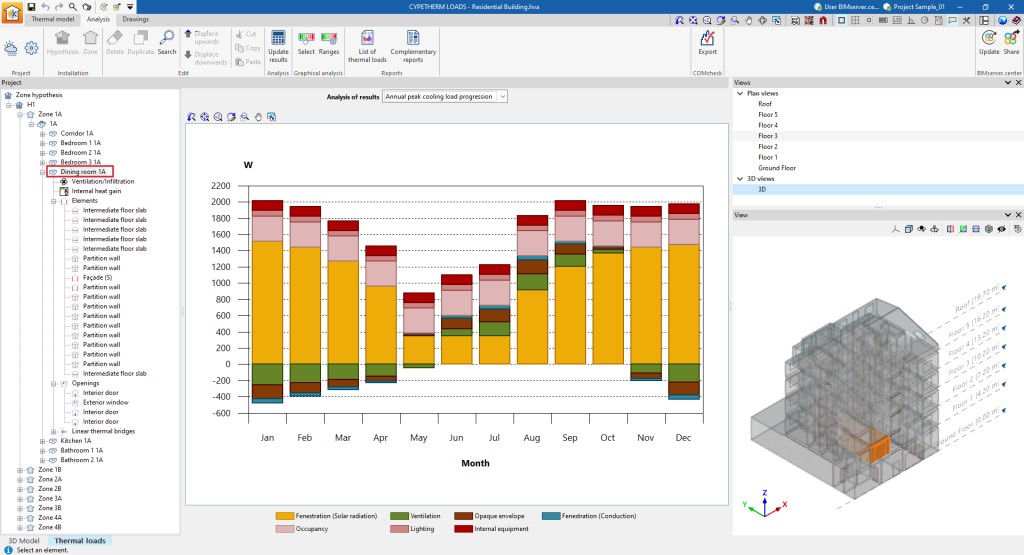
- Annual peak cooling load progression
Displays a bar chart with broken-down values of the cooling thermal loads of the space and aggregates by month.
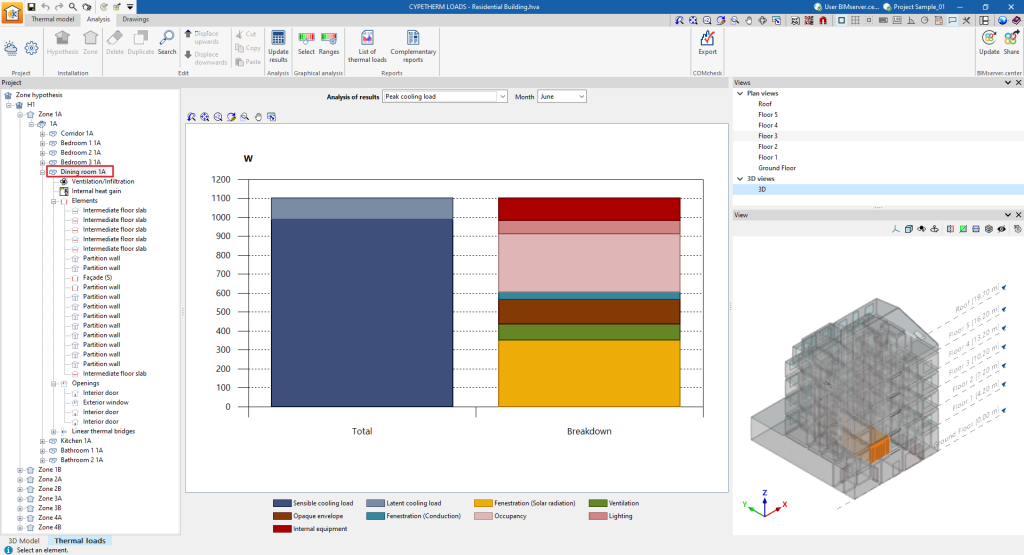
- Peak cooling loads
Displays a bar chart with the total value and the aggregate of the disaggregated values of the space cooling loads for each month.
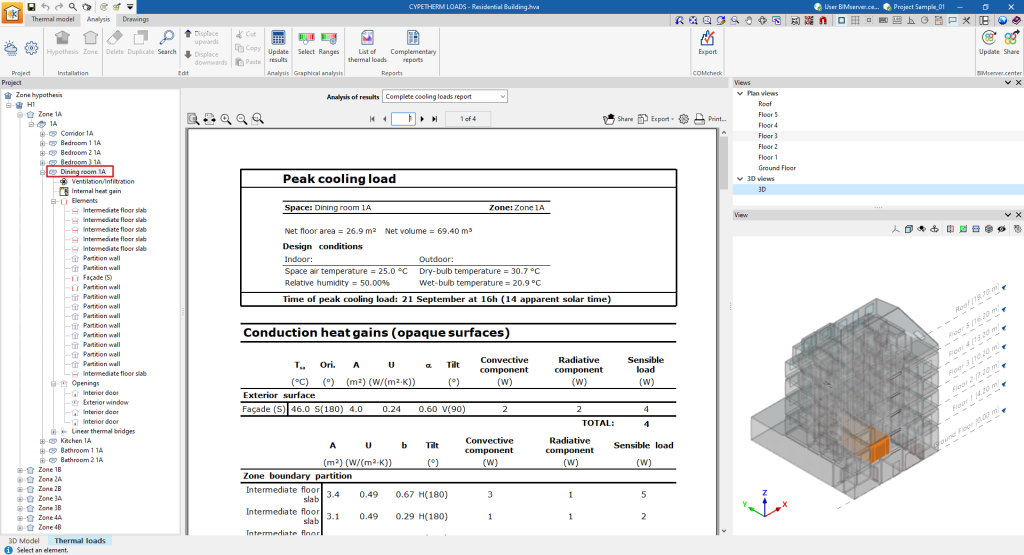
- Complete cooling loads report
Displays the cooling thermal loads report for the enclosure, which includes the following data:- Peak cooling loads
- Conduction heat gains (opaque surfaces)
- Conduction heat gains (fenestration)
- Internal heat gains
- Ventilation and infiltration heat gains
- Total cooling load
- Peak cooling loads
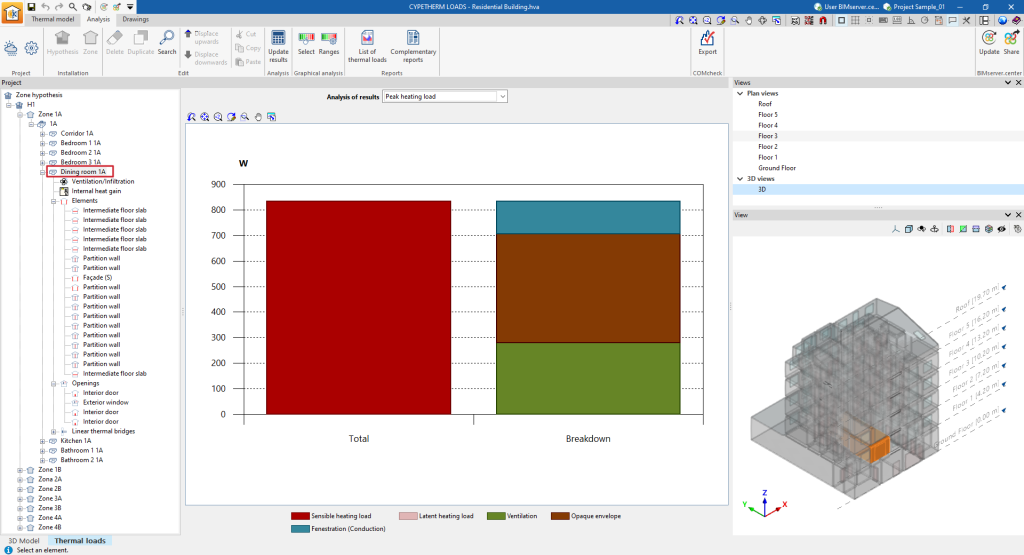
- Peak heating load
Displays a bar chart with the total value and with the aggregate of the disaggregated values of the heating loads of the space.
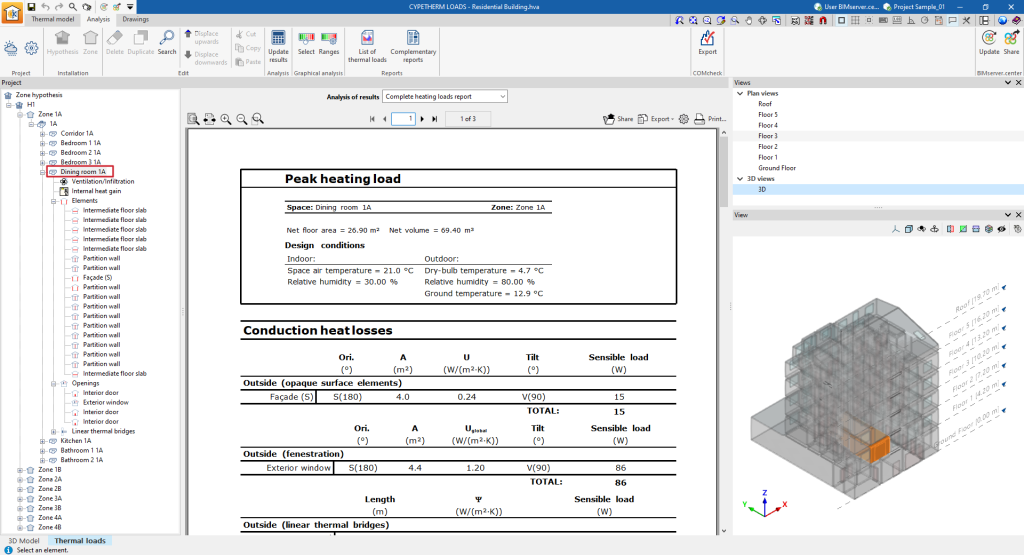
- Complete heating loads report
Displays the heating loads report for the space, which includes the following data:- Peak heating load
- Conduction heat losses
- Ventilation and infiltration heat losses
- Total heating load
- Peak heating load
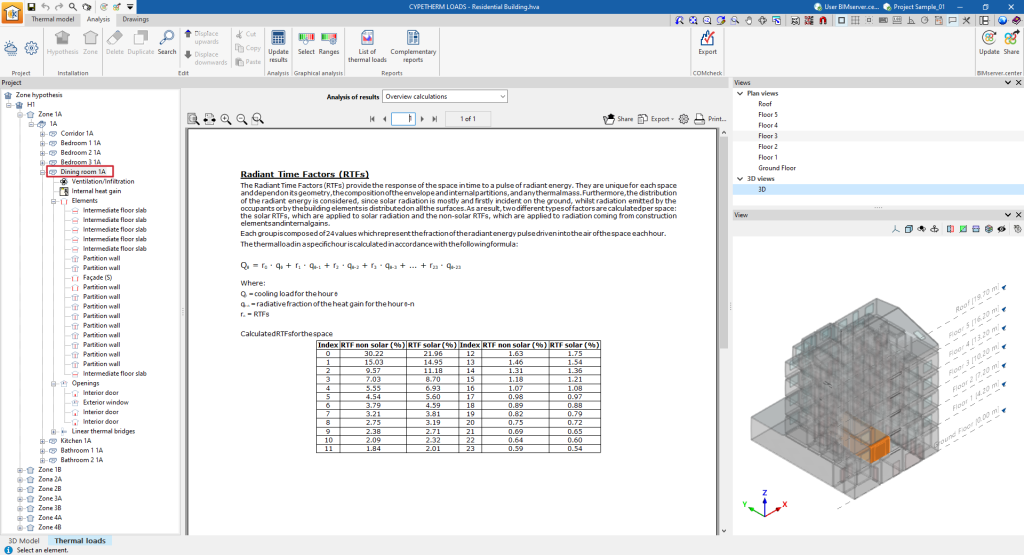
- Overview calculations
Displays an informative text with details on the calculation of the radiant time factors (RTF) in the space.
Information related to the ventilation/infiltration of the space
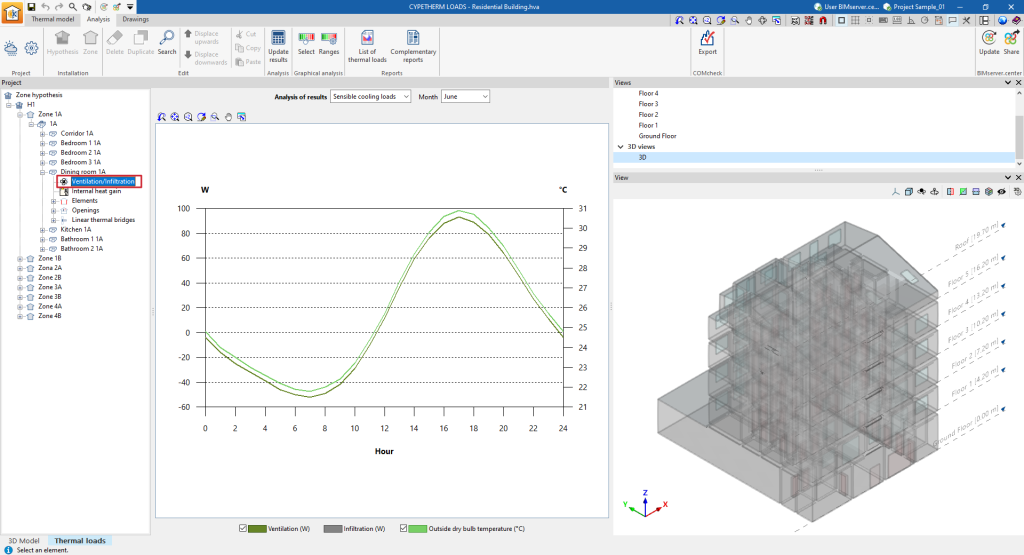
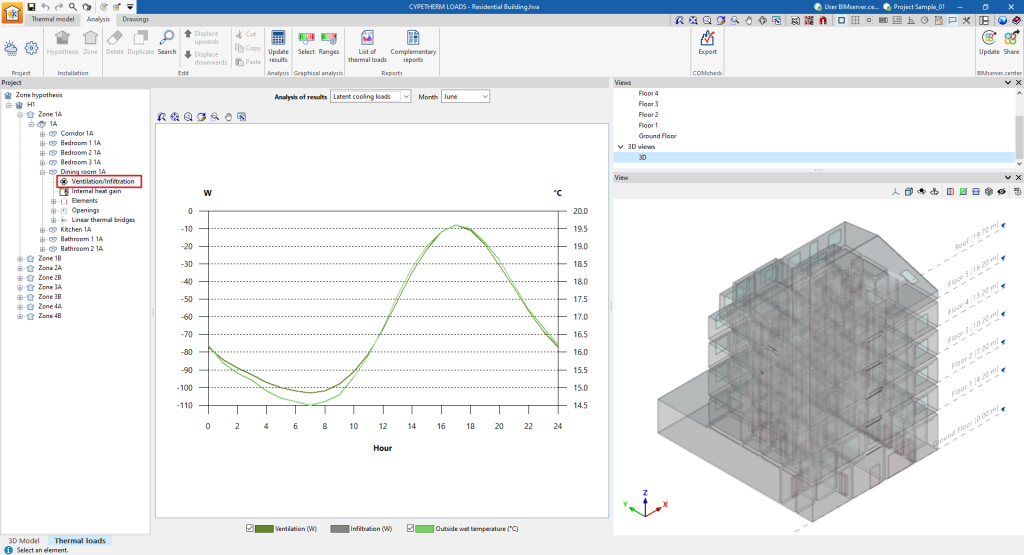
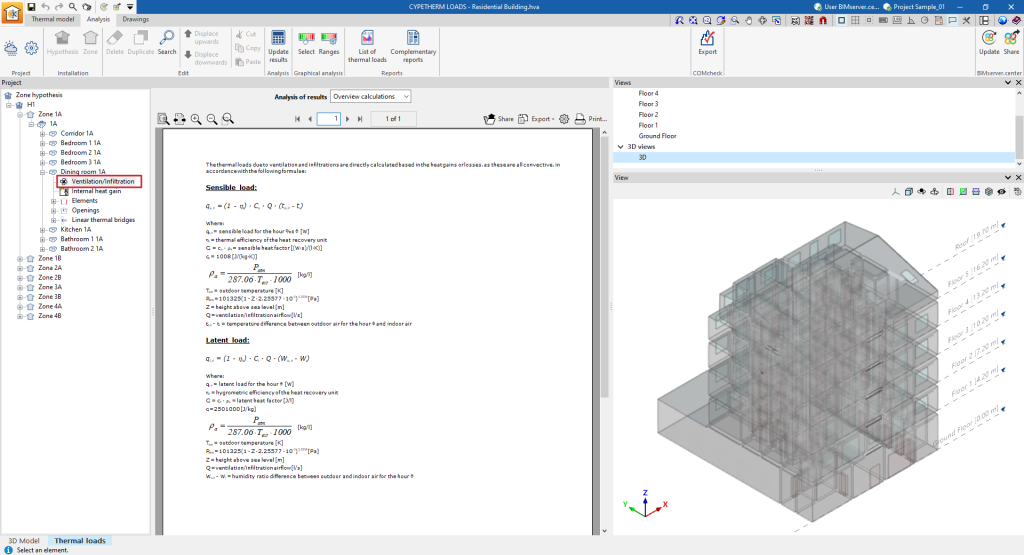
If a space is selected in the tree and then the "Ventilation/Infiltration" level is selected, the program displays the "Analysis of results" drop-down menu, which allows the following information to be displayed in the central part of the program interface, depending on the selection made:
- Sensible cooling loads
Displays the hourly evolution of the sensible cooling loads due to ventilation and infiltration and the dry outdoor temperature for the selected month.
- Latent cooling loads
Displays the hourly evolution of the latent cooling loads due to ventilation and infiltration, and the outdoor humid temperature for the selected month.
- Overview calculations
Displays an informative text with details on the calculation of sensible and latent loads due to ventilation and infiltration.
Information on the internal heat gain of the space
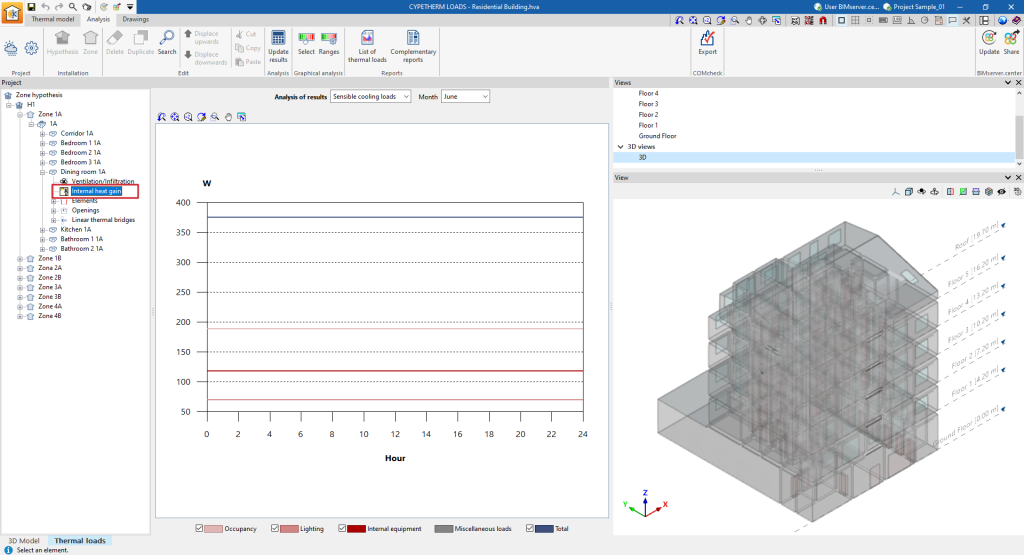
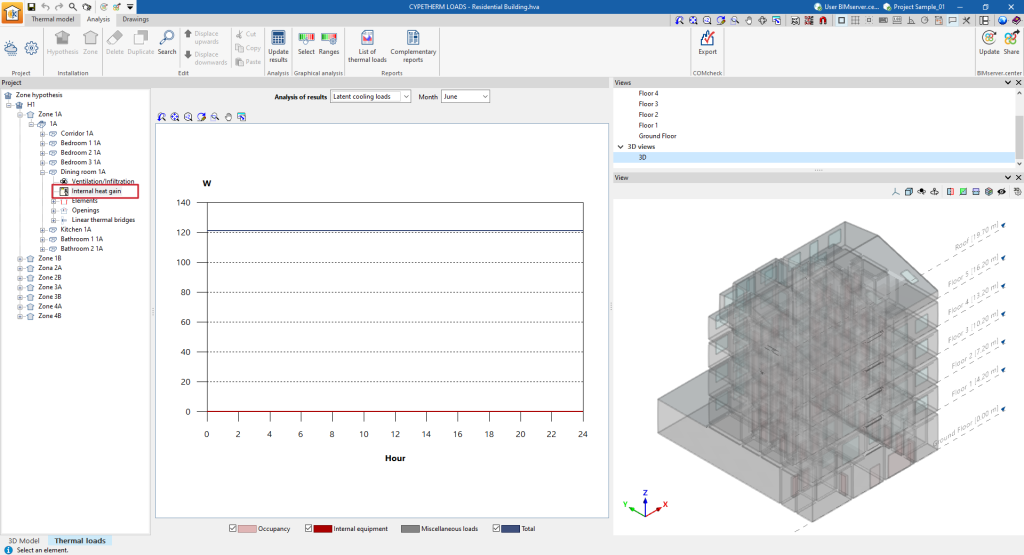
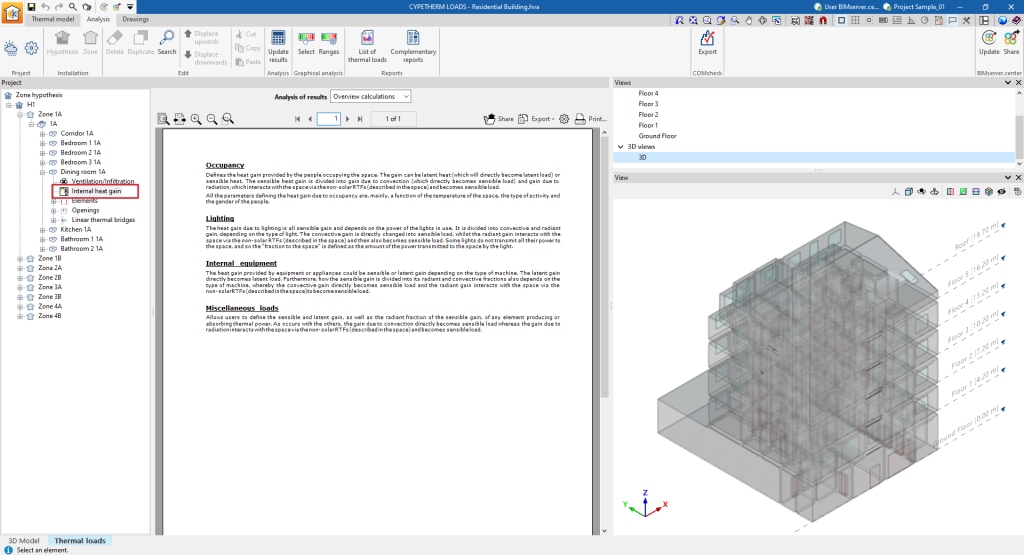
If a space is selected in the tree and then the "Internal heat gain" level is selected, the program displays the drop-down menu "Analysis results", which allows the following information to be displayed in the central part of the program interface, depending on the selection made:
- Sensible cooling loads
Shows the hourly evolution of the sensitive cooling loads due to occupancy, lighting, internal equipment and other loads, and the total sensitive loads, for the selected month.
- Latent cooling loads
Shows the hourly evolution of latent cooling loads due to occupancy, lighting, internal equipment and other loads, and total sensible loads, for the selected month.
- Overview calculations
Displays an informative text with details on the calculation of internal heat gains.
Information on elements in the space
If a space is selected in the tree and then the "Elements" level is selected, the program displays an information text with details on the analysis of the cooling and heating loads in the building elements.
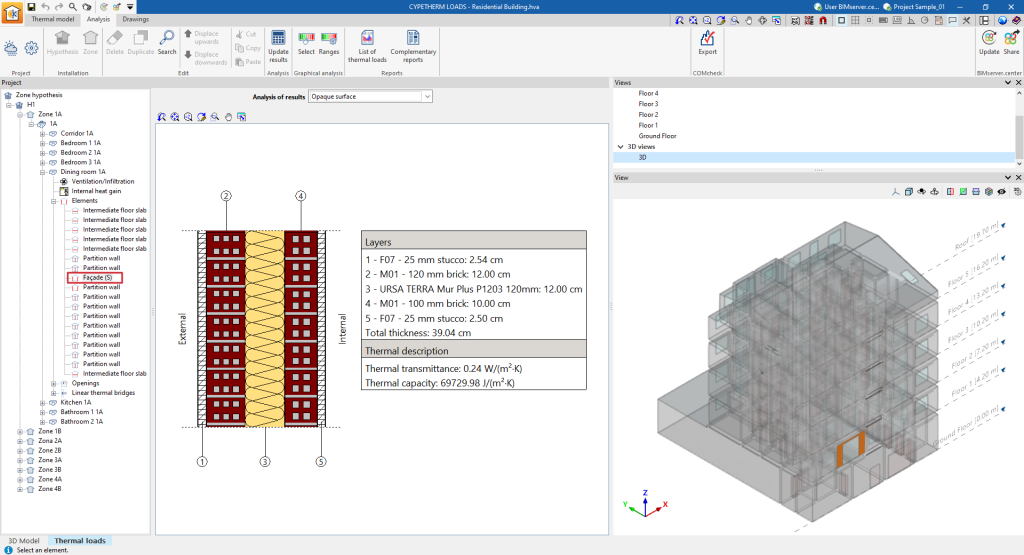
If, after having displayed the "Elements" level, a particular element is selected in the tree, the program displays the "Results analysis" drop-down menu, which allows the following information to be displayed in the central part of the program interface, depending on the selection made:
- Opaque element
Displays the construction detail of the selected building element with the layers of materials that compose it, its total thickness, and the parameters that describe its thermal characterisation, such as thermal transmittance and thermal capacity.
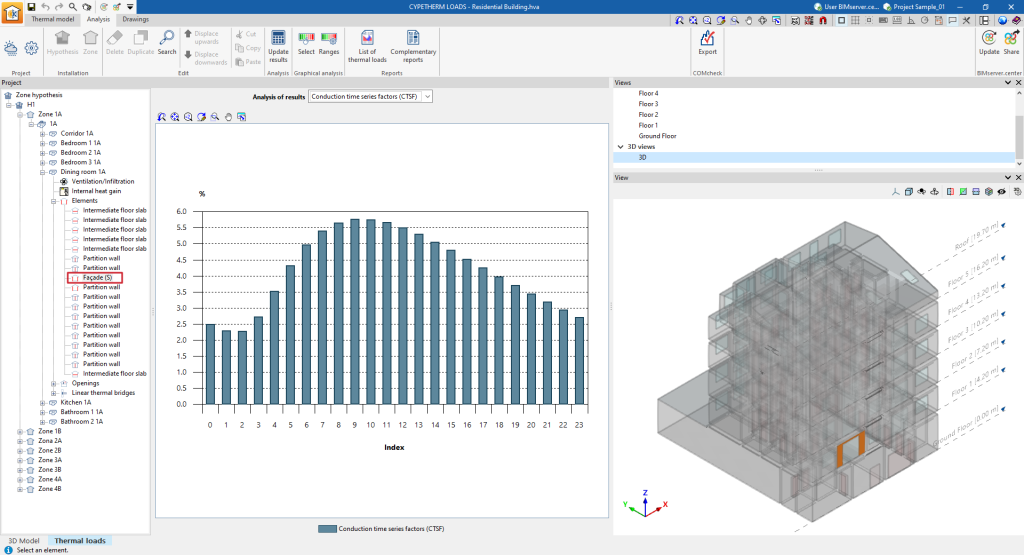
- Conduction time series factors (CTSF)
Displays a bar chart with the values (%) of the driving time series factors (CTSF) obtained in the analysis.
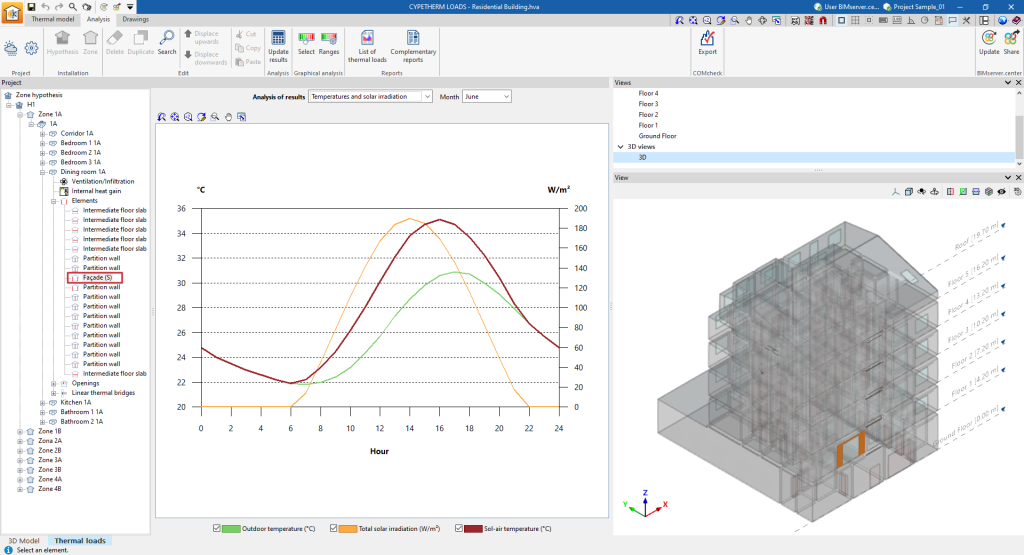
- Temperatures and solar irradiation
Shows the hourly evolution of the outdoor temperature, the sun-air temperature and the total solar irradiation for the selected month.
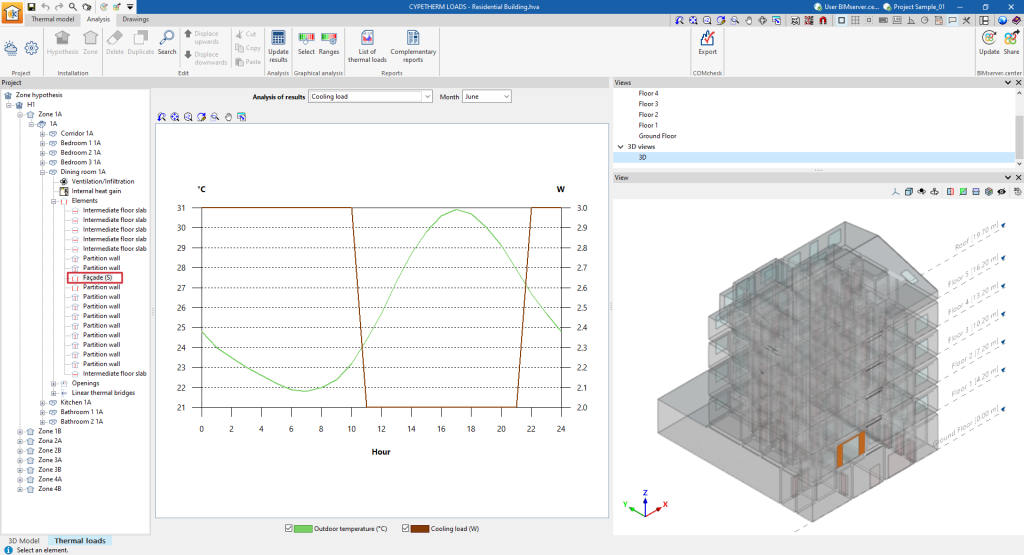
- Cooling load
Shows the hourly evolution of the cooling load as well as the outdoor temperature for the selected month.
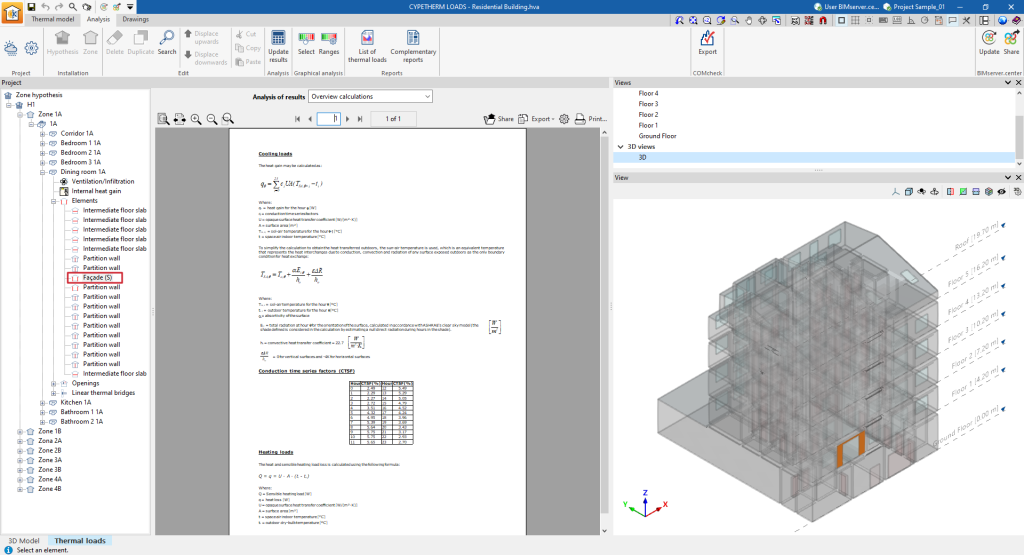
- Overview calculations
Displays an informative text with details on the analysis of the cooling loads, including the analysis of the sun-air temperature, the driving time series factors (CTSF), and the heating loads across the element.
Information in the openings of the space
If a space is selected in the tree and then the "Openings" level is selected, the program displays an information text with details on the analysis of the cooling and heating loads in the openings.
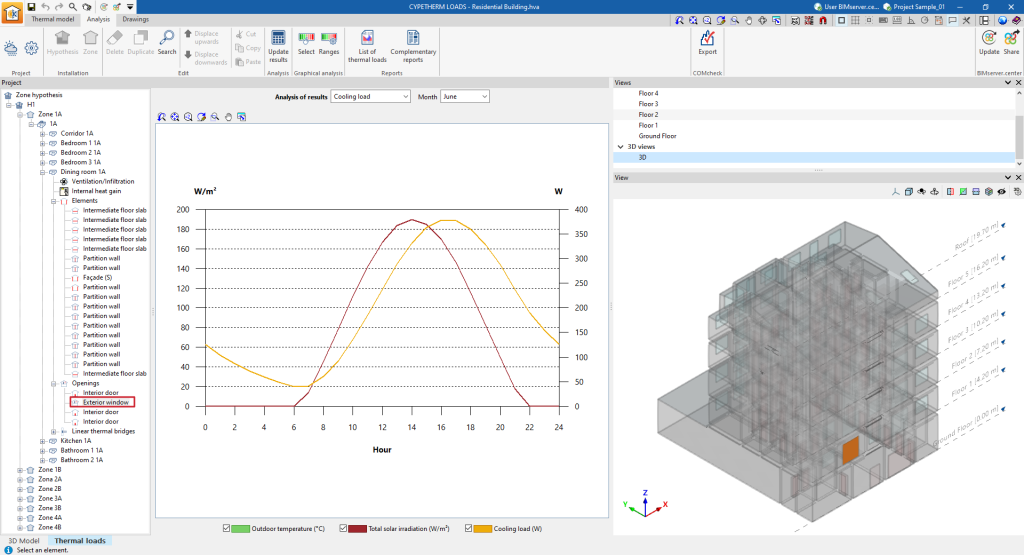
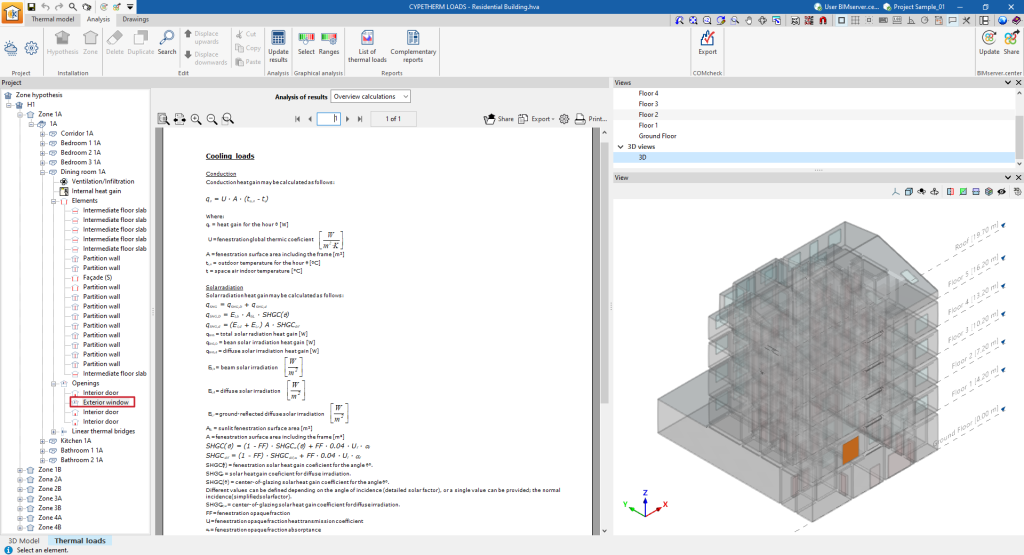
If, after displaying the "Openings" level, a particular gap is selected in the tree, the program displays the "Results analysis" drop-down menu, which allows the following information to be displayed in the central part of the program interface, depending on the selection made:
- Cooling load
Shows the hourly development of the cooling load, total solar irradiation and outdoor temperature for the selected month. - Overview calculations
Displays an informative text with details on the analysis of the cooling loads, including the analysis of the heat gains from conduction and solar radiation, and of the heating loads through the shaft.
Information on linear thermal bridges in the space
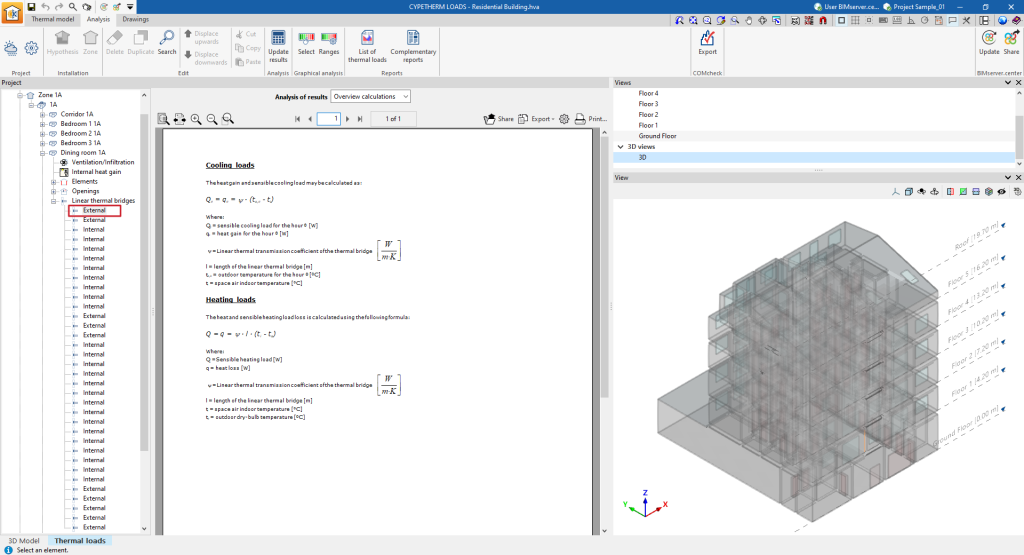
If a space is selected in the tree and then the "Linear thermal bridges" level is selected, the program displays an information text with details on the intervention of linear thermal bridges in the load calculation.
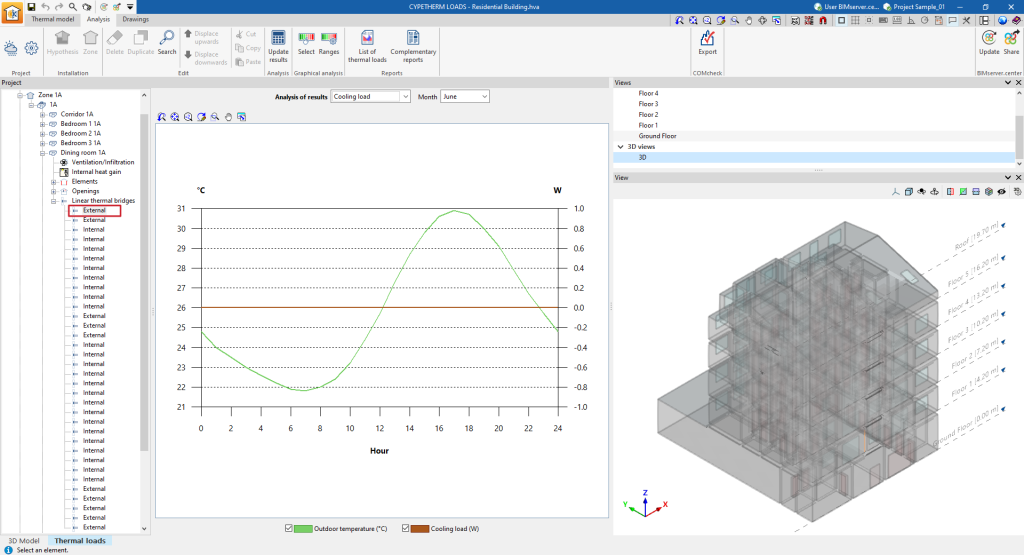
If, after displaying the "Linear thermal bridges" level, a specific linear thermal bridge is selected in the tree, the program displays the "Results analysis" drop-down menu, which allows the following information to be displayed in the central part of the program interface, depending on the selection made:
