Work environment
The CYPETHERM EPlus interface has three tabs at the top of the main window with three different work environments: "Building", "Floor plans" and "Analysis".
"Building" tab
The "Building" tab defines the general parameters, the site data and the building model.
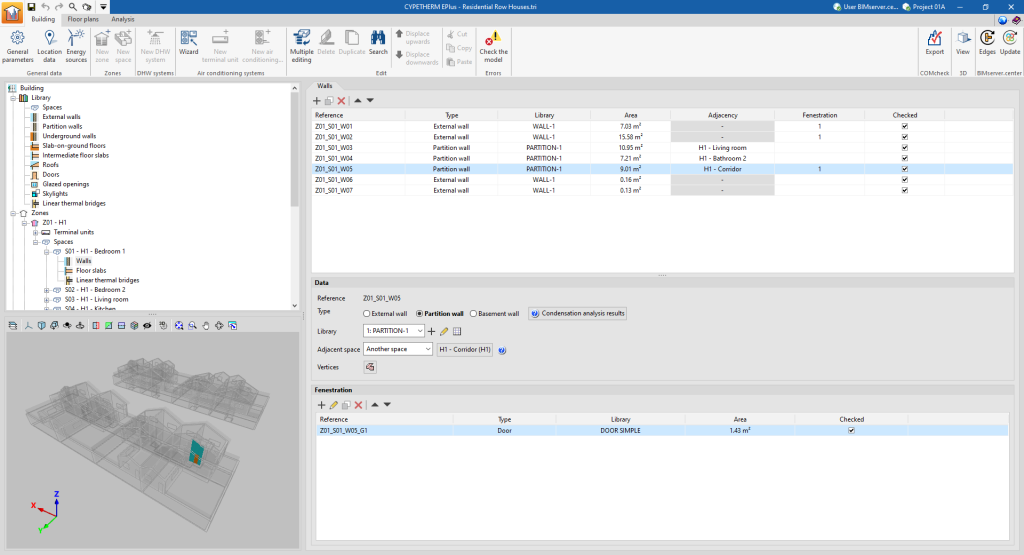
The interface of this tab is structured in the following sections.
- Toolbar. Located at the top and contains the program's main features.
- Tree diagram of the building. Located at the top of the left-hand side and contains the elements that make up the design model.
- Main editing area. Located in the central area on the right and allows users to edit the properties of the selected element in the project tree.
- 3D model viewer. Located at the bottom of the left-hand side, it is used to visualise the position of the selected element in the tree or in the main area in the 3D model.
- Checks viewer. Appears at the bottom of the main editing area and informs of any warnings or errors found at the time the model is checked.
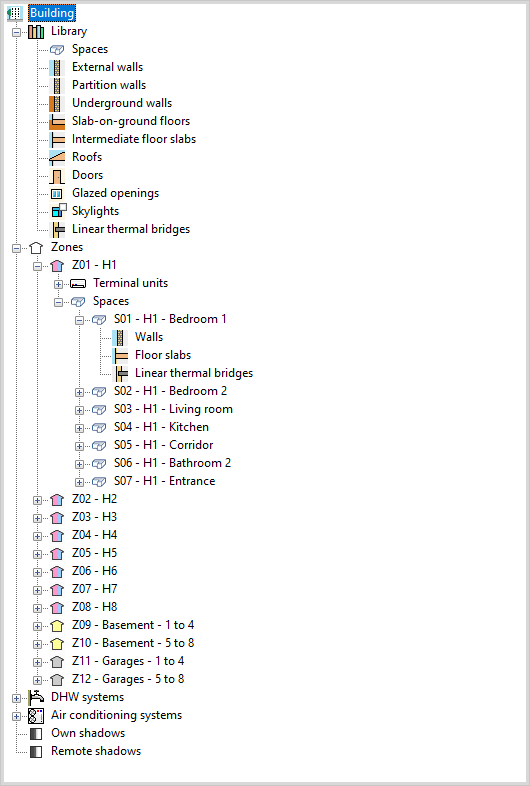
The above diagram contains the building model and consists of the following branches, which can be expanded and collapsed:
- Library. In the library, the types of space and building elements of the job are entered (spaces, partition walls, walls and floors in contact with the ground, slab-on-ground floors, roofs, doors, glazed openings, skylights and linear thermal bridges).
- Zones. In each zone, the spaces within it are entered by defining the walls (façades, party walls, partition walls and basement walls), floor slabs (floor slabs, floor slabs, overhangs and roofs) and linear thermal bridges. The terminal units of the HVAC system or systems covering the spaces in the area are also entered.
- DHW systems. The building systems for the production of domestic hot water (DHW) are defined.
- HVAC systems. The production and distribution subsystems of the heating and/or cooling system(s) of the job are defined.
- Own shadows. The surfaces of the building that do not belong to the spaces but that can cast shadows on façades and roofs, such as, for example, balcony slabs or defences, are defined.
- Remote shadows. The surfaces of remote obstacles that may cast shadows on the building are defined.
"Floor plans" tab
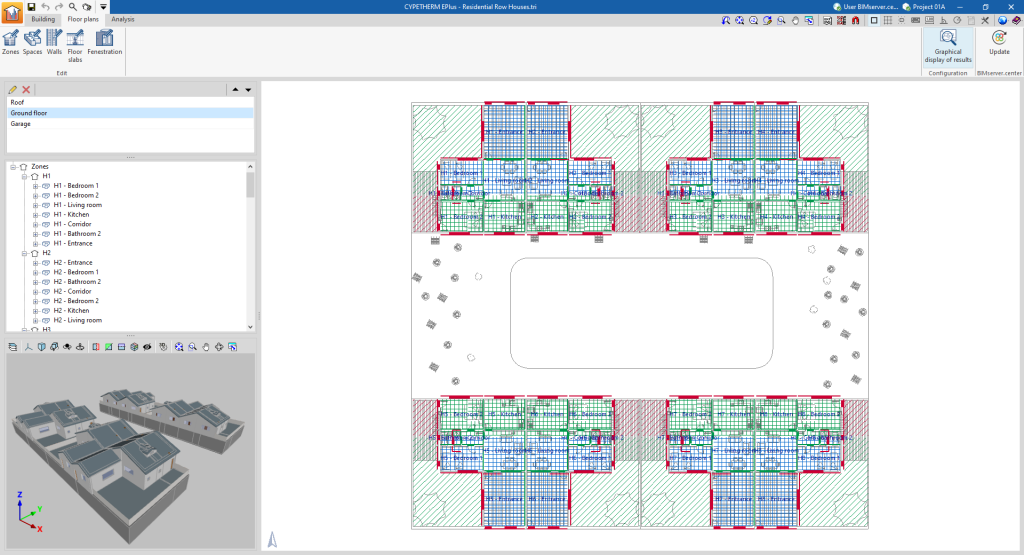
The "Floor plans" tab contains the drawings of each floor in the building, where the building elements are represented.
The interface of this tab is structured in the following sections.
- Toolbar. Located at the top and contains tools for editing the elements of the model and the configuration of the results query.
- Diagram of floor plans of the building. Located at the top of the left side and lists the floor plans available in the building.
- Tree diagram of the building. Located in the central part of the left side and contains a diagram of the elements in the model.
- Main display area. Located in the central area on the right and allows users to view and edit the properties of the elements of the model through a plan view.
- 3D model viewer. Located in the lower part of the left-hand side and allows the position of the selected element in the tree or in the main area to be viewed in the 3D model.
"Analysis" tab
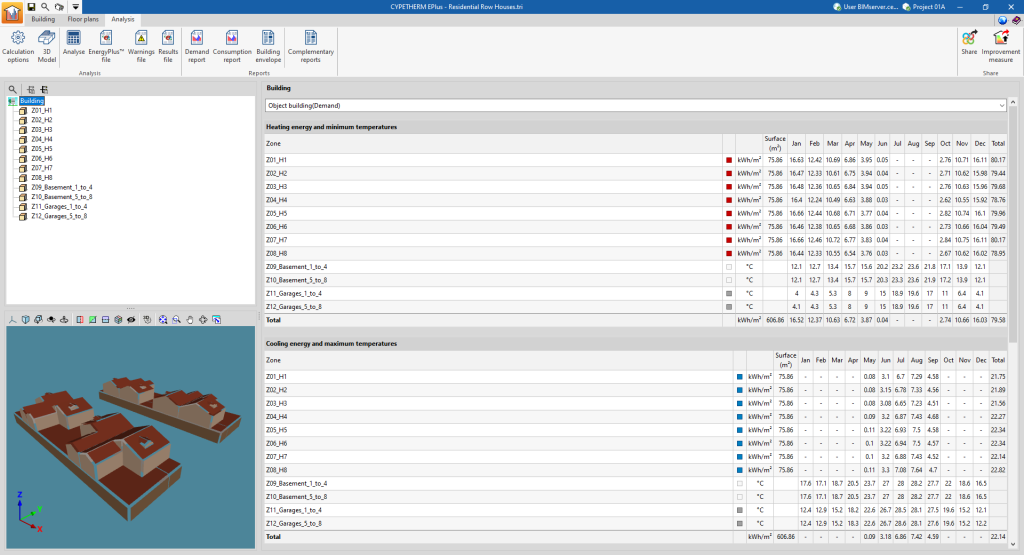
In the "Analysis" tab, the simulation is launched and the analysis results are obtained and displayed.
If the job has not been analysed, a warning will appear on the screen indicating this. Once the job has been analysed, the results of the analysis will be displayed in the main window and the buttons for obtaining the reports will be illuminated.
The interface of this tab is structured in the following sections.
- Toolbar. Located at the top, it contains the utilities that allow users to configure and perform the calculation, as well as to obtain the files and the reports of the results.
- Diagram of the building's thermal zones. Located in the upper part of the left-hand side and shows the building's thermal zones.
- Main results display area. Located in the central area on the right and shows the results of the selected section in the diagram, either the whole building or a thermal zone. It shows the details of the simulation results month by month, according to the selection made in the diagram. The upper drop-down menu allows users to view the results of the different simulations carried out (demand or consumption).
- 3D model viewer. Located at the bottom of the left-hand side and shows the model of the building sent to the analysis engine, also available from the "3D model" option.
