As of the new 2019.a version, CYPEFIRE Sprinklers includes a graphical representation of the data calculated using contour map diagrams on the pipes of the installation.
The representation of the results using contour maps is activated and configured in the program using two options that are included in the “Analysis” menu:
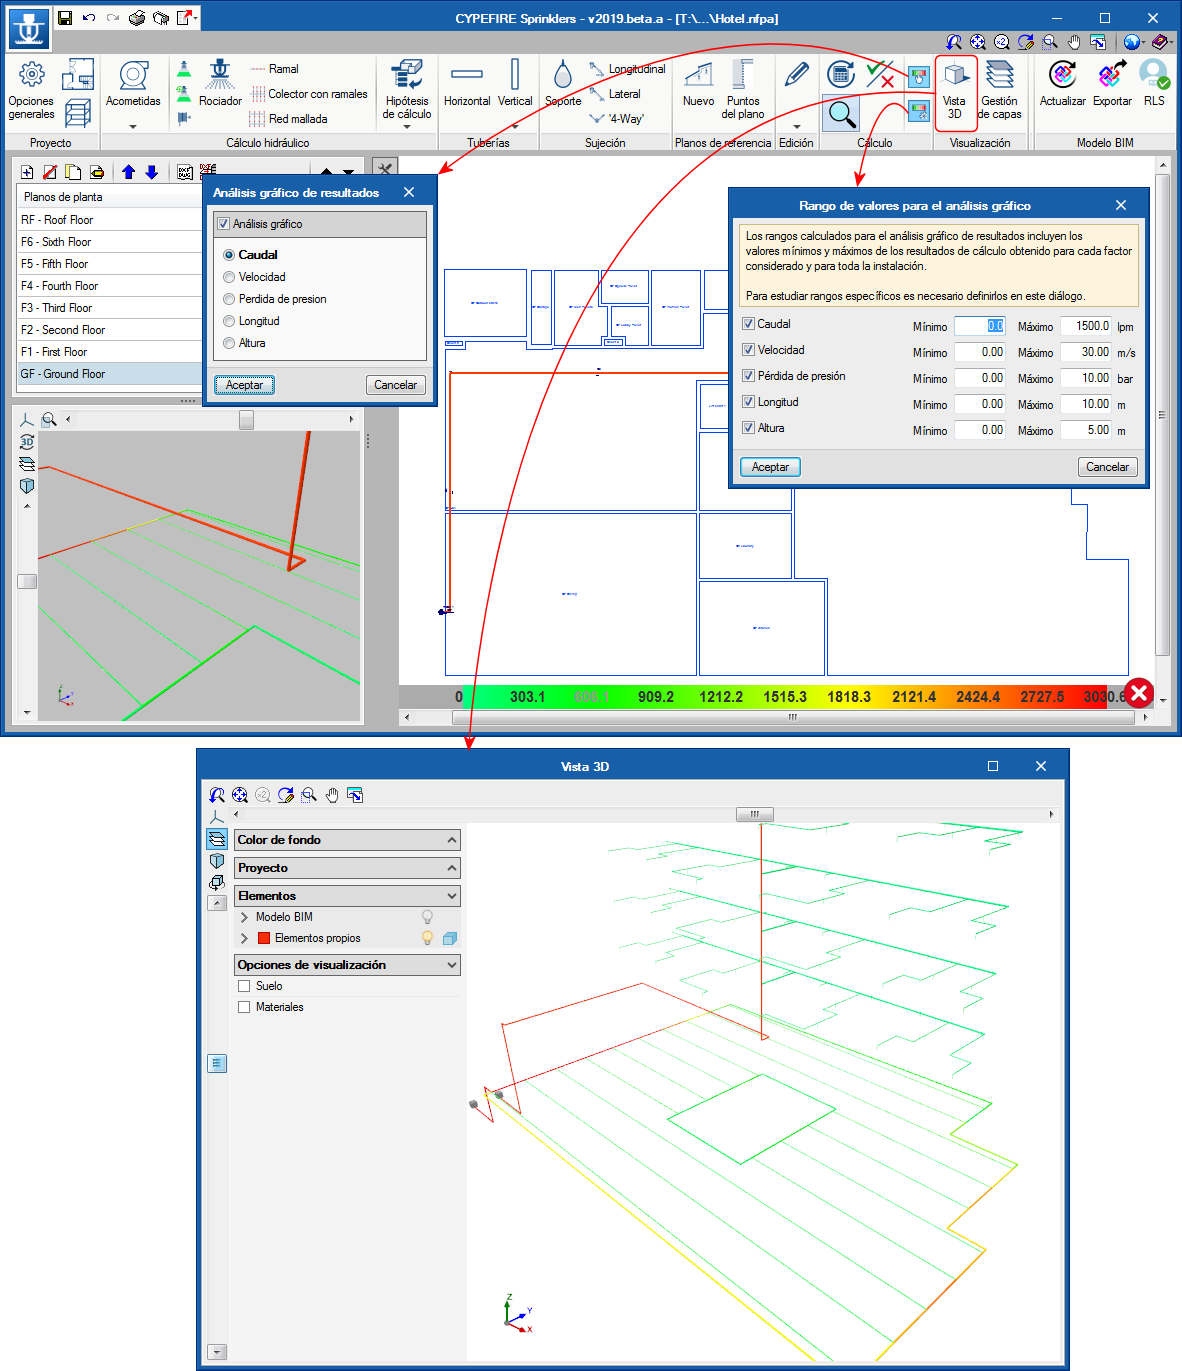
- Graphical analysis of the results
This option activates the graphical representation using contour map values on the sprinkler system, which allows for the following results, which are obtained from the application, to be seen:- Flow
- Velocity
- Pressure loss
- Length
- Height
- Range of results for the graphical analysis
This option allows users to define specific analysis intervals, so the program will only graphically represent the data that lies within each range.
This tool allows users to carry out a quick analysis of the sprinkler installation. For example, it is possible to instantly view where large pressure losses are being produced to design the network.