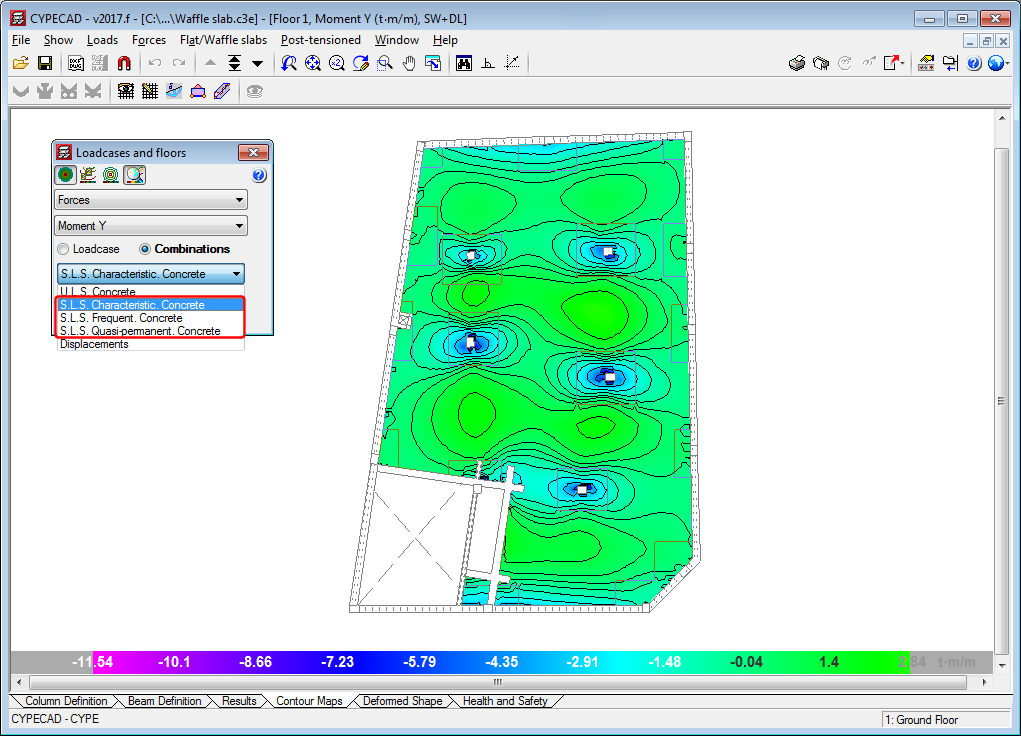
Representation of the S.L.S. of force combinations
As of the 2017.f version, CYPECAD can represent Serviceability Limit State (S.L.S) force combinations in its contour maps.
Contour interval representation
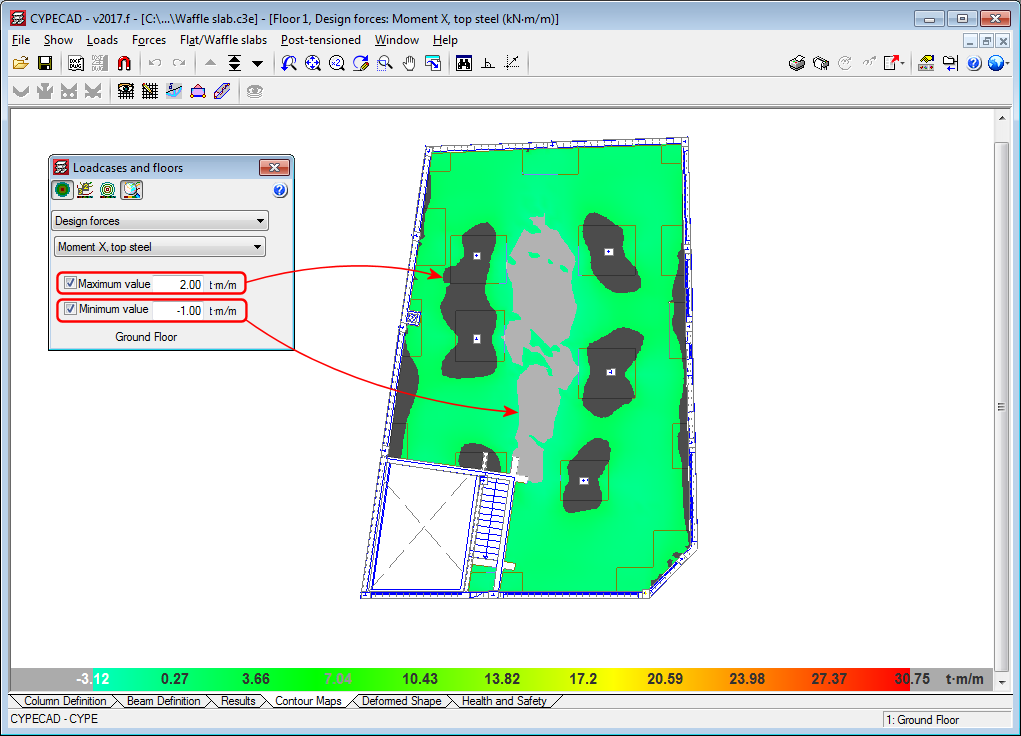
In the contour maps for “Design forces”, “Steel areas” and “Ground bearing pressures”, users can define limits, so zones with values exceeding them are not displayed. In previous versions, zones whose values exceeded the limits were shown in the colour of the limit values. As of the 2017.f version, the zones exceeding the maximum limit are shown in dark grey and the zones below the minimum limit in light grey. This allows users to clearly distinguish the zones exceeding each limit.
Diagram of average values between two points
In previous versions, the “Average values in a strip” diagram (which can be defined in the Contour Maps tab), was not drawn when it passed through contour zones with values exceeding the limits established by users.
As of the 2017.f version, this diagram is also represented when it passes through these zones, which are currently displayed in grey (see previous new feature: “Contour interval representation).


