
Consulting forces in beams, joists, hollow core plates and composite slabs
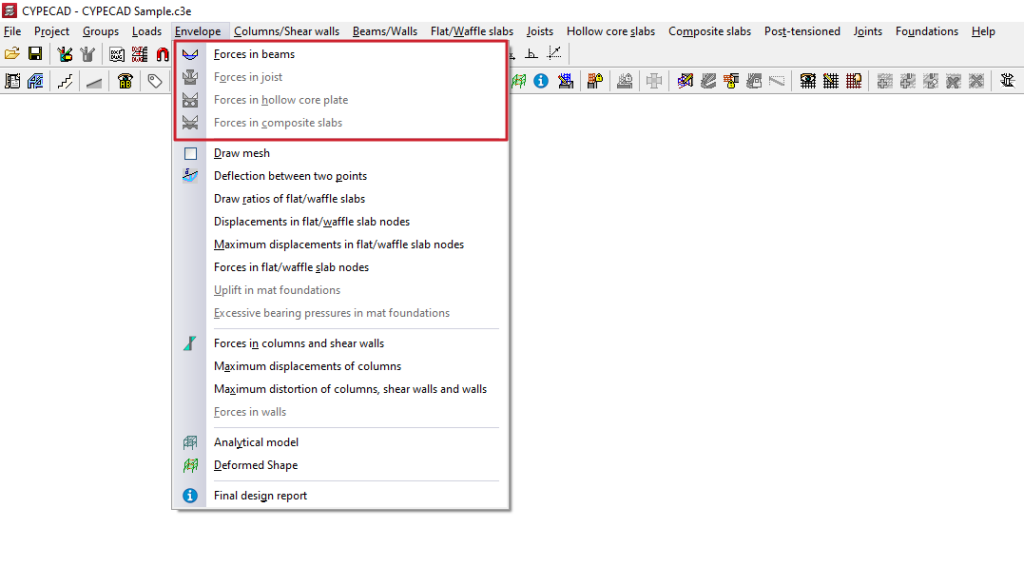
To consult the stress laws for beams, joists, hollow core plates and composite slabs in the program, after analysing the structure, open the "Results" tab and select the desired group. Then click on the "Envelopes" menu at the top of the interface.
The menu options that enable the consultation of the stresses in these elements are as follows:
- Stresses in beams
- Efforts in joists
- Efforts in hollow core plates
- Efforts in composite slabs
Each of these is explained below:
Esfuerzos en vigas
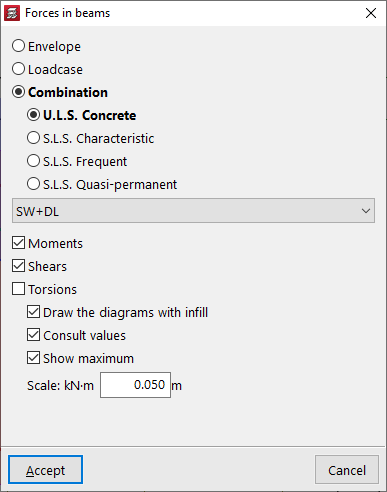
The "Forces in beams" option allows you to view the moments, shear forces, and torsional forces of the beams selected by envelopes, single loadcases, and combinations of single loadcases.
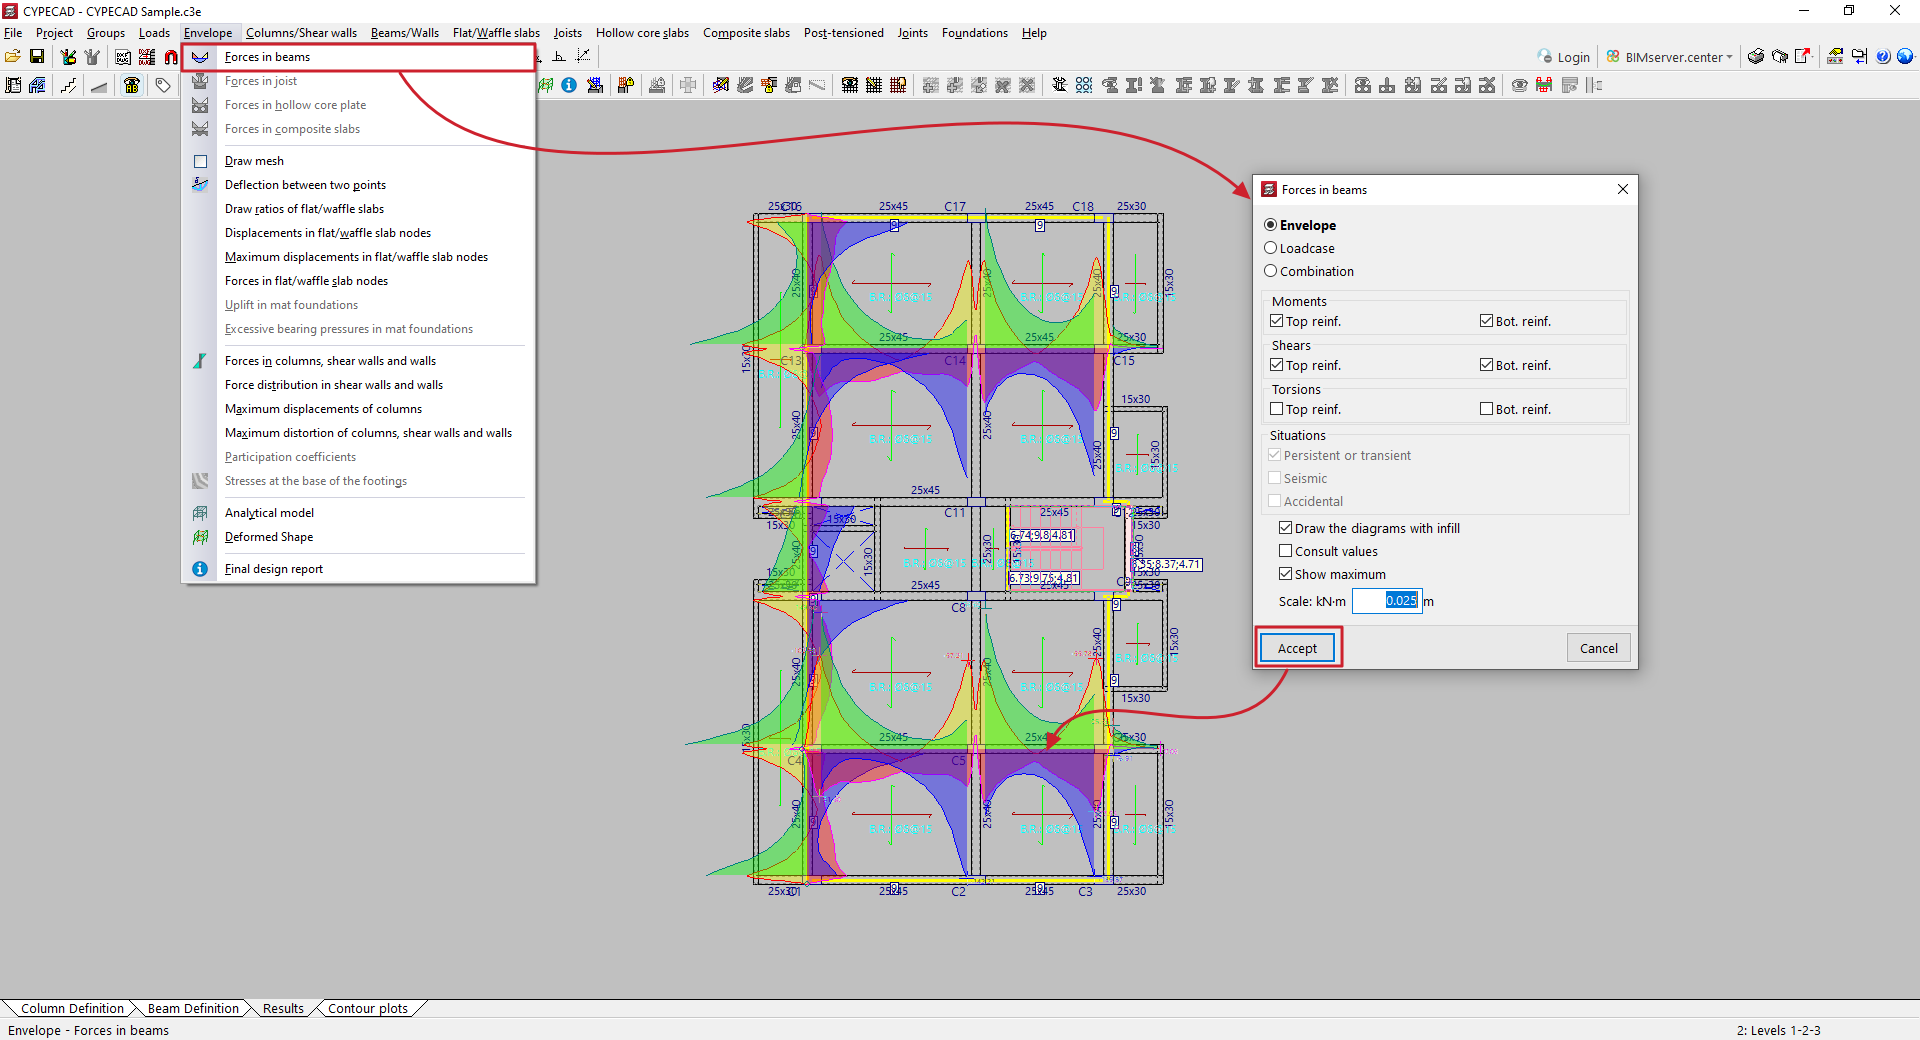
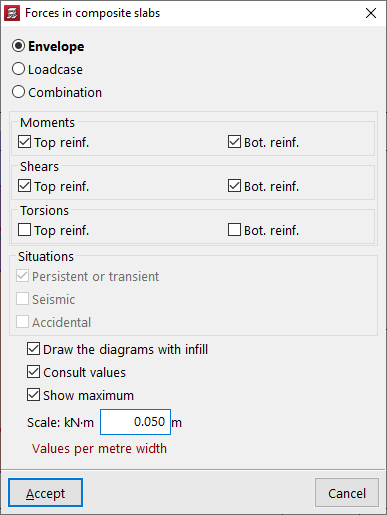
In the window that appears when you click on this option, you can configure the display of forces.
Thus, in the first selector, you indicate whether you wish to display:
- the "Envelopes" of forces, in which case two graphs will appear, corresponding to the upper and lower envelopes;
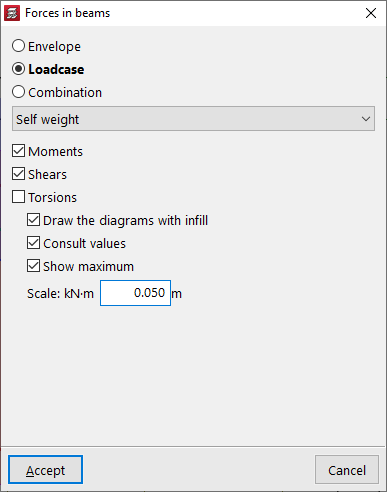
- the efforts associated with a specific simple "Loadcase", which must be selected later from a drop-down menu;
- or the efforts of a specific "Combination" of loadcases, which must also be selected from a drop-down menu from among those available.
Next, tick the boxes for "Moments", "Shears" or "Torsions", depending on the type of forces you wish to consult.
When consulting the stress "Envelopes", you can view the graphs of the stresses used in the dimensioning of the "Negative" and "Positive" reinforcement by ticking the corresponding boxes. By ticking the following boxes, you can also display the stresses corresponding to different design "Situations", whether they are "Persistent or transient", "Seismic" or "Accidental".
At the bottom, the program offers additional options:
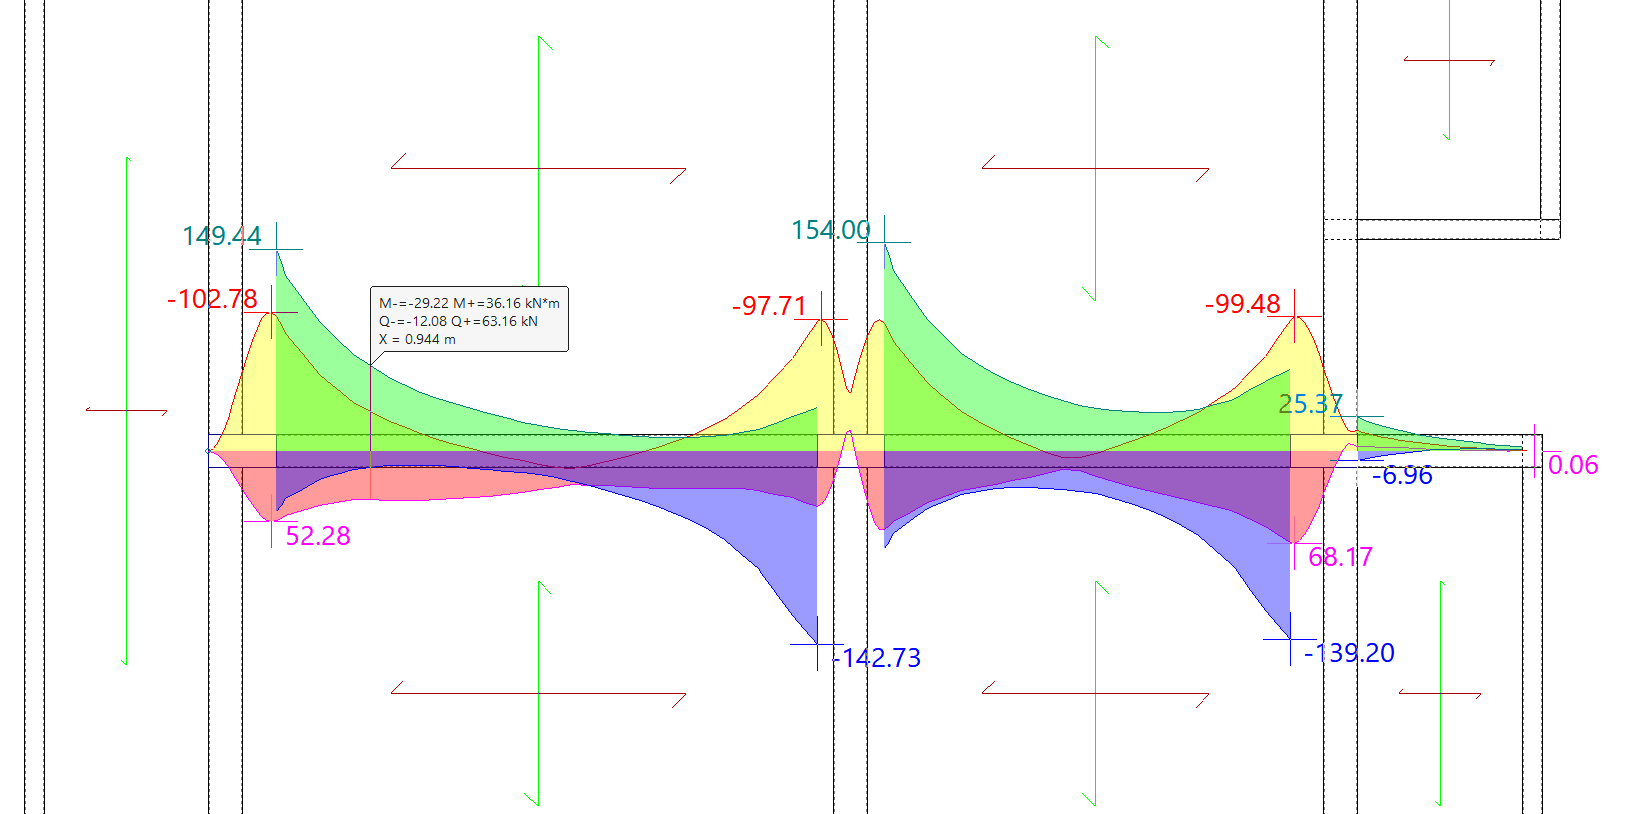
- The "Draw the diagrams with infill" option allows you to represent diagrams with colour fill, which will be different for each type of stress.
- The "Consult values" option allows you to obtain the analytical value of any point by moving the pointer over the graph.
- and the "Show maximum" option allows the maximum positive and negative stresses to be labelled and displayed on screen.
Finally, you can enter a value for "Scale" to control the size of the force diagram on the screen.
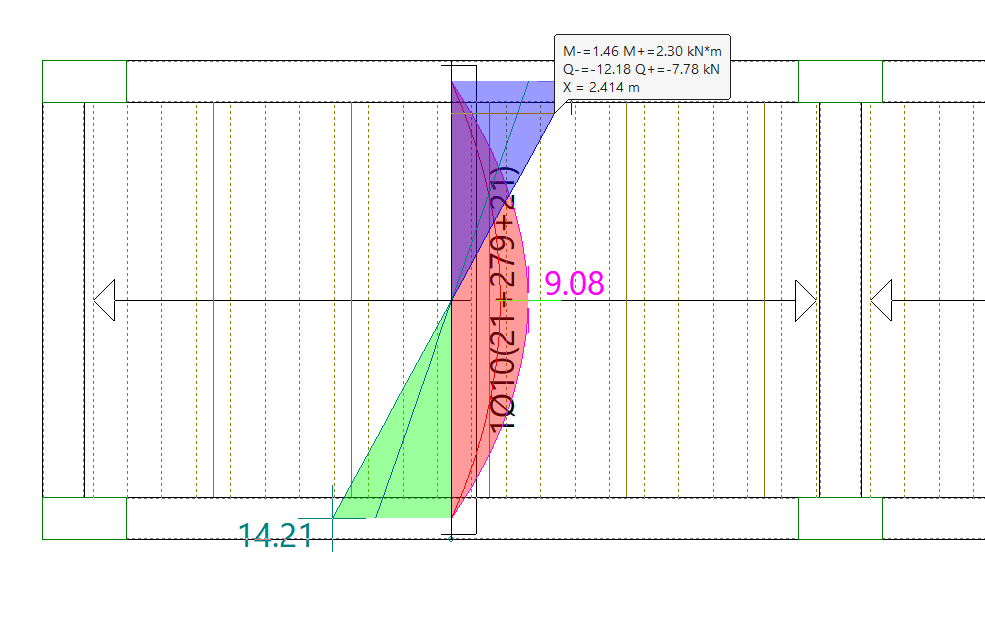
After accepting, click on a portal frame to view the force laws. If the corresponding options have been activated, the values at each point will be displayed by moving the pointer over them, and the maximum values will be labelled on the screen.
Right-clicking returns you to the previous window, where you can modify the selection of options to consult other types of forces.
Forces in joists
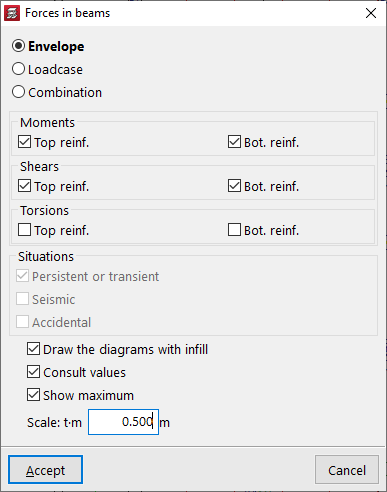
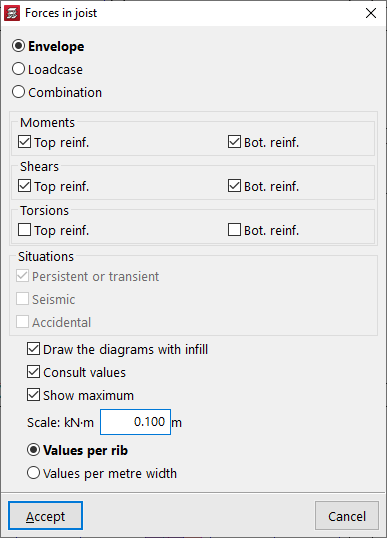
To view the "Forces in joists", you can view the moments, shear forces and torsional forces of the selected joists by envelopes, simple loadcases and combinations of simple loadcases.
In this case, it is possible to view the "Values per rib" or the "Values per metre width". This can be selected at the bottom of the pop-up window that appears when you click on the option.
The remaining options are equivalent to those described for checking stresses in beams.
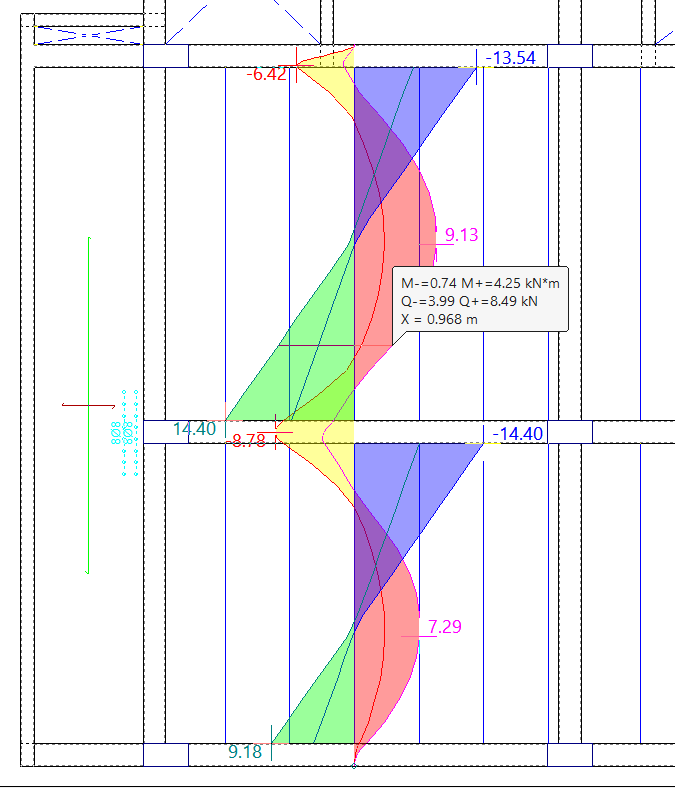
After accepting, click on each of the joists to view the forces.
Forces in lightweight slabs and composite slabs
The options "Forces in lightweight slabs" and "Forces in composite slabs" allow you to view the moments, shear forces and torsional forces of the lightweight slabs or composite slabs selected by envelopes, simple loadcases and combinations of simple loadcases.
In these two cases, the "Values per metre width" are always shown. This provides the force graph for each discretised band of this width in this type of floor slab.
The remaining options are equivalent to those described for checking forces in beams.
To view the forces in this type of slab, click on any point on the slab. The program will display the force diagram located at the centre of the slab.
Consulting quantities, displacements and forces in flat and waffle slabs
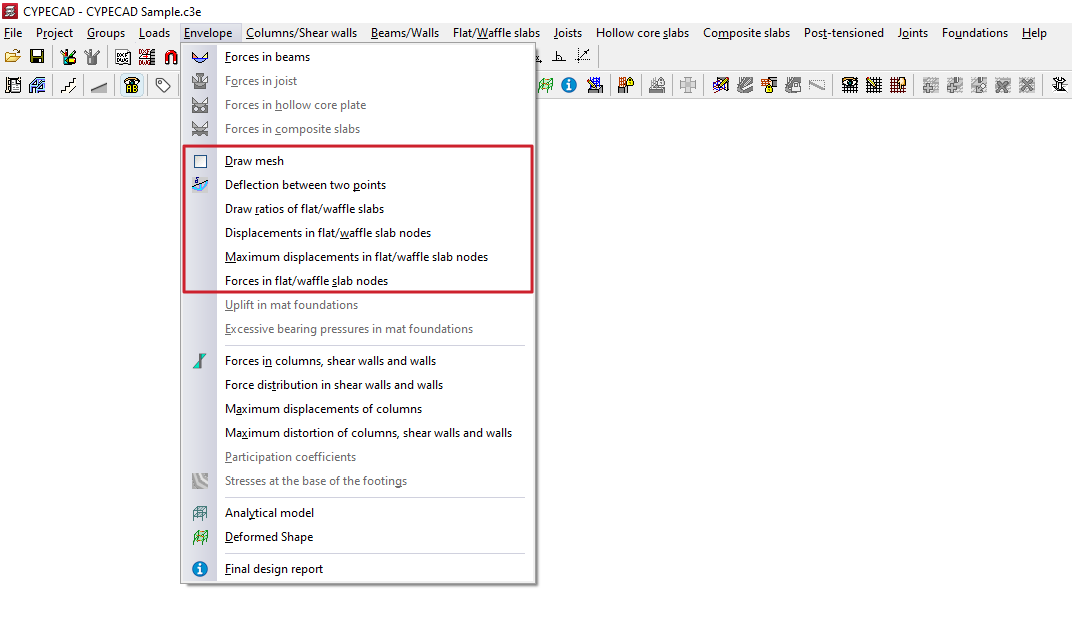
To consult the quantities, displacements and forces at nodes of slabs and waffle slabs in CYPECAD, as well as the generated mesh and the deflection between two points, after calculating the project it is necessary to open the "Results" tab and position yourself in the desired group. Then click on the "Envelopes" menu at the top of the interface.
The menu options that allow the above information to be consulted are as follows:
- Draw mesh
- Deflection between two points
- Draw ratios of the flat/waffle slabs
- Displacements at slab/waffle slab nodes
- Maximum displacements at flat/waffle slab nodes
- Forces in flat/waffle slab nodes
Each of these features is detailed below.
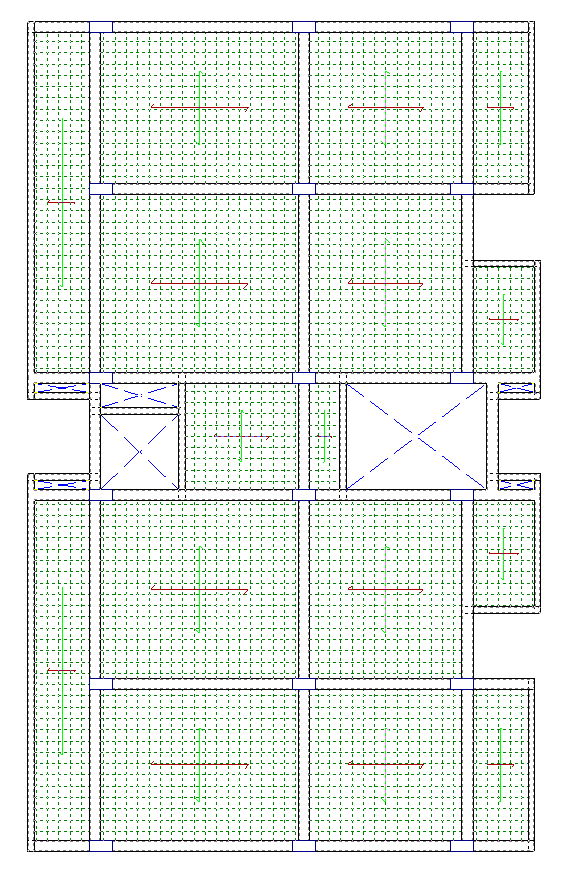
Draw mesh
The "Draw mesh" option allows the generated mesh in flat or waffle slab panels to be consulted by displaying it on screen.
| Note: |
|---|
| In the case of waffle slabs, the mesh spacing is one third of the centre-to-centre distance. In the case of slabs, the mesh is generated every 25 centimetres. |
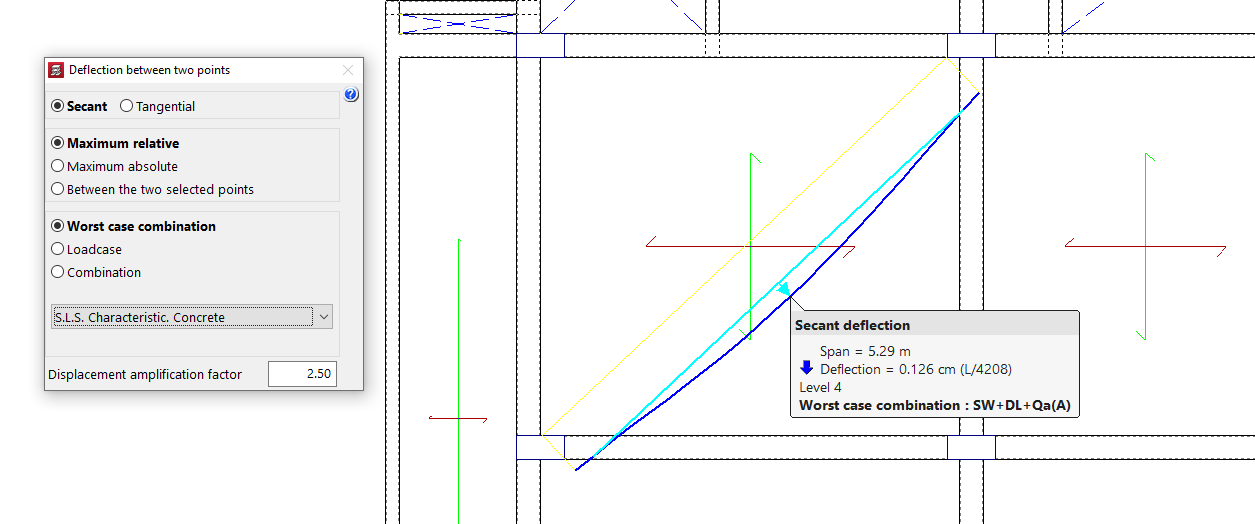
Deflection between two points
The "Deflection between two points" of the slab or bidirectional slab can be consulted using this menu option, as well as from the "Contour plots" tab.
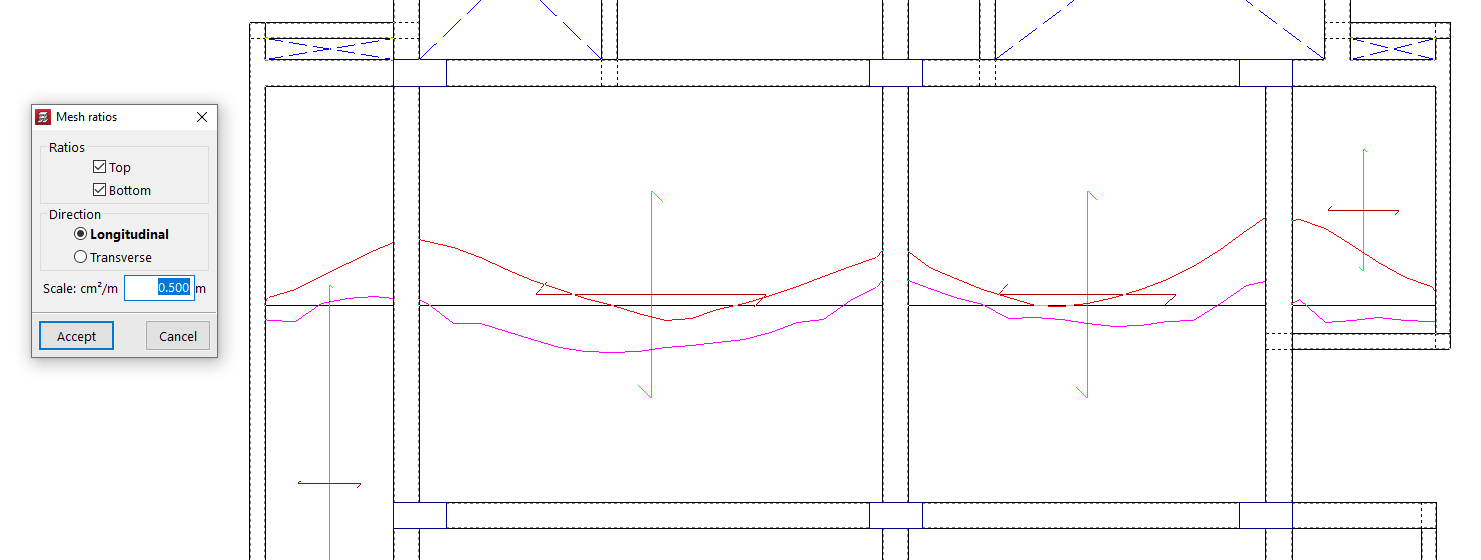
Draw ratios of the flatslab/waffle slabs
With the "Draw ratios of the flat/waffle slabs" option, the mechanical reinforcement ratios of each mesh alignment are displayed.
The program allows selection of the "Quantities" "Top" and "Bottom" in the "Longitudinal" or "Transverse" direction, as well as entering the value of the display "Scale".
After accepting, click on a point of a panel so that the quantity diagram of the alignment passing through it is displayed. By clicking on additional points, the quantity diagrams of other alignments can be made visible. Each diagram can be clicked to remove its display from the screen.
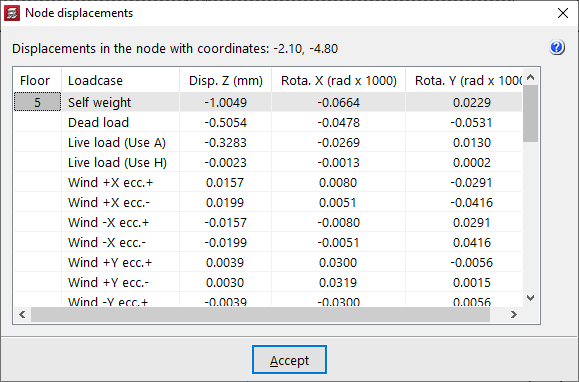
Displacements at slab/waffle slab nodes
Using "Displacements at slab/waffle slab nodes", it is possible to consult Z displacements and rotations about X and Y, by simple load cases, at any node of the mesh of a slab or waffle slab.
When moving the pointer over the different mesh nodes, their coordinates are also indicated.
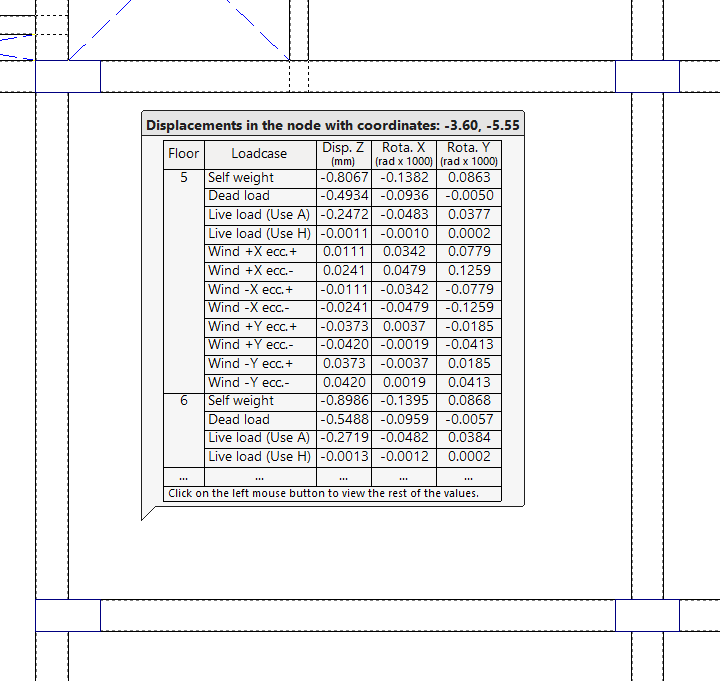
By clicking with the left mouse button, the "Node displacements" window opens, showing all the values for the node at those coordinates.
If there is more than one storey per group, the results for each storey are shown.
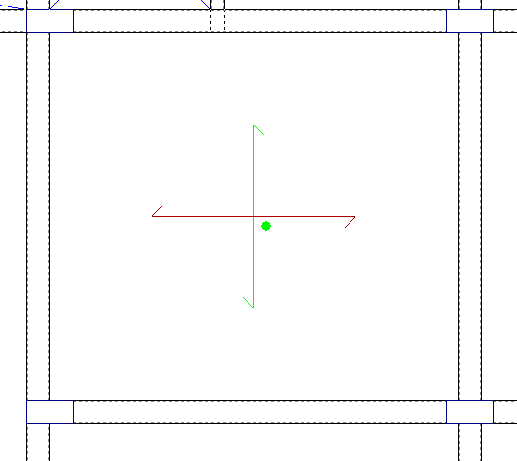
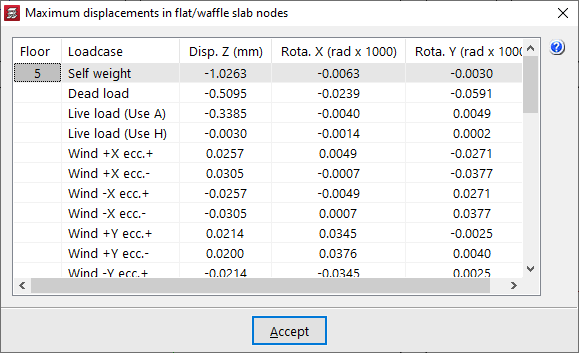
Maximum displacements at slab/waffle slab nodes
From "Maximum displacements at slab/waffle slab nodes", the maximum Z displacements and the maximum rotations about X and Y, by simple load cases, are displayed for each slab or waffle slab panel.
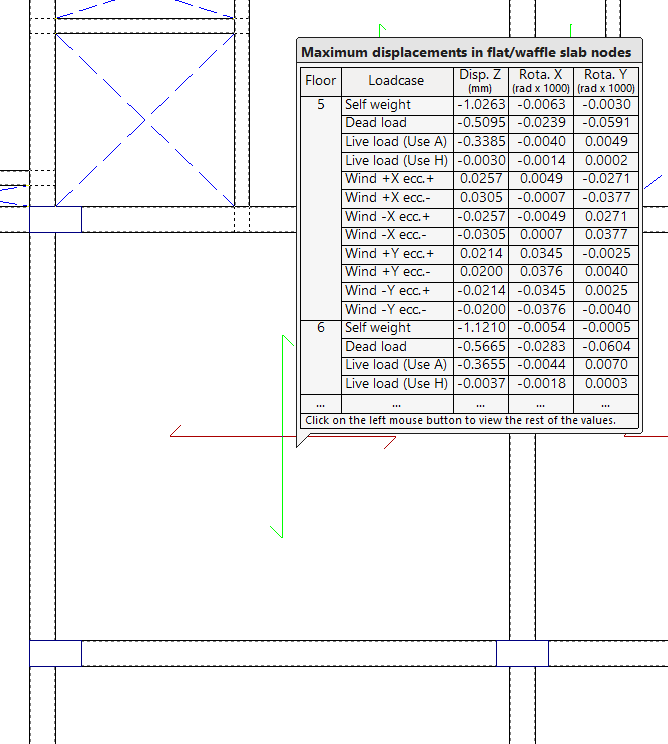
When clicking on each panel, a green circle appears indicating the position of the point of maximum displacement, together with a window showing the information on maximum displacements by load case.
Forces in flat/waffle slab nodes
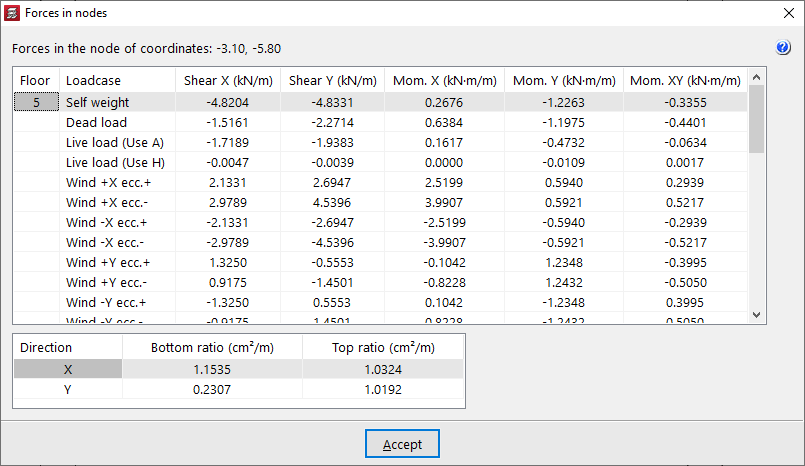
The "Forces in flat/waffle slab nodes" option allows the forces by simple load cases and the reinforcement ratios at any node of the mesh of a flat or waffle slab to be consulted.
When moving the pointer over the slab panel, the shear forces and bending moments per metre width of slab are shown, together with the values of "Bottom quantity" and "Top quantity" in both directions (X and Y) at the node indicated on screen, whose coordinates are also displayed.
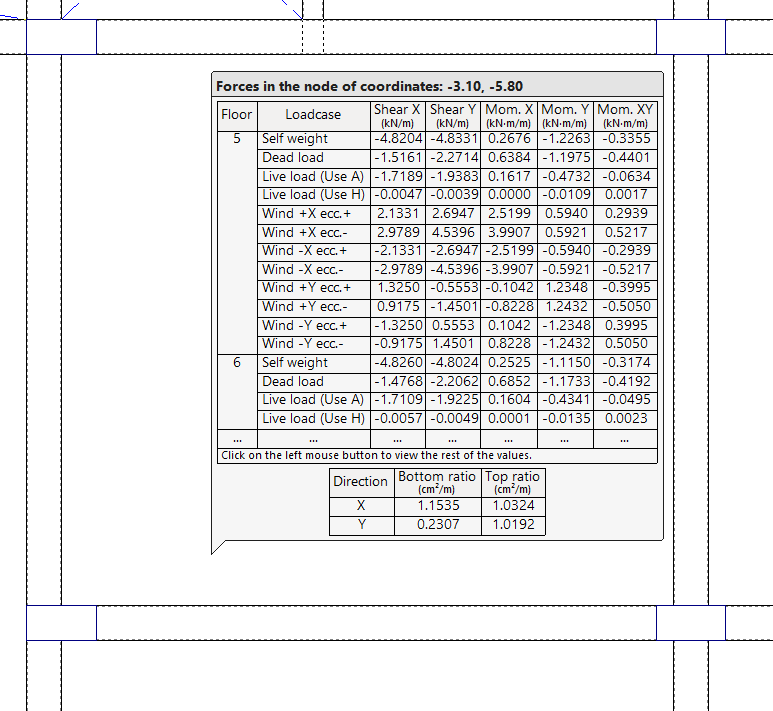
By clicking the left mouse button, a table with all the information described is obtained.
If there is more than one storey per group, the results for each storey are shown.
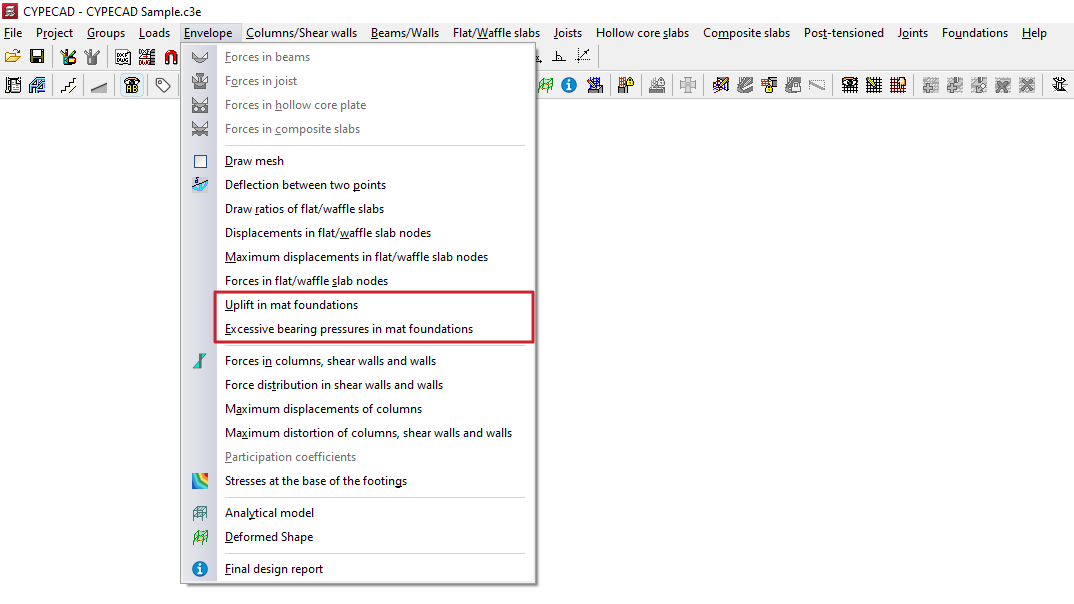
Uplifts and excessive bearing pressures in mat foundations
To check for lifts and excessive stresses in foundation slabs, after analysing the structure, open the "Results" tab and select the desired group. Then open the "Envelopes" menu at the top of the interface.
The menu options that allow you to view the aforementioned information are as follows:
- Uplift in mat foundations
- Excessive bearing pressures in mat foundations
Each of these features is detailed below.
Uplift in mat foundations
This option provides information about "Uplifts in mat foundations", if applicable.
If there has been no lifting at any point on the slabs in the group, this is indicated by a warning.
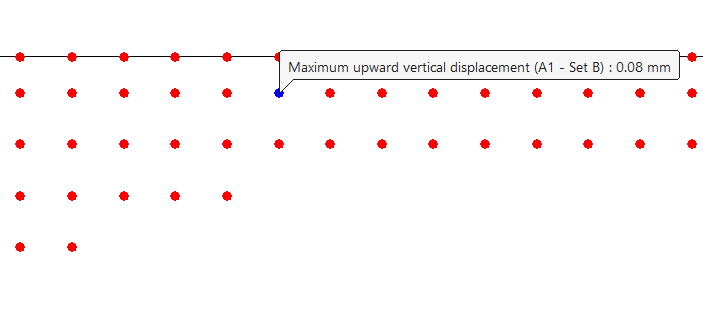
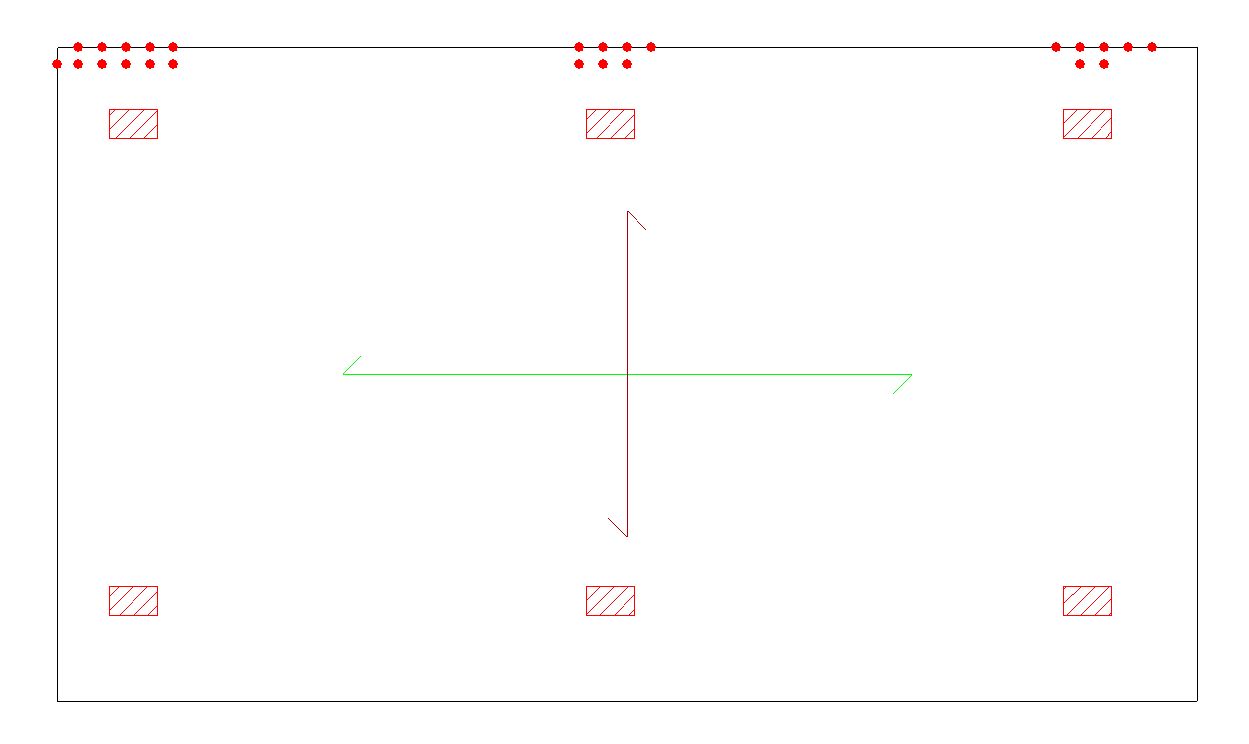
In the event of uplifts, the points on the mesh that have this problem in any combination of scenarios will be marked with red circles.
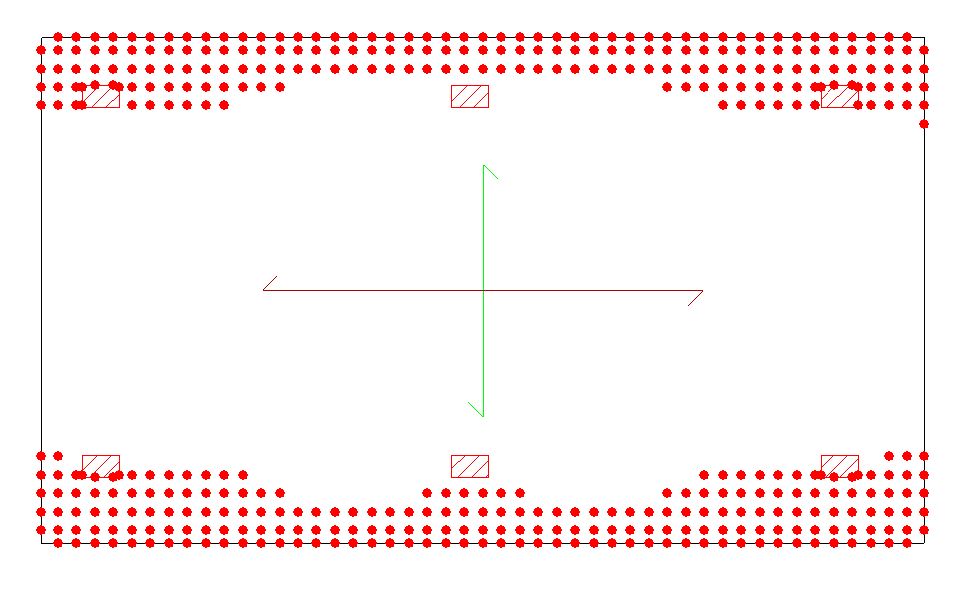
To find out the uplift value, click on them to display the value of "Maximum upward vertical displacement".
| Note: |
|---|
| In the analysis performed by the program, the slab is discretised in the form of a grid, which is solved using matrix methods. A spring is placed at the intersection nodes of the grid bars, whose constant is the product of the ballast coefficient and its area of influence or tributary. If detachments occur, the springs that link the mesh nodes to the ground in the model would be acting in tension. As the ground cannot work under tension in these cases, if this circumstance occurs, the calculation result is inaccurate, so it is necessary to avoid the existence of detachments. To do this, weight can be added to the slab or the distribution of loads on the ground can be modified, increasing the depth of the slab to make it more rigid or by redesigning the structure. |
Excessive bearing pressures in mat foundations
This option allows you to consult the "Excessive bearing pressures in mat foundations".
If the permissible stress of the ground has not been exceeded at any point on the slabs in the group, this is indicated by a warning.
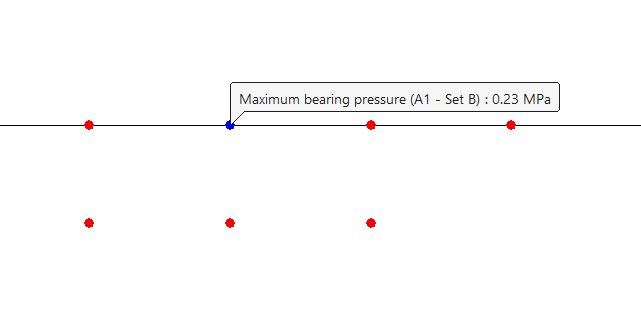
In the event of excessive tension, the points affected by this problem are marked with red circles.
To find out the value of the "Maximum bearing pressure" at a specific point on the foundation slab, click on that point.
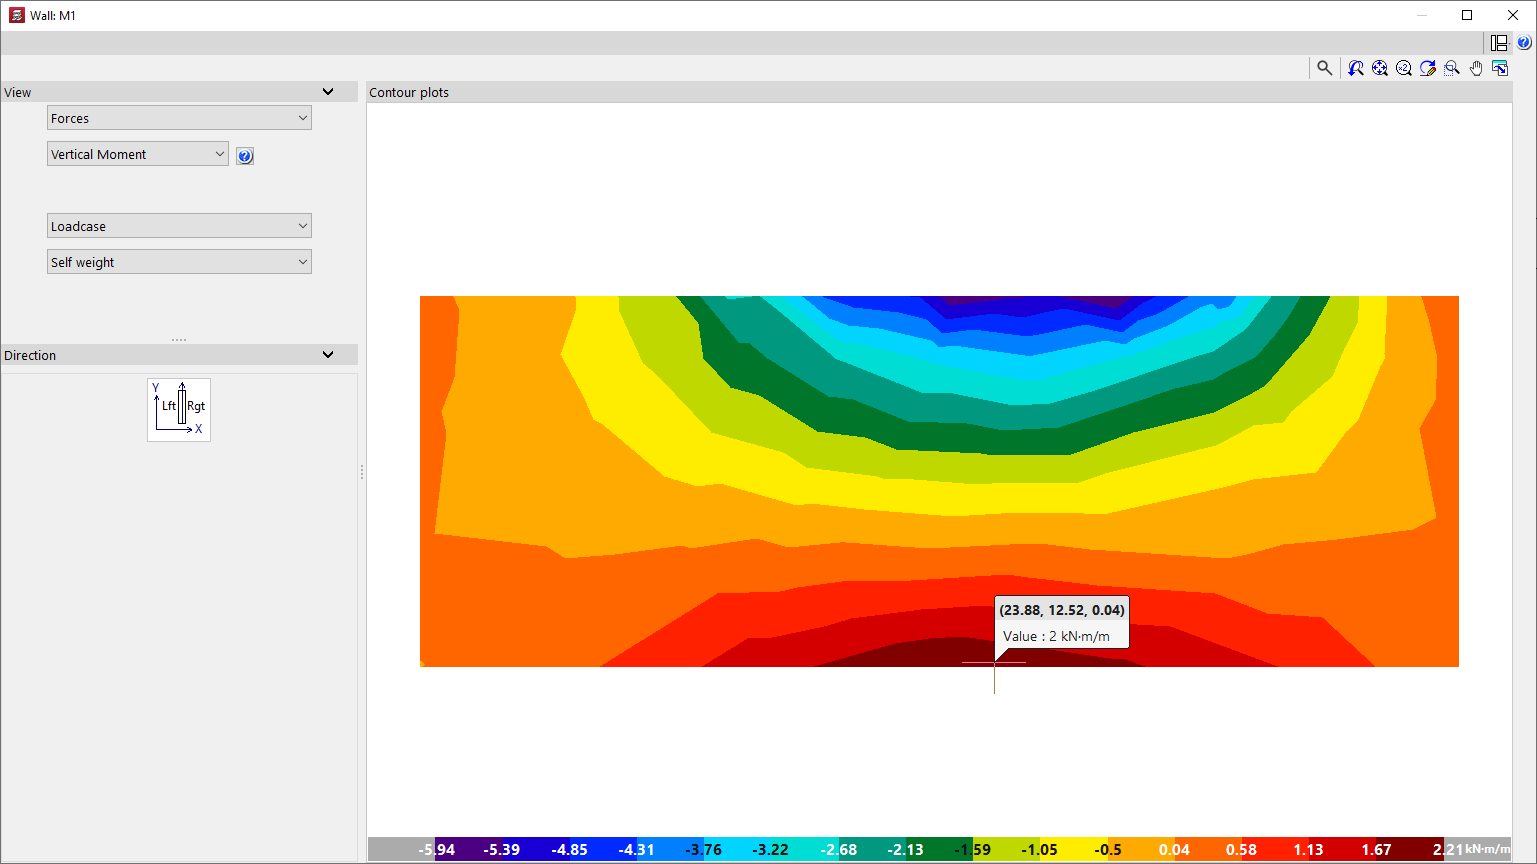
Forces in columns, shear walls and walls
To view the forces in columns, shear walls and/or walls in CYPECAD, after analysing the structure, open the "Results" tab and go to a group where any of these elements are visible.
Next, open the "Envelope" menu at the top of the interface.
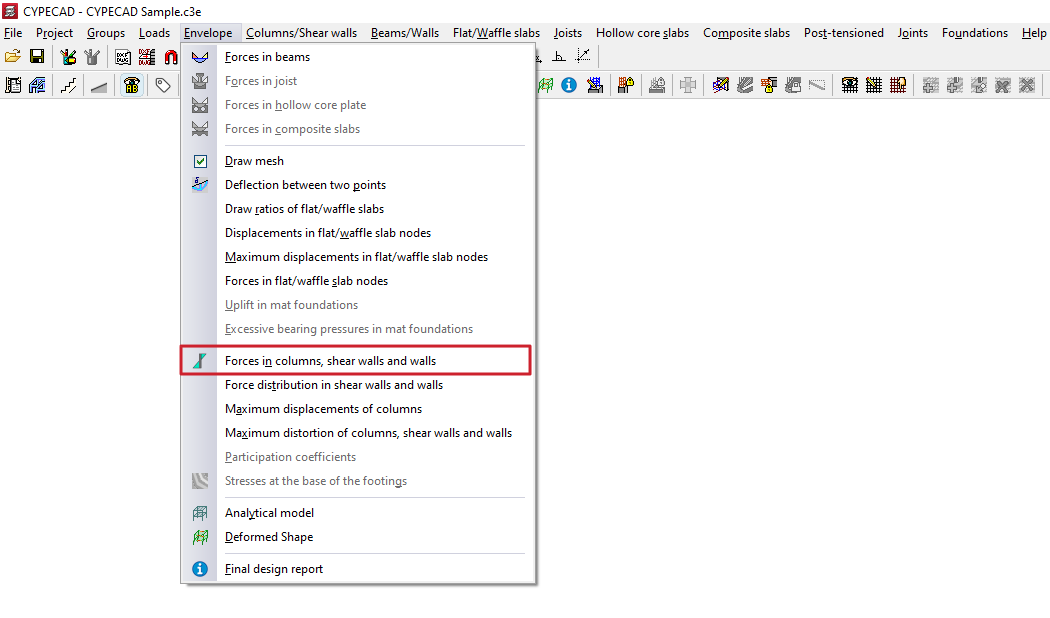
Forces in columns, shear walls and walls
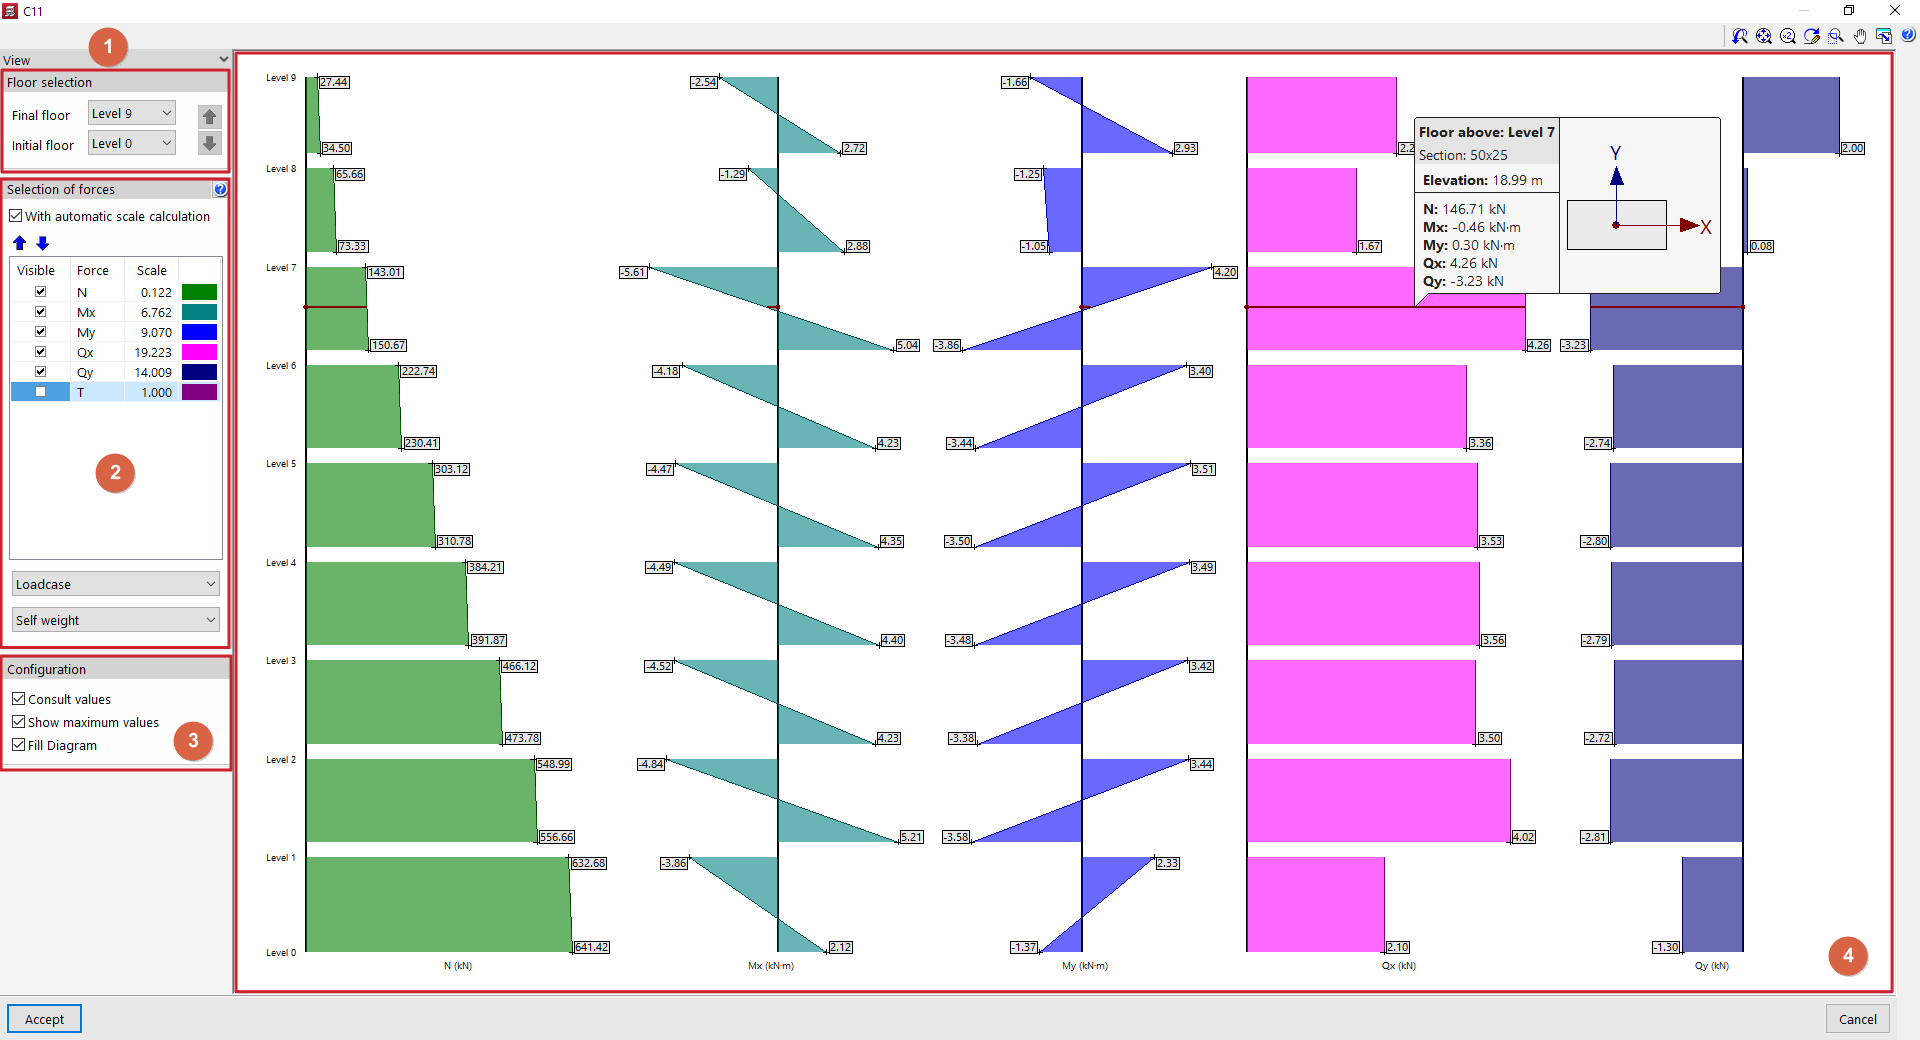
Selecting the "Forces in columns, shear walls and walls" option and clicking on a column or wall opens a window where you can view their stress laws for simple loadcases or combinations of loadcases. In the case of diagrams, click on the segment of the diagram you wish to view.
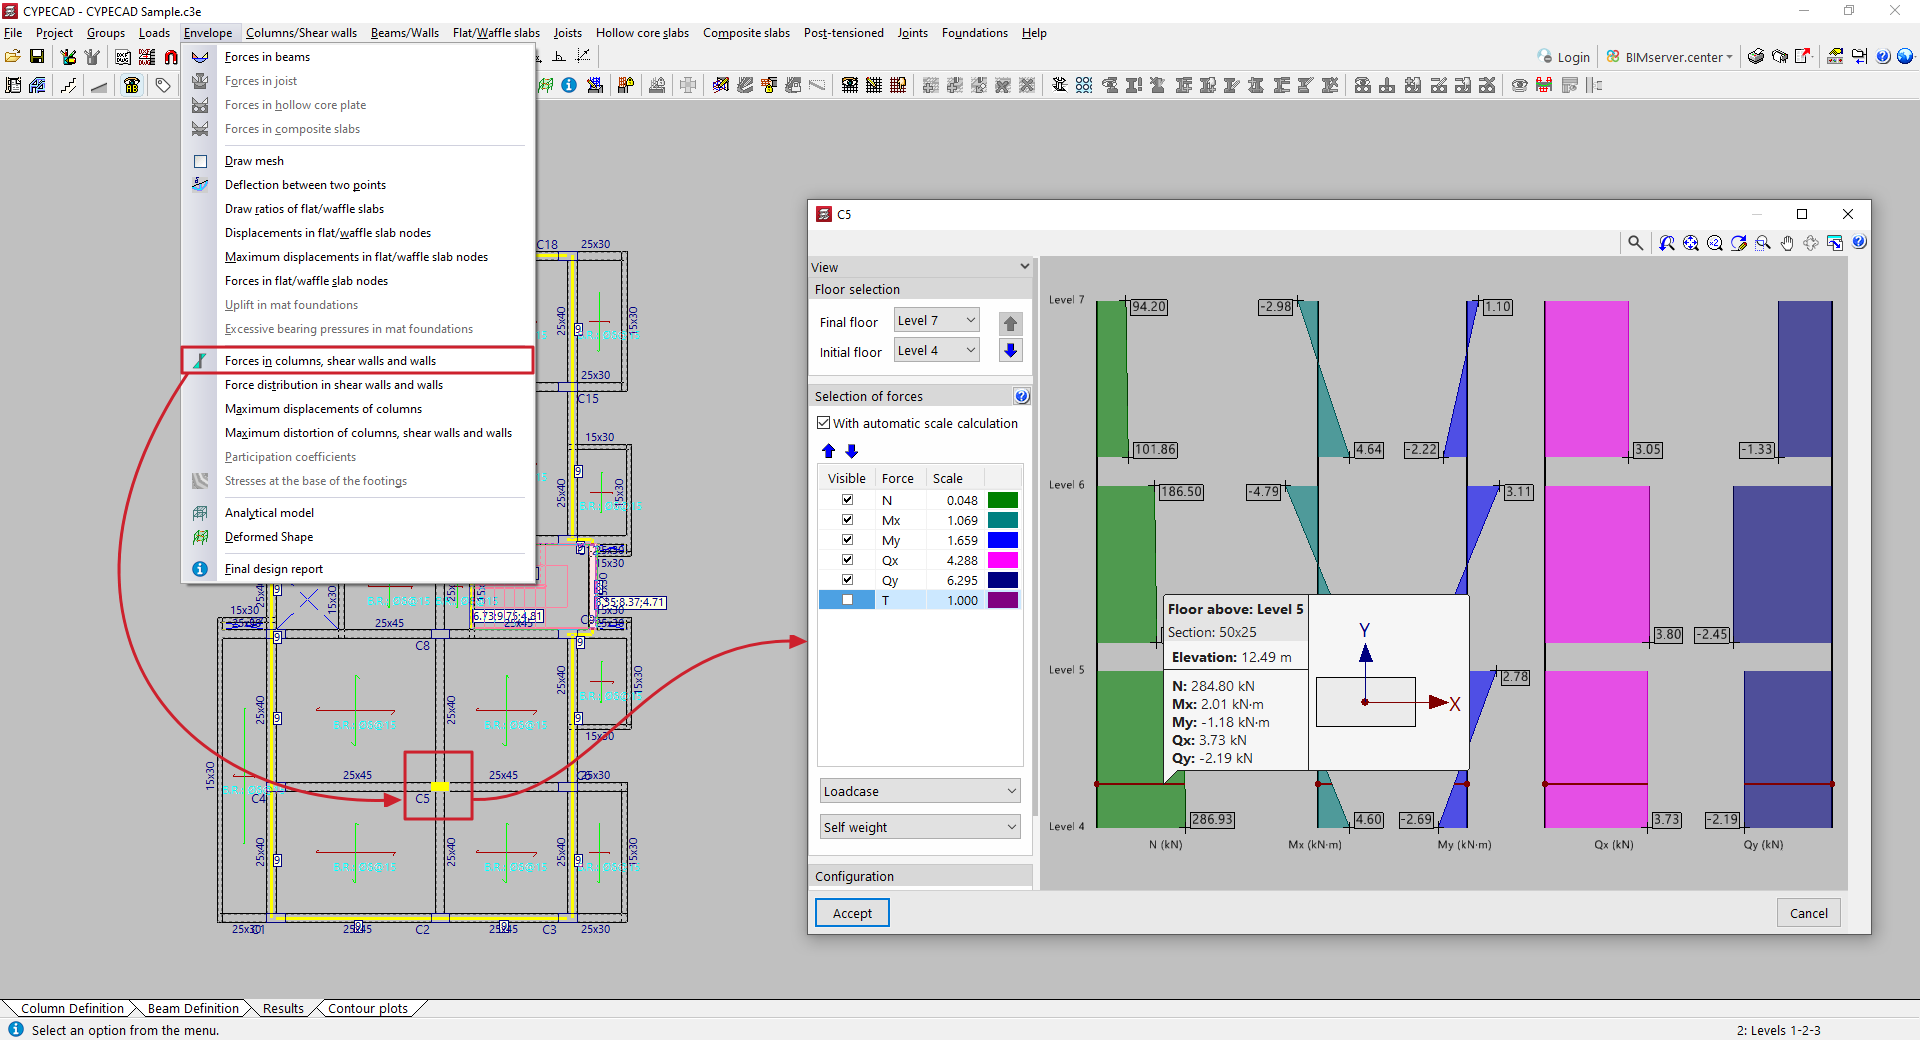
In the pop-up window, the following configuration options appear in the "Views" section on the left-hand side:
- In "Floor selection" (1), you can select the floors to be displayed by indicating the "Final floor" and the "Initial floor". The blue arrows allow you to scroll between floor sections.
- Next, in the "Selection of forces" section (2), it indicates for each stress whether it is "Visible" or not, along with its "Scale" factor and colour. If "With automatic scale calculation" is enabled, the program will adjust the size of the stress laws to the visible area on the screen, forcing the scale factor. The following can be included:
- the axil (N);
- the moments in both directions (Mx, My);
- the cutting edges in both directions (Qx, Qy);
- and the torsion (T).
- In the drop-down menus at the bottom of the "Selection of forces" section, select the "Loadcase" or "Combination" you wish to consult.
- Finally, within the "Configuration" section (3), the following options can be enabled:
- "Consult values", to display an information box when hovering over the stress laws;
- "Show maximum values", to make the values visible in each section;
- and "Fill Diagram", so that the stress laws are represented filled with a different colour.
In the viewer (4) on the right-hand side, hover the pointer over the stress laws for the column, screen or wall so that the program displays the floor plan, section, elevation and stresses in the same, as well as a diagram of the element in plan view showing its local axes.
The stresses in X are those contained in the local XZ plane of the element, and similarly, the stresses in Y are those contained in the local YZ plane.
Force distribution in shear walls and walls
To view the force distribution in slabs and walls in CYPECAD, once the structure has been analysed, open the "Results" tab and navigate to a group where the wall you wish to view is visible. Then, open the "Envelopes" menu at the top of the interface.
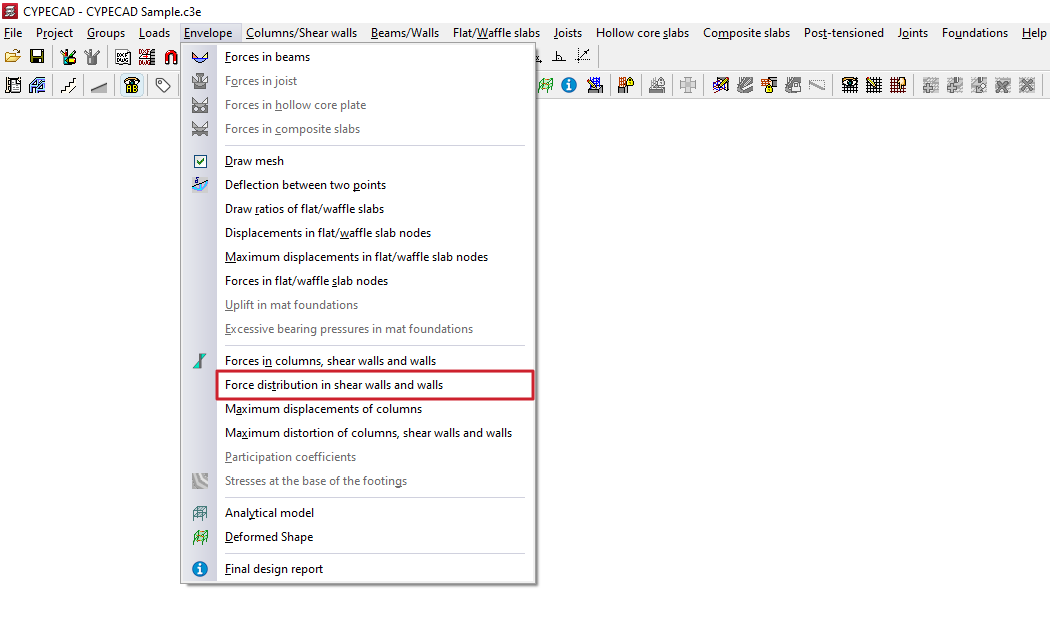
Force distribution in shear walls and walls
By selecting the "Force distribution in shear walls and walls" option and clicking on a wall section or a segment of a shear wall, you can view the results for that section in a pop-up window.
In the results viewer, the "View" section in the top-left corner is used to select the display type, whether it be "Discretisation", "Displacements", "Forces", "Stresses" or "Main stresses". Each of these options is explained below.
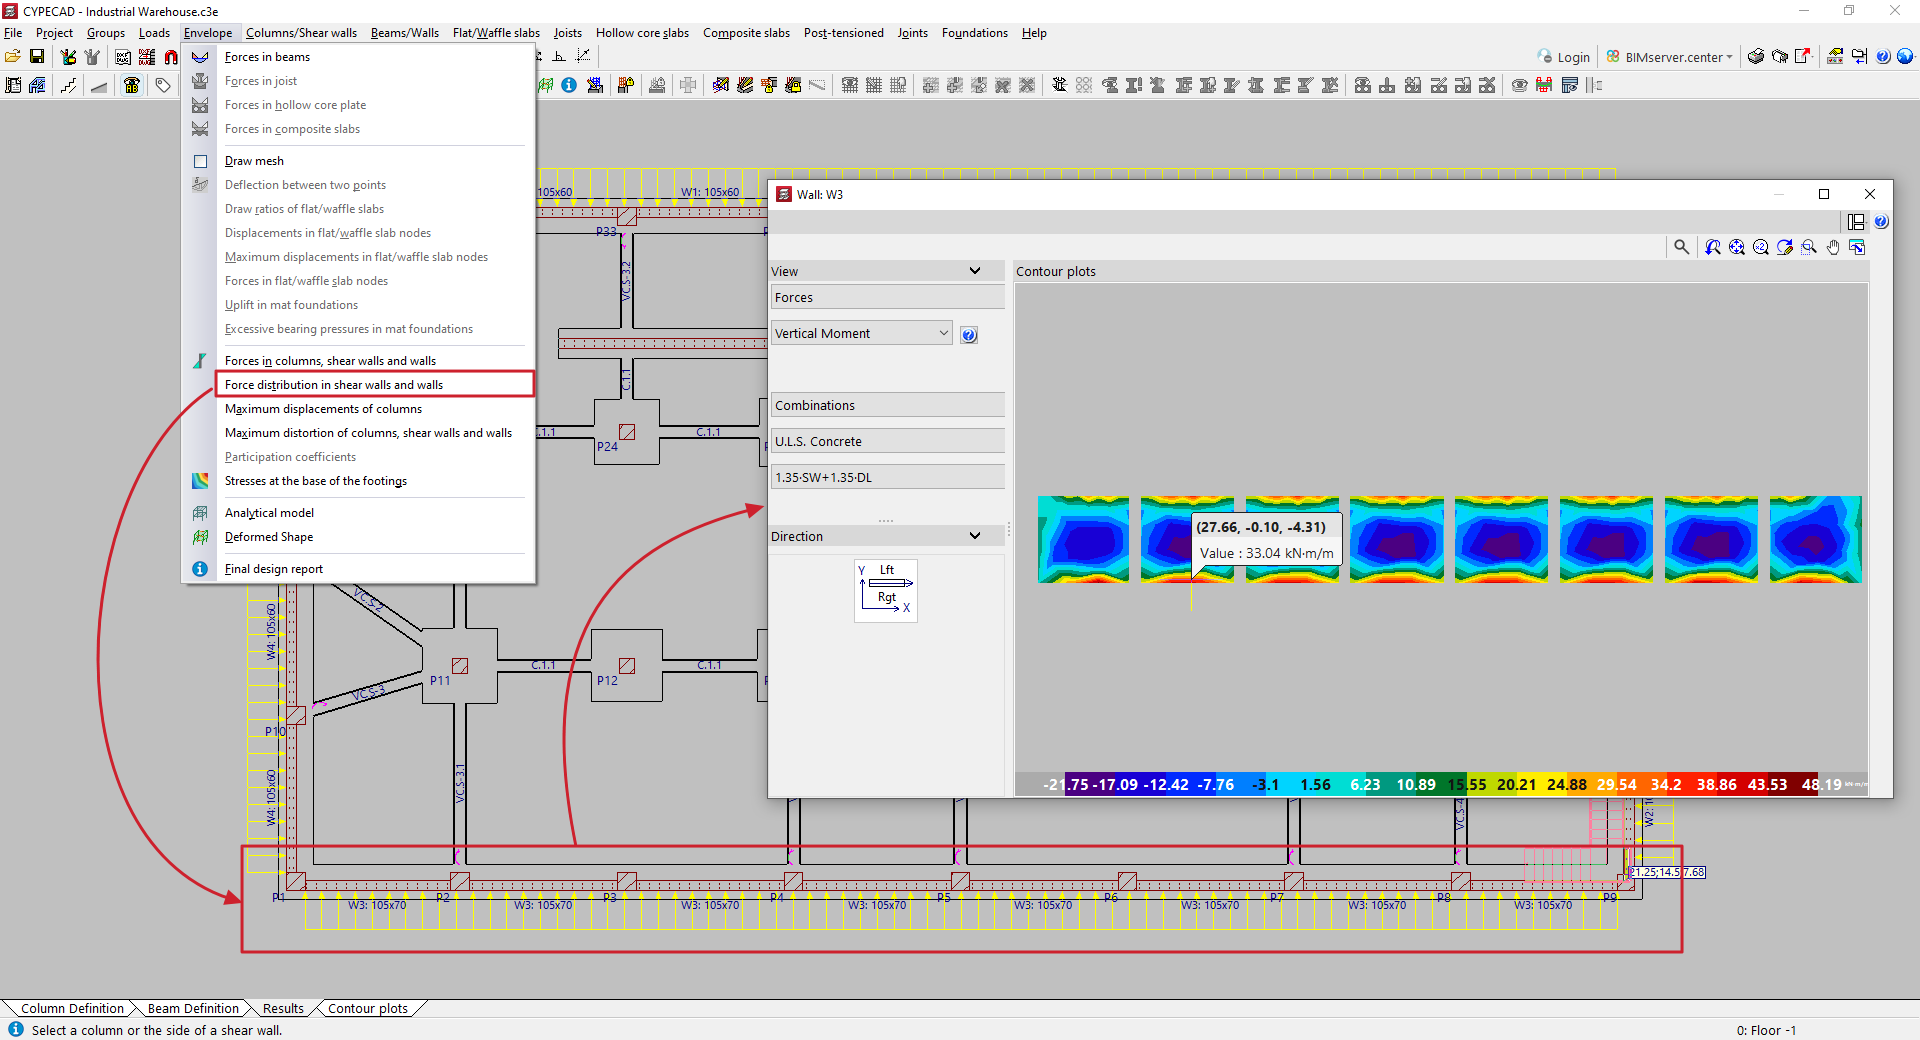
Forces
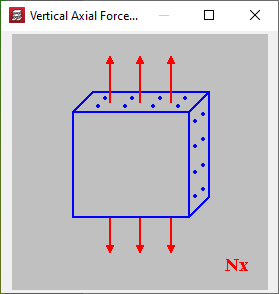
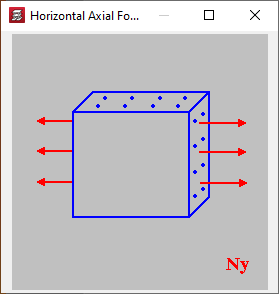
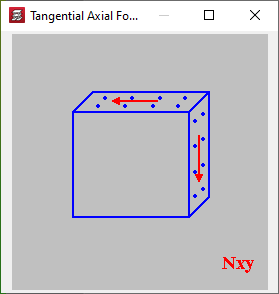
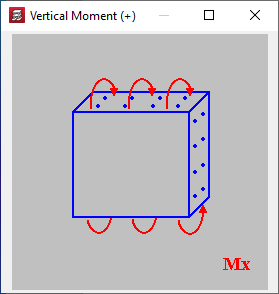
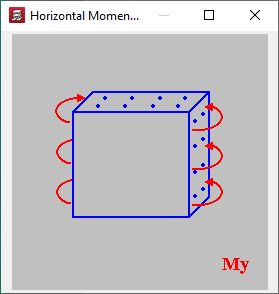
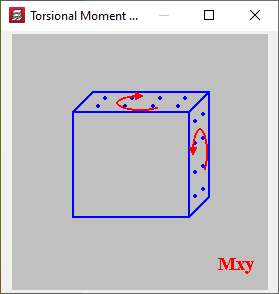
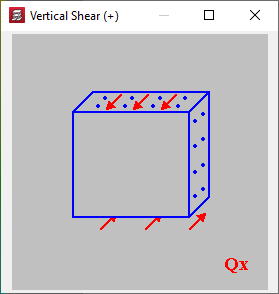
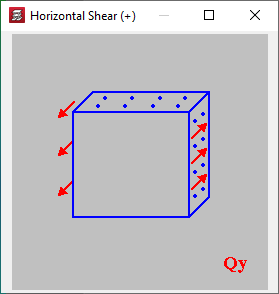
If "Forces" is selected as the display type, the program displays the following stresses for viewing:
- Vertical axis
- Horizontal axis
- Tangential axis
- Vertical moment
- Horizontal moment
- Torsional moment
- Vertical shear force
- Horizontal shear force
Clicking on the accessible help button on the right brings up an explanation of the selected effort level and the criteria for the positive sign.
In the diagram below, the section "Direction" shows the position of the shear wall or wall on the floor plan in relation to the building’s main axes, as well as the direction of its left and right sides.
The overview on the left shows an elevation diagram of the shear wall or wall, with the different values of the selected forces represented by a colour gradient.
The units of the gradients and the minimum and maximum values for each step of this gradient are shown on the colour scale at the bottom of the display.
Displacements
Selecting the "Displacements" option displays the displacement and rotation diagrams for all points on the screen or wall relative to the three general axes of the structure, as well as the "Total Displacement":
- X displacement
- Y displacement
- Z displacement
- X rotation
- Y rotation
- Z rotation
- Total displacement
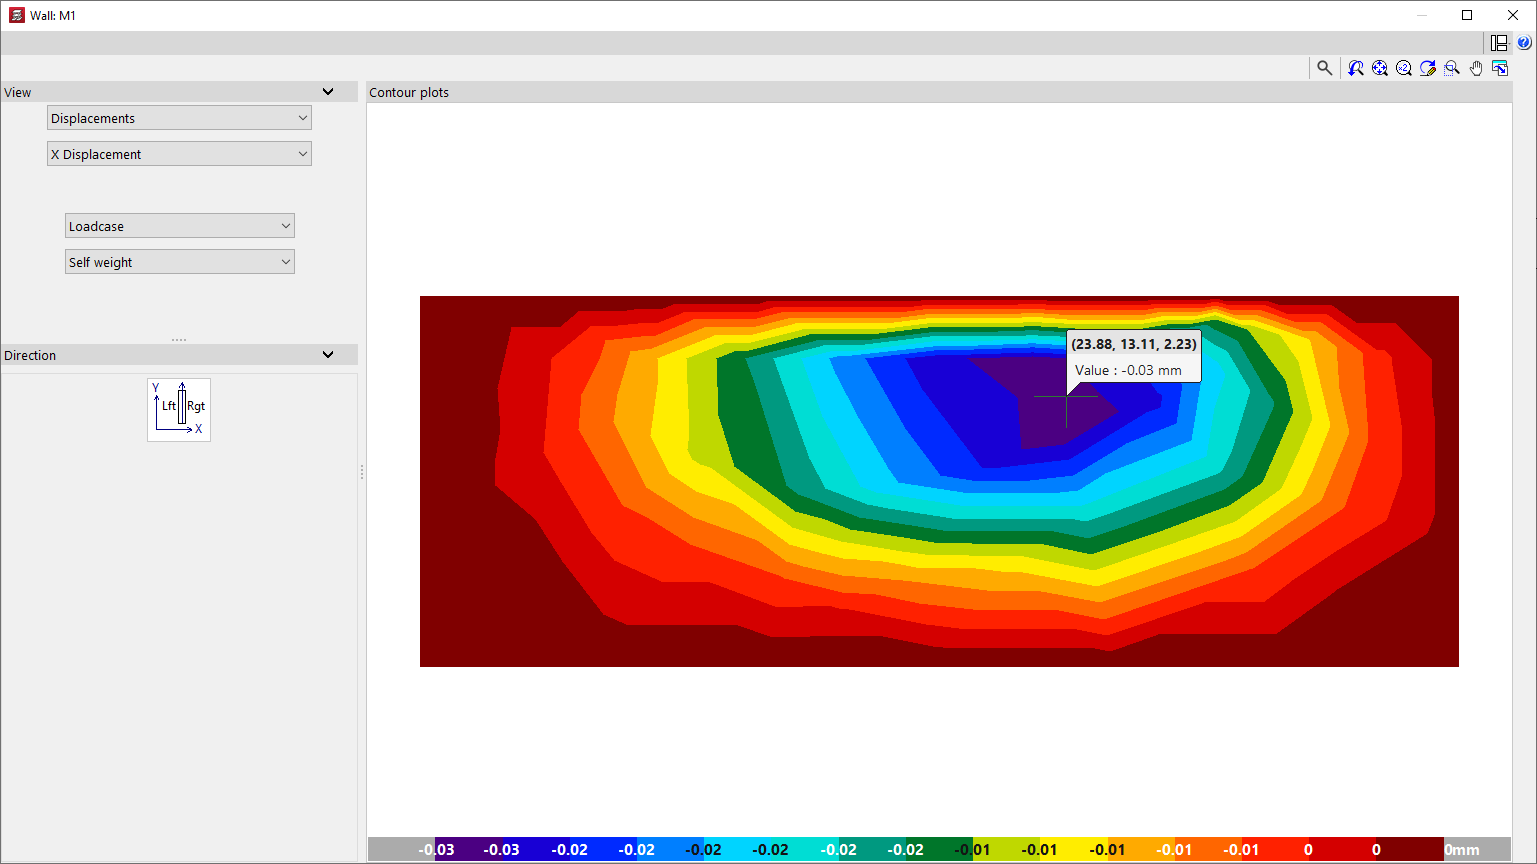
In both the "Displacements" and "Forces" windows, the program allows you to select the loadcase, combination or envelope you wish to view:
- Loadcase
The calculated values for the selected simple loadcase will be displayed. - Combinations
The calculated values for the specified combination of loadcases will be displayed once you have selected one of the available combination groups. - Envelopes
The "Maximum" or "Minimum" forces envelope for all loadcase combinations in the selected combination group will be displayed.
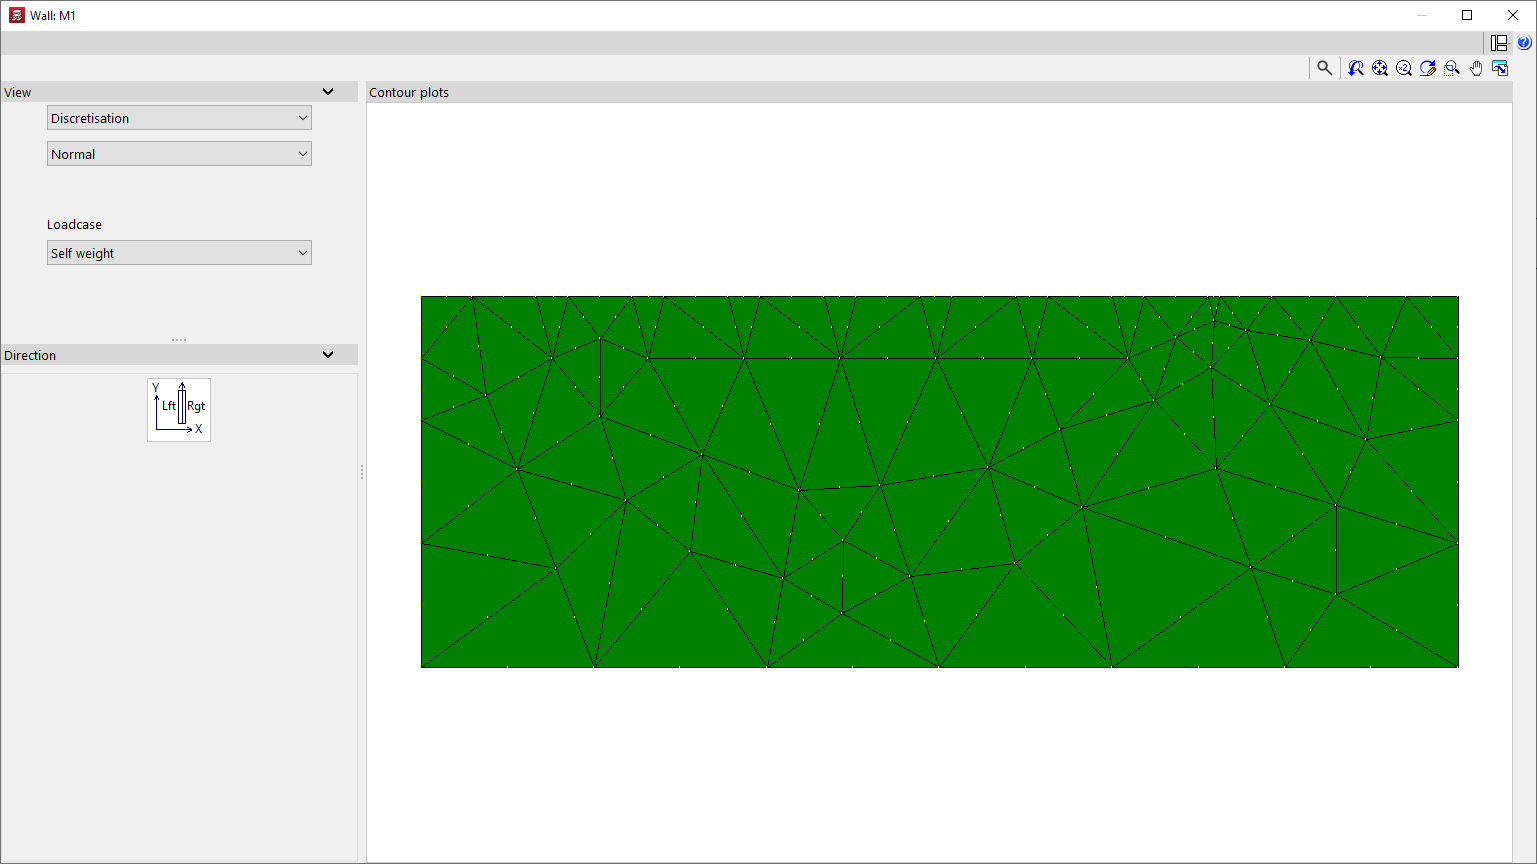
Discretisation
When you select "Discretisation", the layout and geometry of the triangular finite elements generated during the analysis of the shear wall or wall are displayed.
The discretisation can be displayed in the following ways, which can be selected from the relevant drop-down menu:
- The "Normal" option allows you to display the connection nodes between the finite elements;
- the "Reduced" option hides these link nodes;
- Finally, the "By floors" option allows you to colour the finite elements by storey.
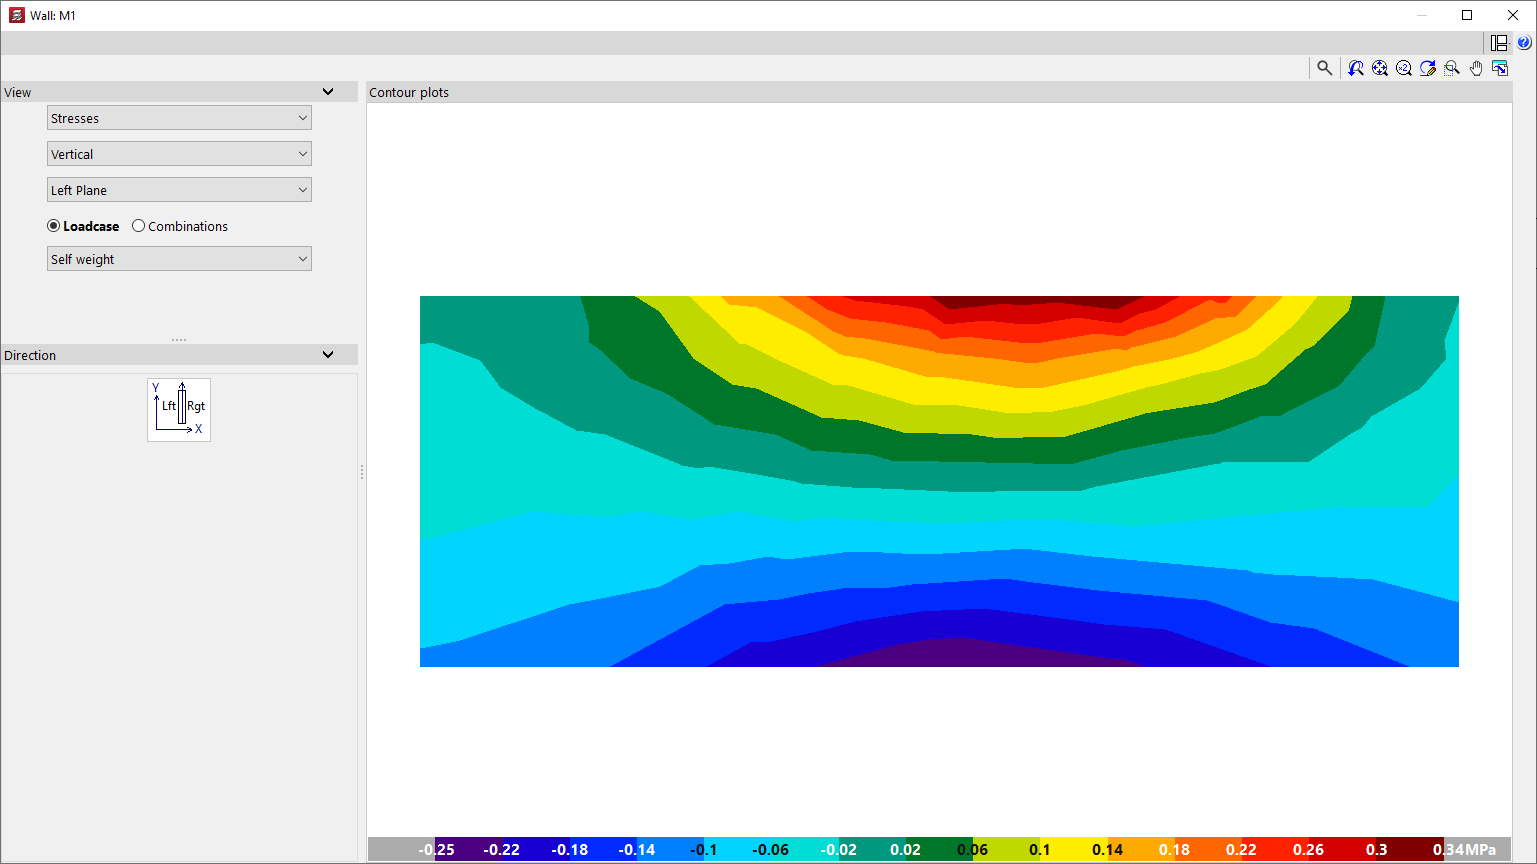
Stresses
You can view the following "Stresses" on the screen or display by selecting the relevant option:
- Vertical
- Horizontal
- Tangential in the Plane
- Tangential Vertical
- Tangential Horizontal
The voltages can be viewed on the "Right-hand panel", the "Central panel" or the "Left-hand panel" of the screen or wall.
Finally, you select a simple "Loadcase" or one of the calculated "Combinations" of loadcases.
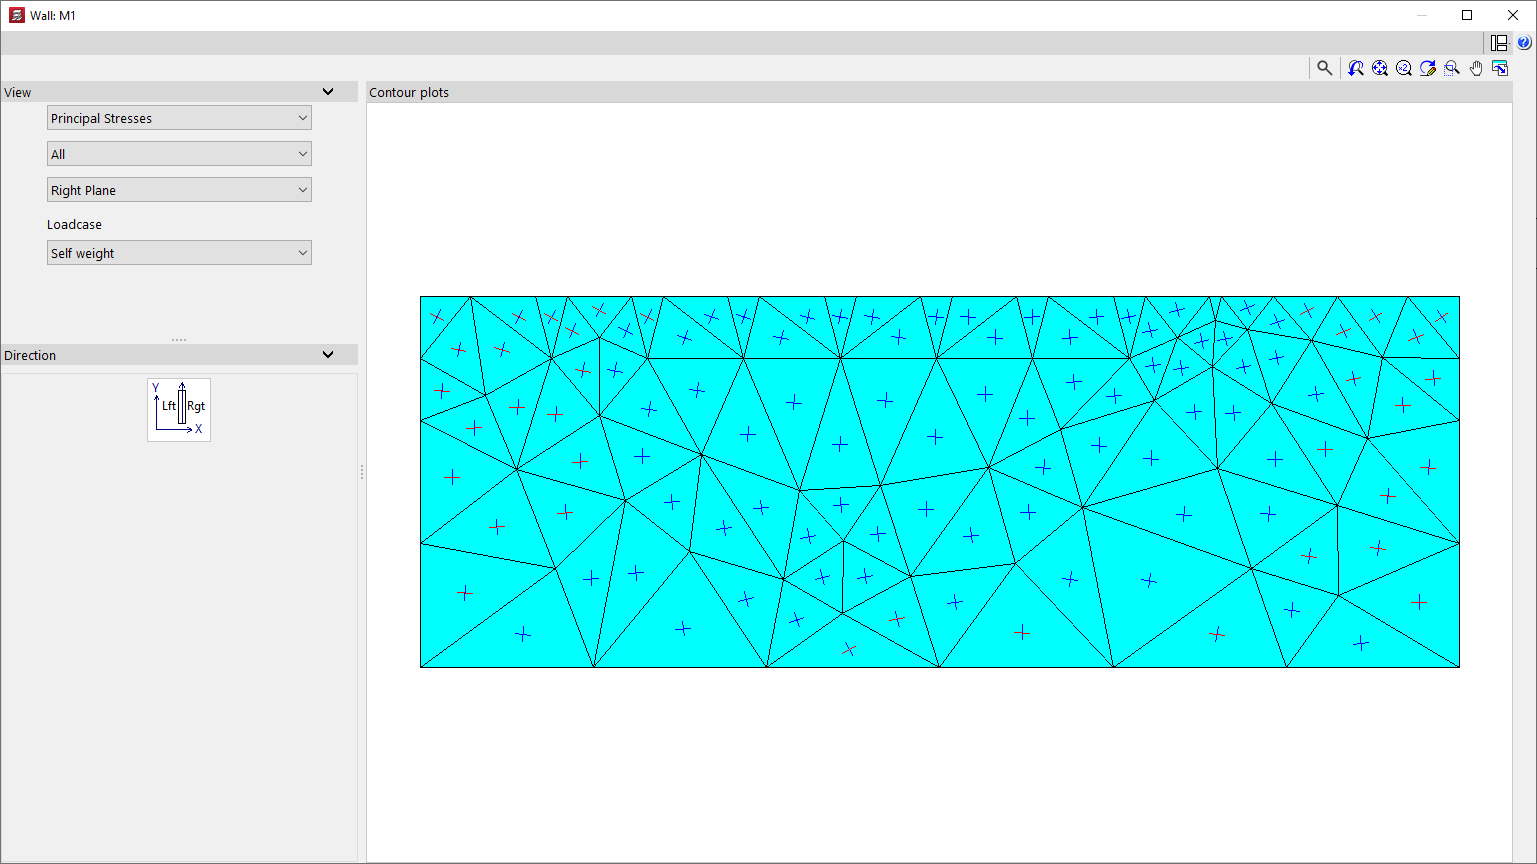
Main stresses
Selecting "Main stresses" displays a representation of these stresses on each plane of the screen or wall, for the selected simple "Loadcase".
You can display "All" stresses, or only "Tension" or "Compression" stresses, for each of the finite elements that make up the screen or wall.
In addition, the stresses can be displayed on the "Right-hand plane" or the "Left-hand plane" of the screen or wall.
Checking the maximum displacements in columns and the maximum distortion of columns, shear walls and walls
To check the maximum column displacement and the maximum distortions of columns, slabs and/or walls in CYPECAD, once the structure has been calculated, open the "Results" tab and navigate to a group where any of these elements are visible.
Next, open the "Envelopes" menu at the top of the interface.
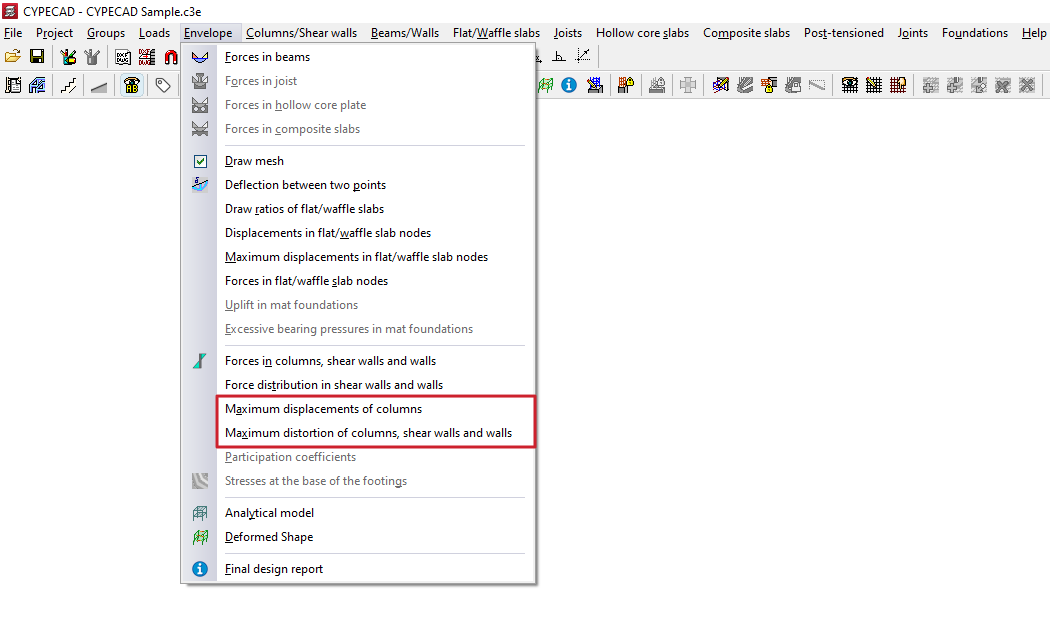
Maximum column displacements
The "Maximum column displacements" option displays the maximum displacements of the selected column on each floor.
These are the maximum displacement values for all combinations of assumptions associated with the displacements defined in the "General data" section of the "Project", and they refer to the general axes X, Y and Z.
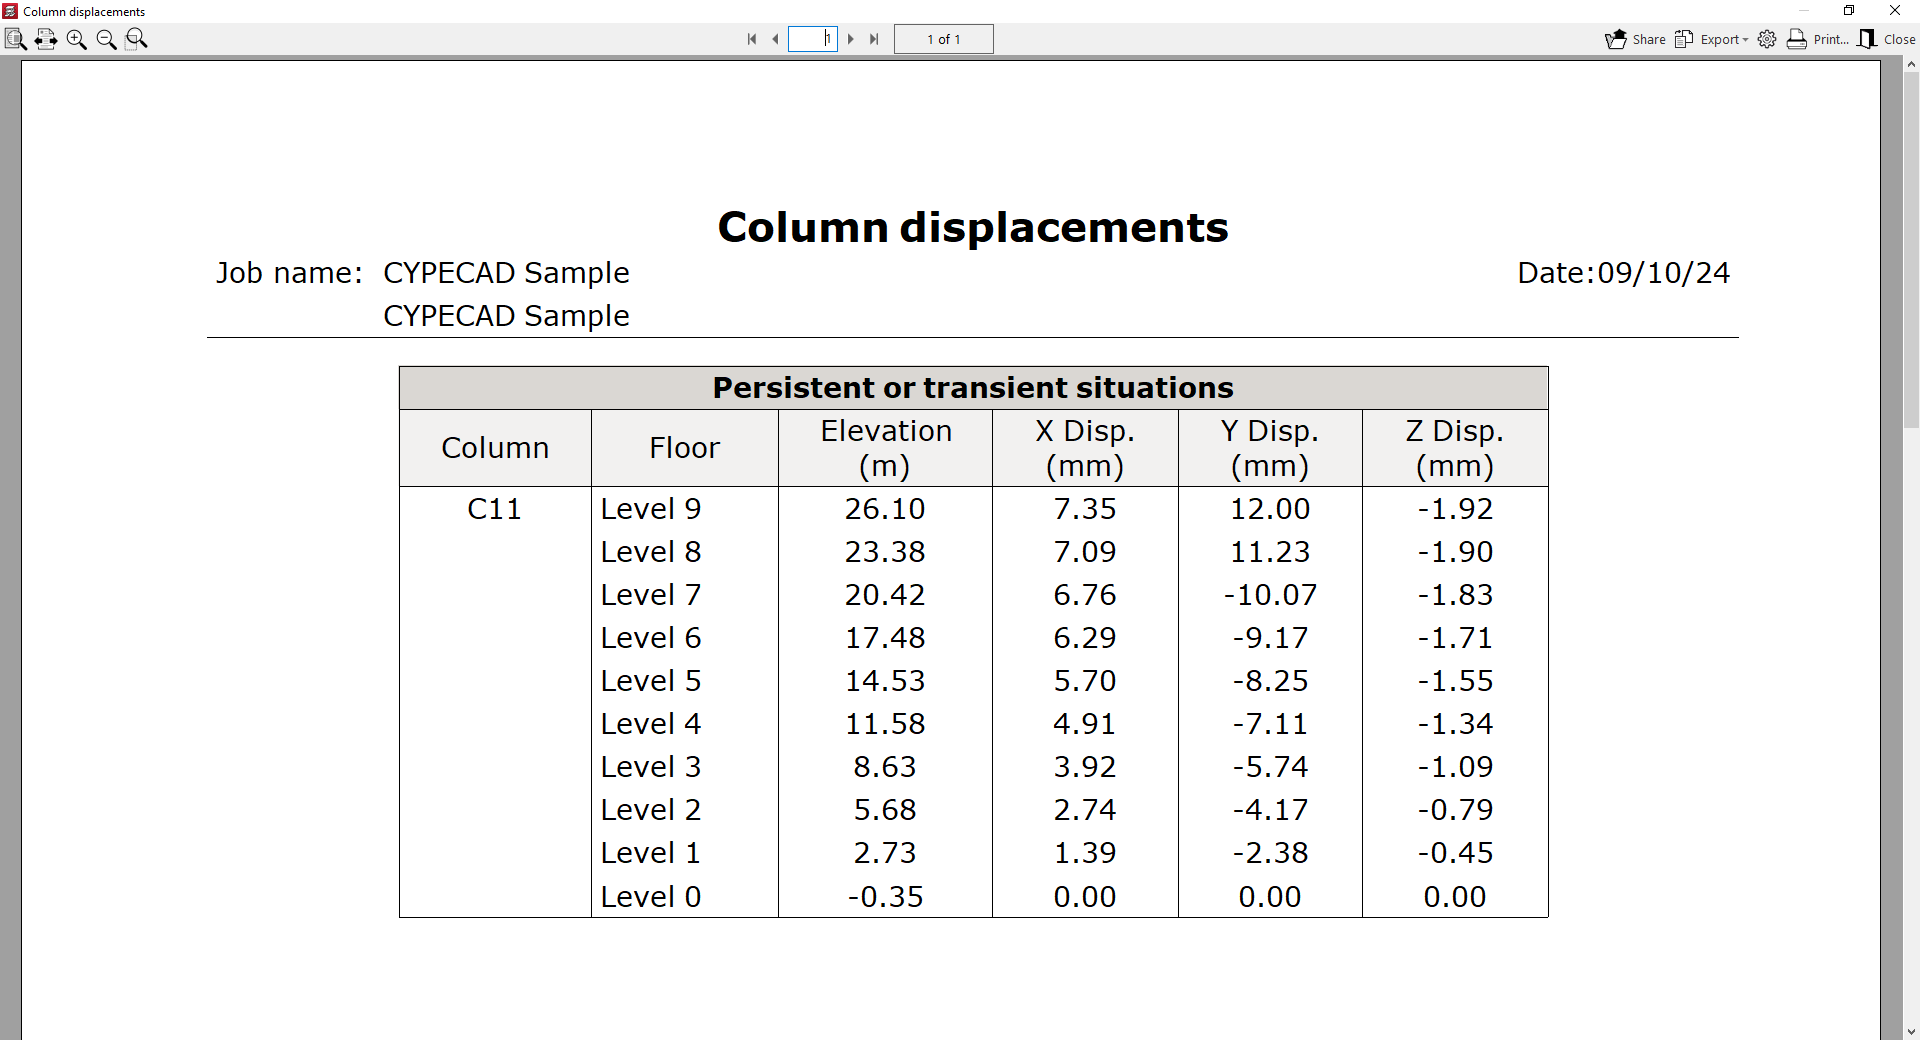
Maximum distortion of columns, shear walls and walls
The "Maximum distortion of columns, shear walls and walls" option displays a list of the maximum horizontal displacements relative to the floor heights for these elements.
This list begins with a table showing the distortion data calculated for each loadcase and for the selected "Column":
- On each "Floor", its "Elevation" is indicated, along with the height ("h") relative to the level immediately below, and the horizontal offset or distortion on that floor relative to the general X and Y axes, both "Absolute" and "Relative" to the floor level. Furthermore, its "Origin" is indicated, which refers to the nature of the combination of loadcases that produces the maximum distortion on each floor.
- The bottom row shows the "Total" distortion of the column, screen or wall, calculated as the total height from the initial floor to the final floor.
Finally, the "Maximum values" section displays a table showing the values for "Local maximum shift of the columns" (or of shear walls or walls) for each "Floor" and for each case, and in each of the directions, X and Y.
Finally, a table is displayed showing the value for "Maximum total drift of the columns" (or of shear walls or walls) for the entire structure in each direction.
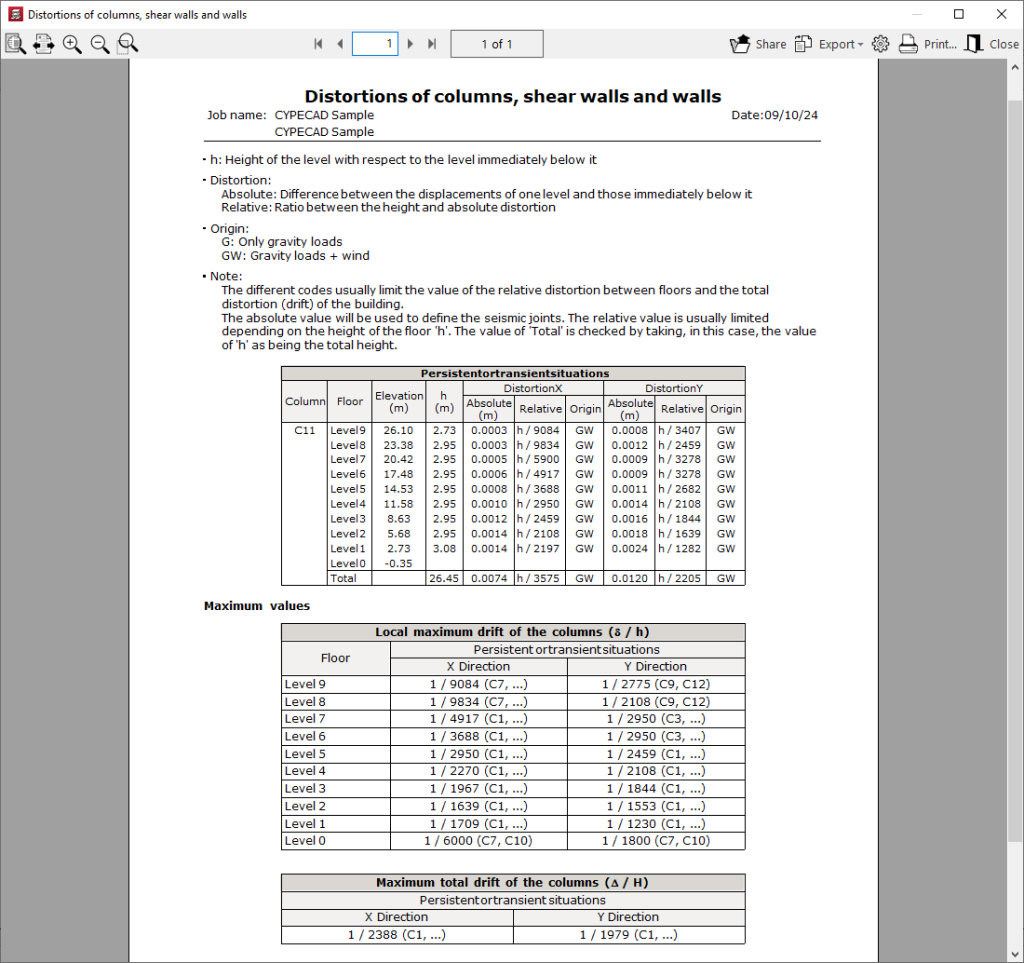
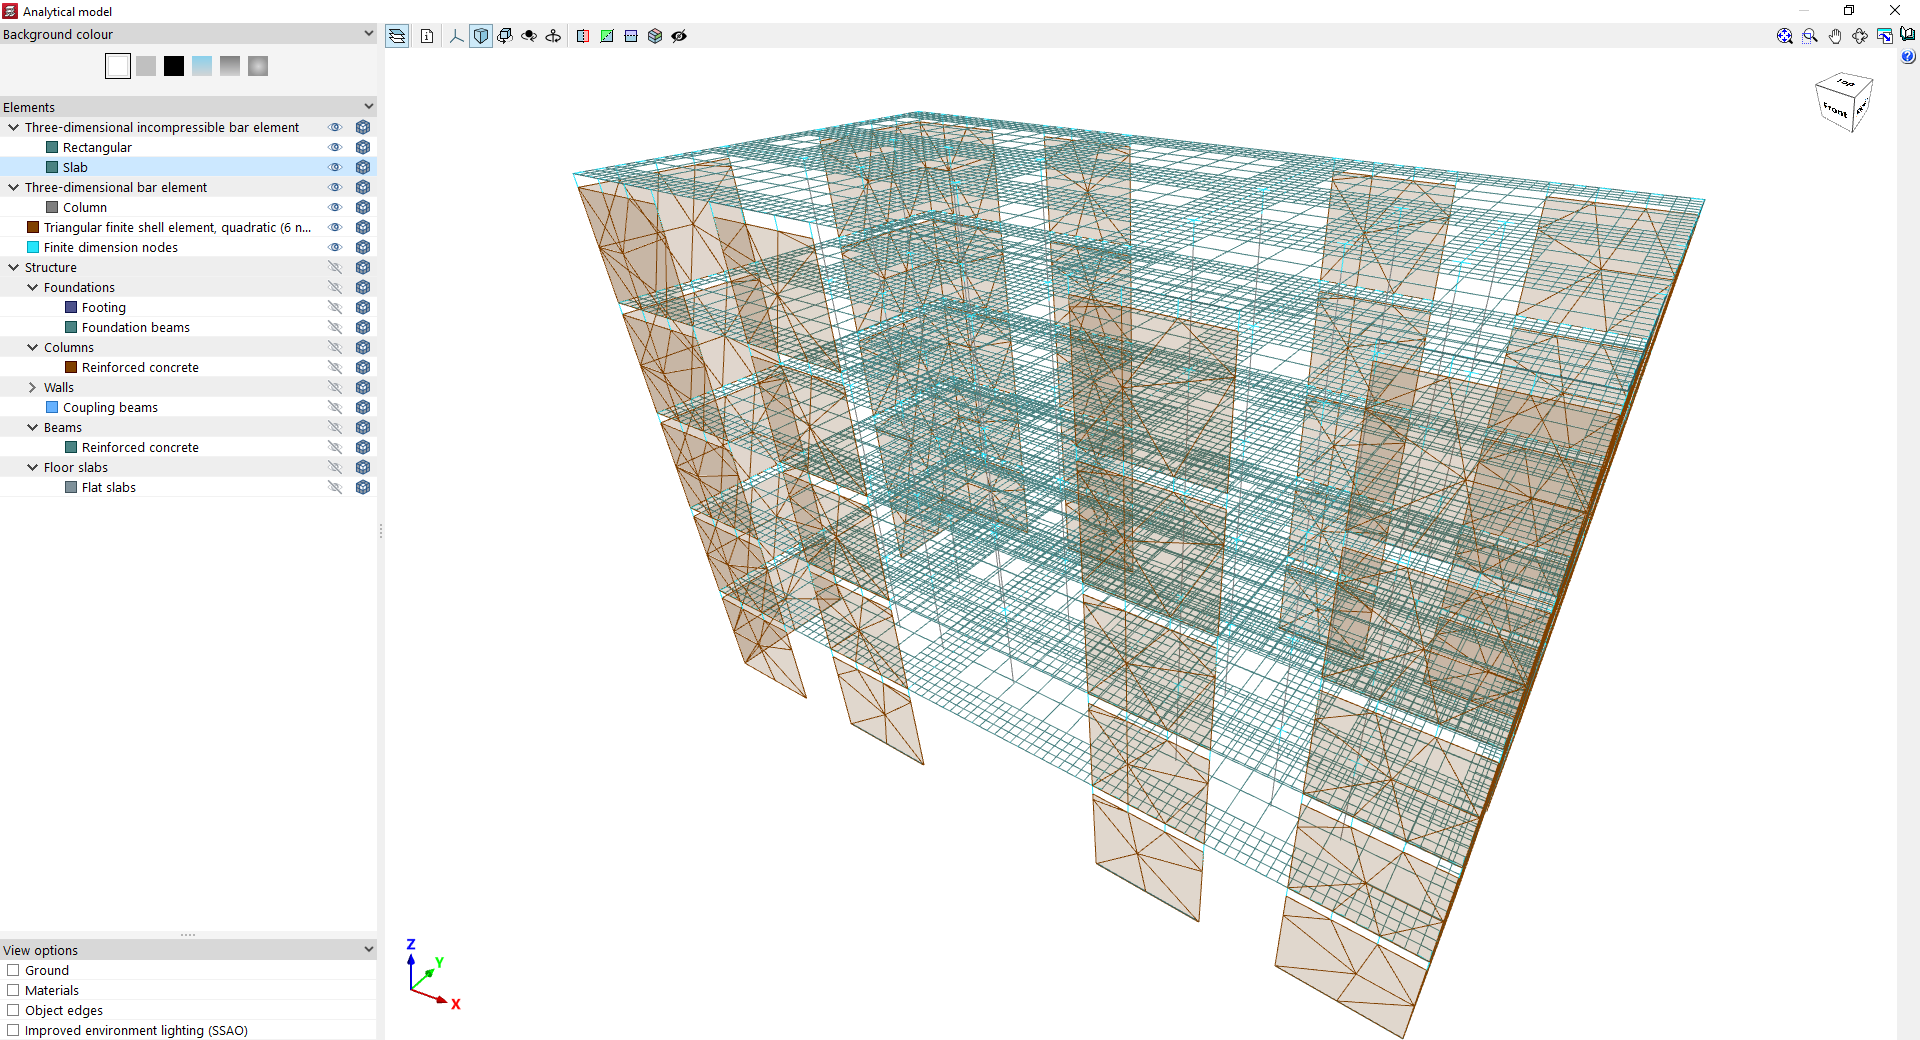
View the analytical model of the structure
The "Analytical model" option, within the "Envelopes" menu on the "Results" tab, allows you to view the analytical model corresponding to the latest analysis for the structure.
The program generates the elements of the analytical model by discretising the structural elements during the model analysis process.
When you click on the option mentioned, the program retrieves the groups of elements by type and, once the process is complete, opens a viewer of the model in a pop-up window.
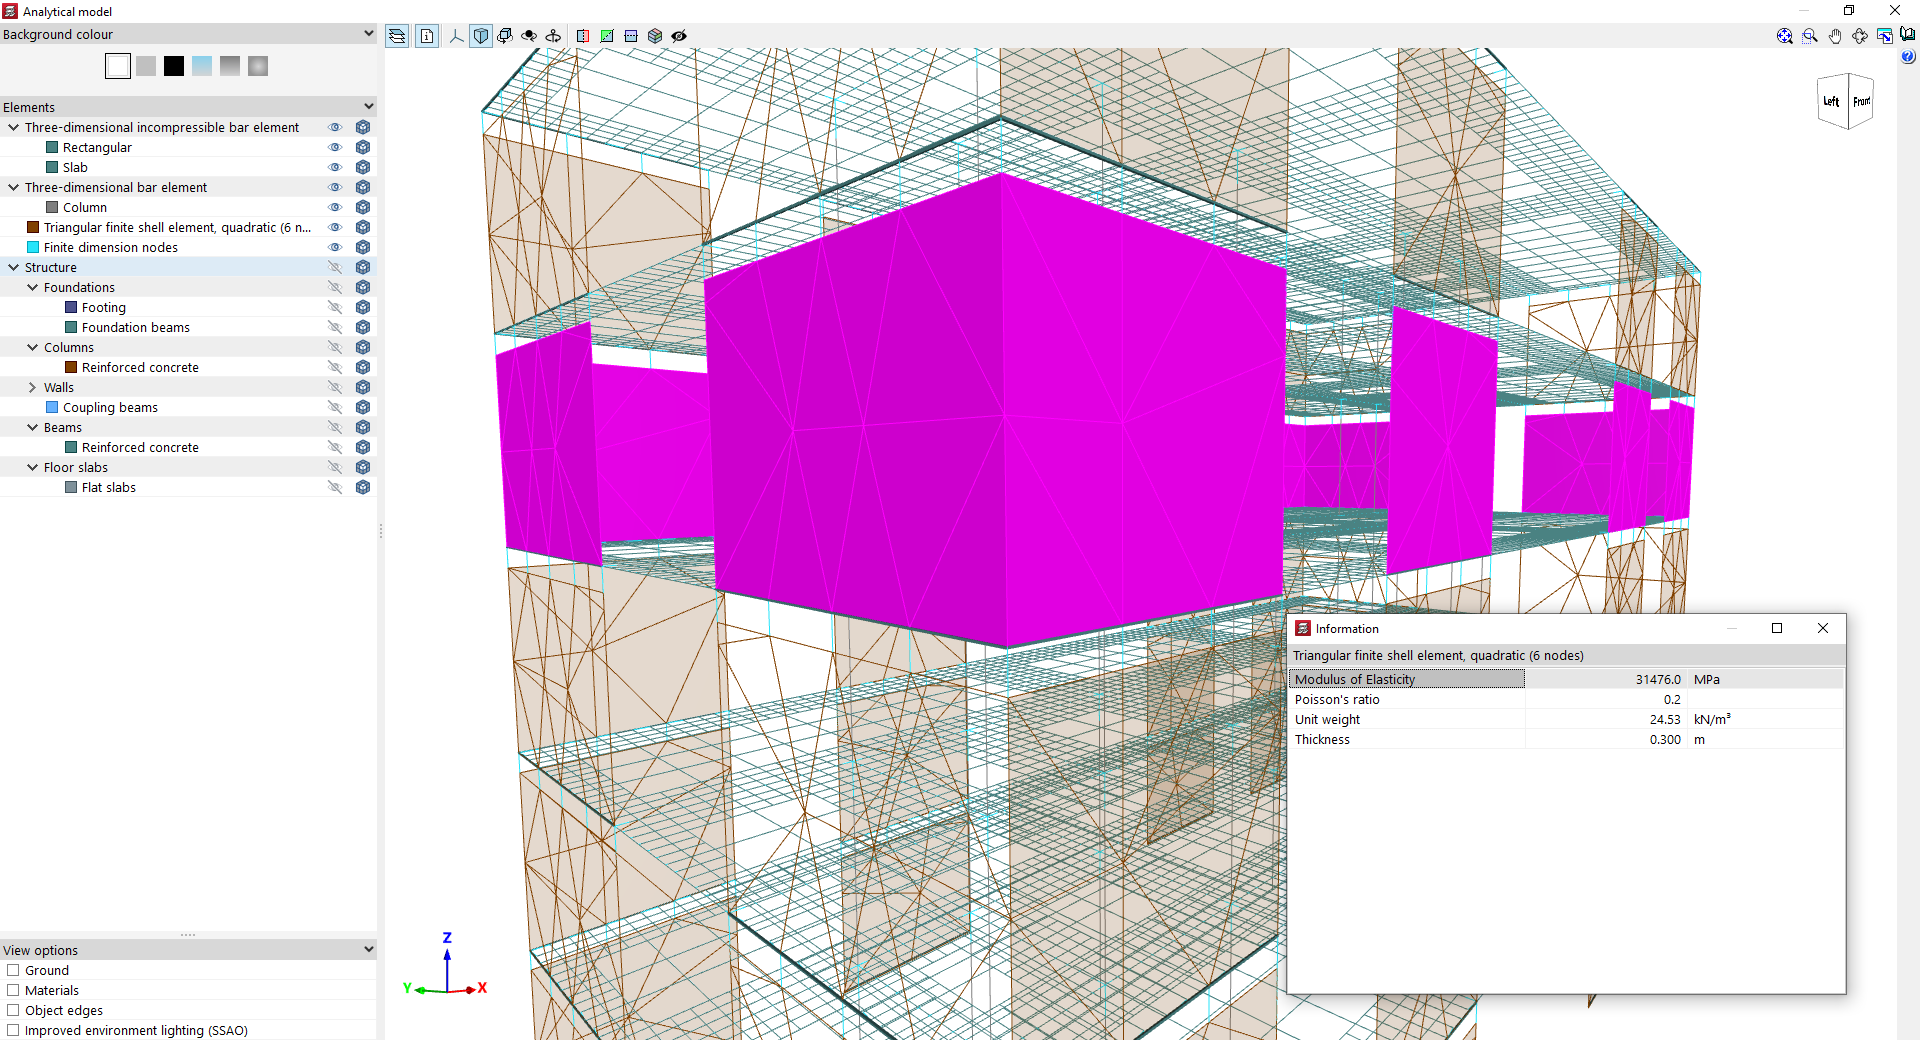
In this window, in the browser on the left-hand side, you can change the "Background colour" and then enable or disable the display and/or transparency of the following "Elements" of the analytical model in the viewer:
- Three-dimensional incompressible bar element
This section covers the elements of the analytical model corresponding to beams (such as bars with a "Rectangular" cross-section) and floor slabs (such as the bars used to discretise "Slabs"). - Three-dimensional bar element
This section contains the elements of the analytical model of the "Column" type. - Triangular finite shell element, quadratic (6 nodes)
These elements correspond to the triangular finite elements that the program uses to discretise walls and screens. - Finite-dimensional nodes
These elements correspond to the finite-dimensional nodes generated at the junctions between other elements (for example, at the junction between several beams and the lower and upper sections of a column).
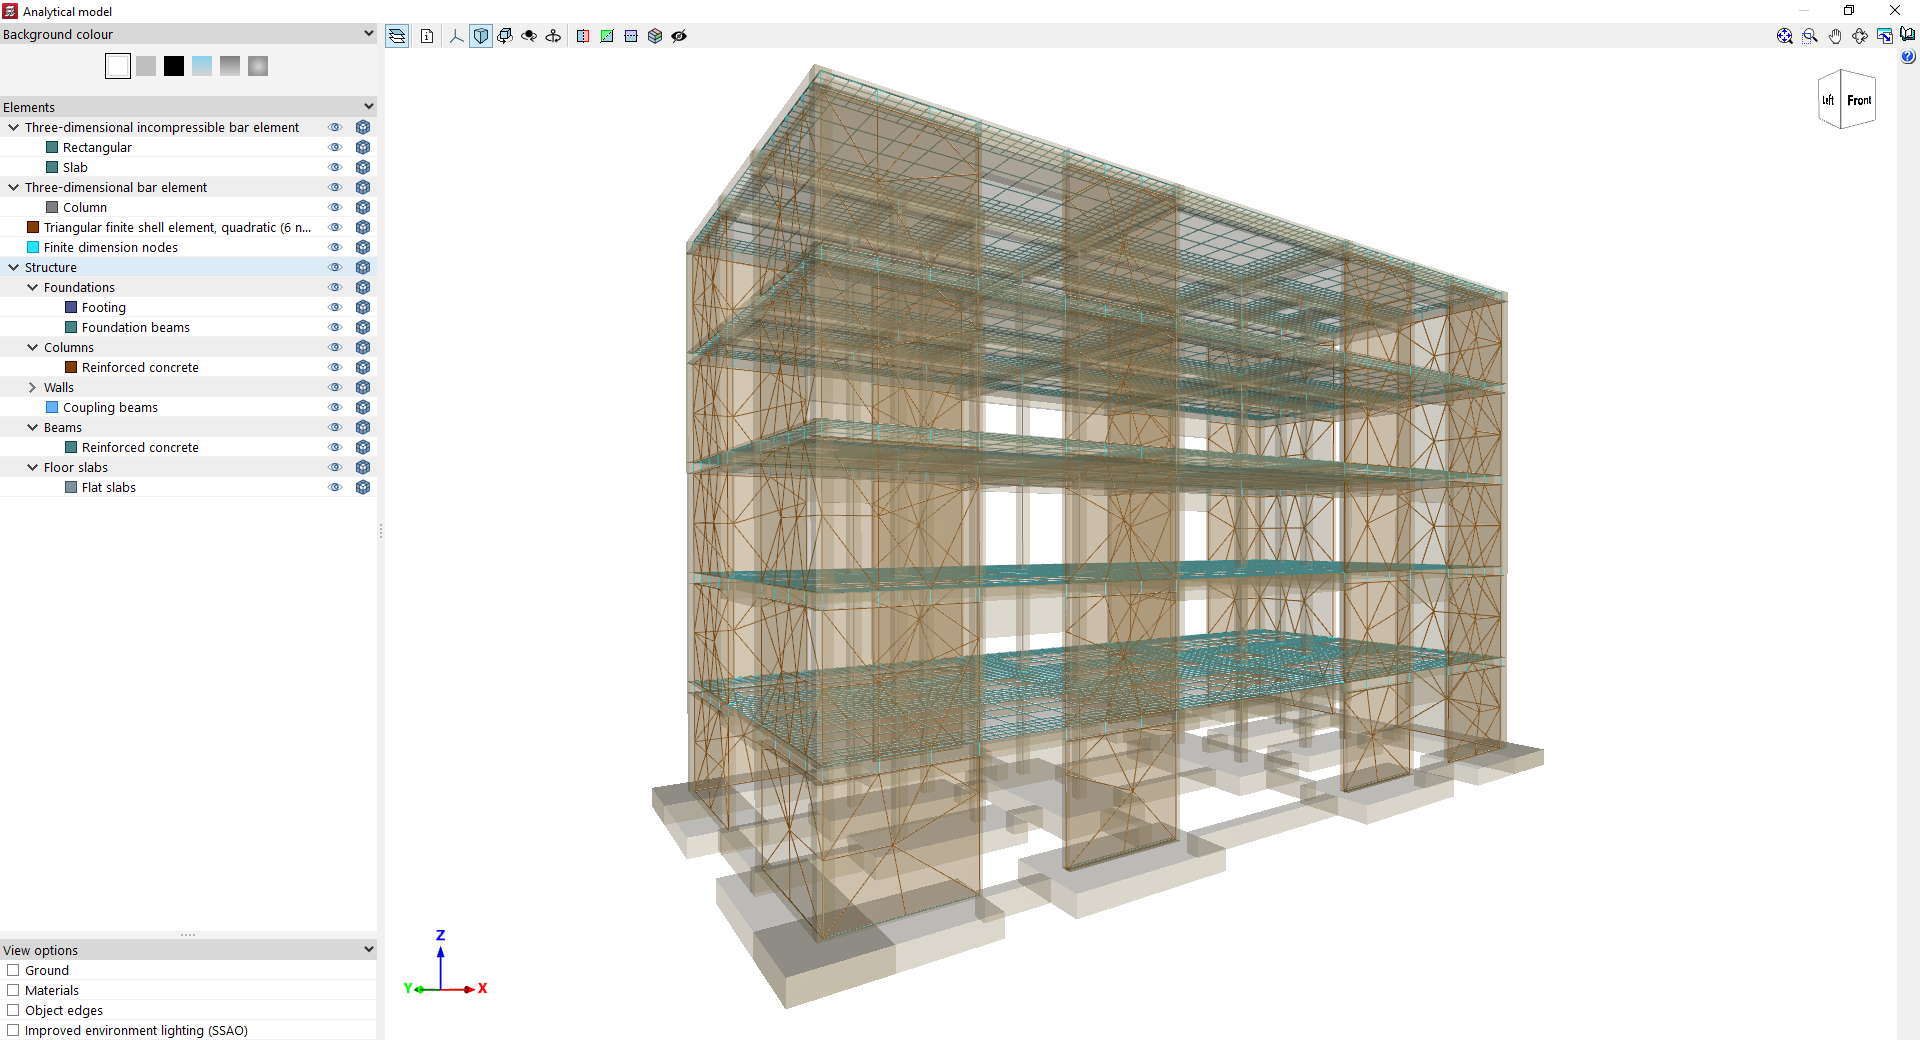
It is also possible to enable the display of the volume of the elements in the "Structure" section, including elements from the "Foundations", "Columns", "Walls", "Beams" and "Floors".
At the bottom, the program offers "View options" common to other 3D viewers in the program, including the option to enable the "Ground", display "Material" textures or "Object edges", and use "Improved environment lighting (SSAO)".
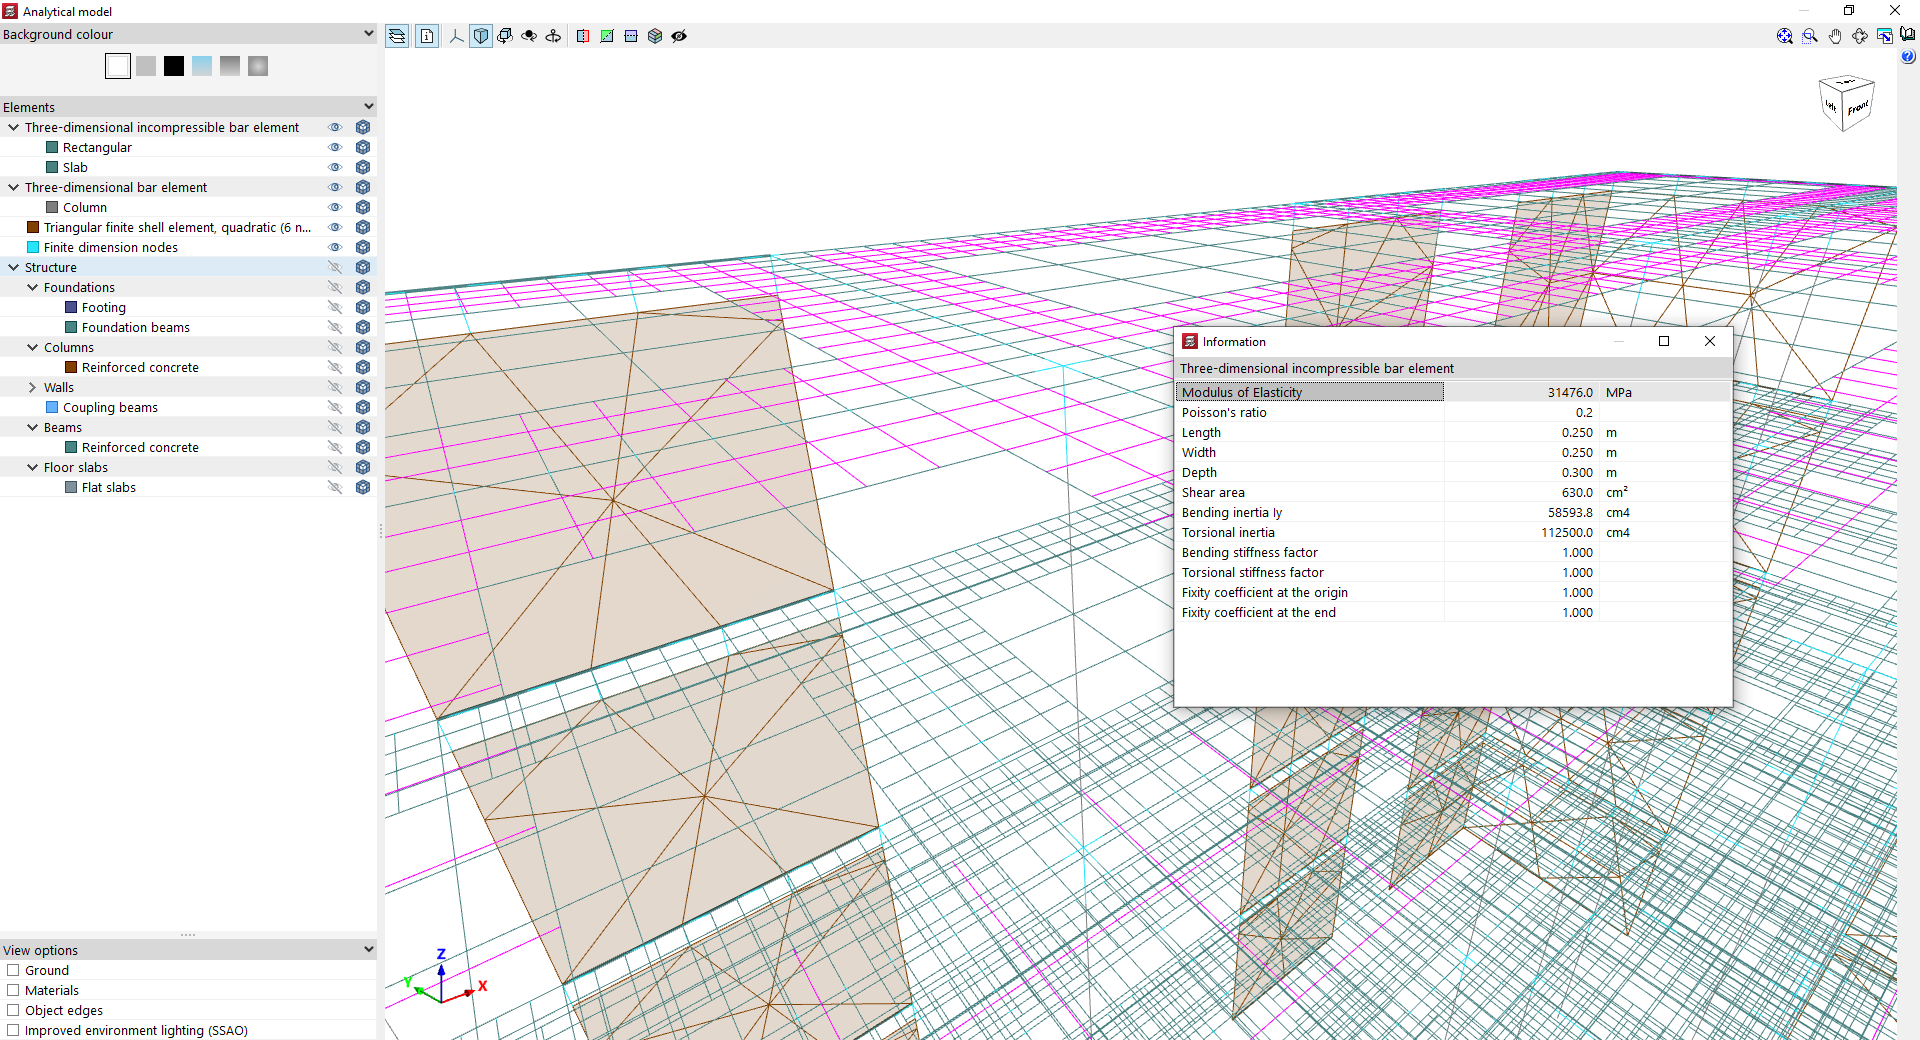
By using the "Information" option on the toolbar at the top of the viewer, you can click on the various groups of elements in the analytical model to view properties such as the following:
In a three-dimensional non-compressible beam element (such as the beams in a slab floor or main beams):
- Modulus of Elasticity
- Poisson's ratio
- Length
- Width
- Depth
- Shear area
- Bending inertia Iy
- Torsional inertia
- Bending stiffness factor
- Torsional stiffness factor
- Fixity coefficient at the origin
- Fixity coefficient at the end
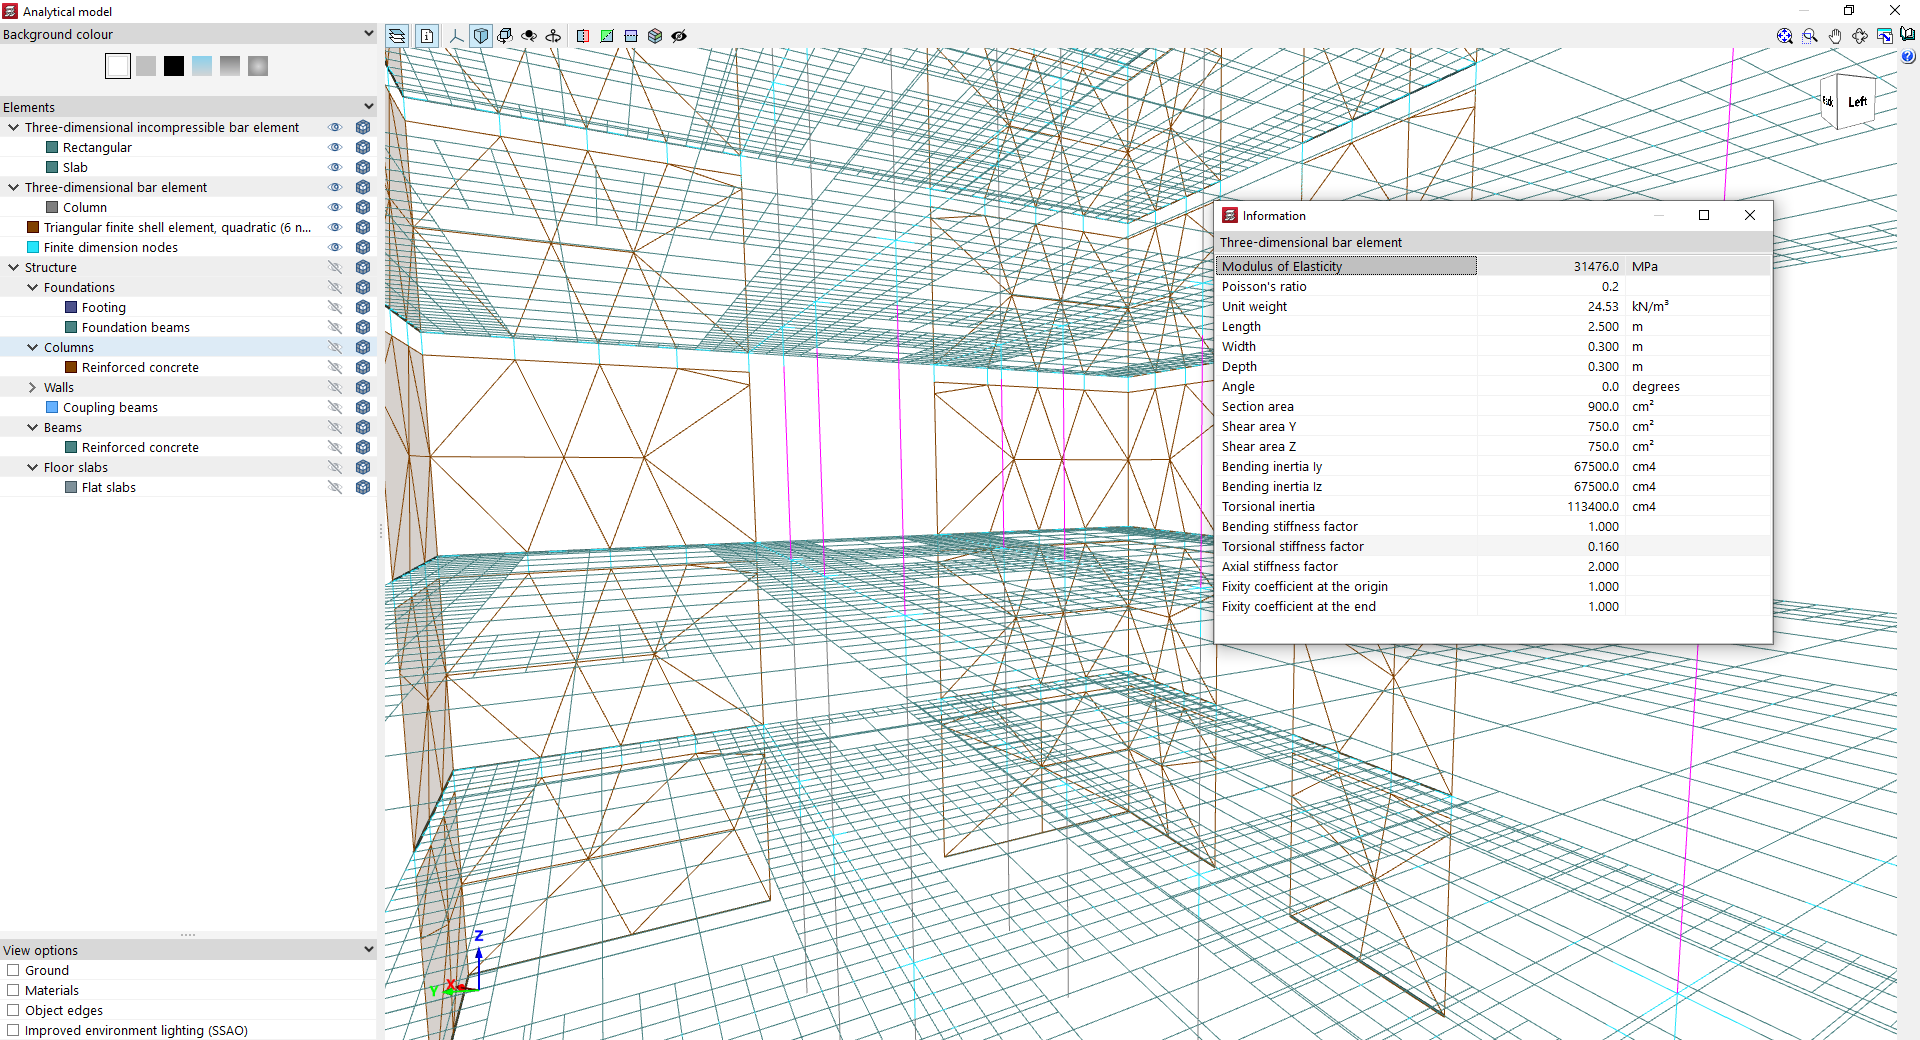
In a three-dimensional beam element (such as columns):
- Modulus of Elasticity
- Poisson's ratio
- Unit weight
- Length
- Width
- Depth
- Angle
- Section area
- Shear area Y
- Shear area Z
- Bending moment of inertia Iy
- Bending moment of inertia Iz
- Torsional inertia
- Bending stiffness factor
- Torsional stiffness factor
- Axial stiffness factor
- Fixity coefficient at the origin
- Fixity coefficient at the end
In a finite triangular quadratic sheet element (6 nodes):
- Modulus of Elasticity
- Poisson's ratio
- Unit weight
- Thickness
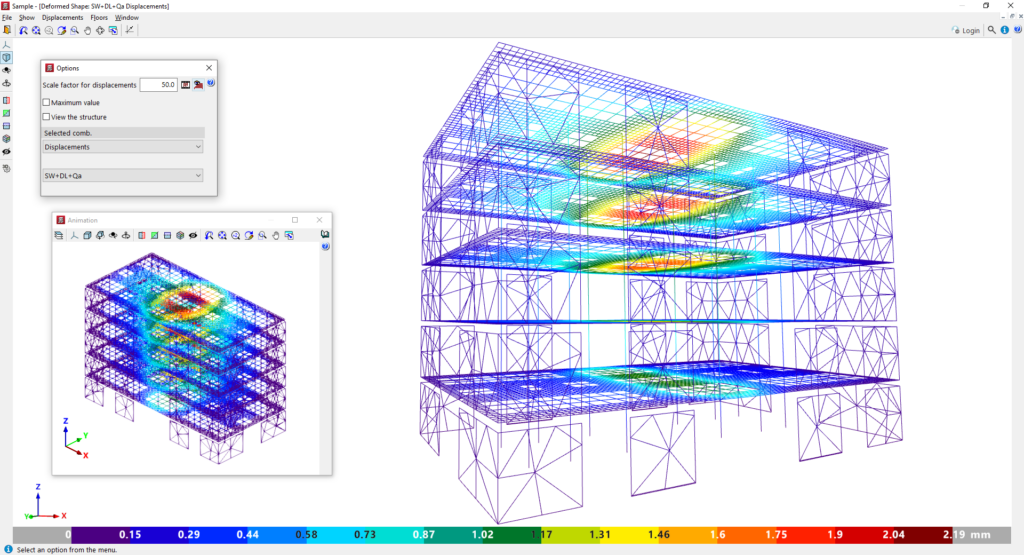
Checking the deformed shape of the structure
The "Deformed shape" option, within the "Envelopes" menu on the "Results" tab, allows you to view the deformed shape corresponding to the latest analysis for the structure.
After clicking on the option, a pop-up window opens displaying the structure's deformed shape viewer, which contains the following tools:
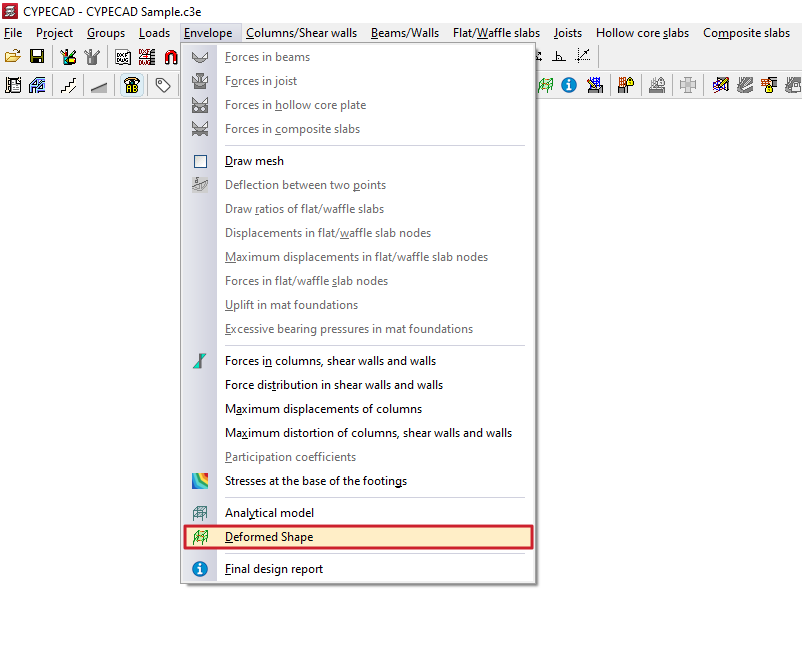
Settings
The "Options" window can be shown or hidden using the option of the same name in the "View" menu at the top; this is where you can configure the information you wish to display:
- At the top, enter a "Scale factor for displacements". This allows you to adjust the scaling of the elements in the viewer to display them more clearly.
- Further to the right, clicking the "Animation" button displays an animation of the structural deformation caused by the selected combination, starting from the undeformed state.
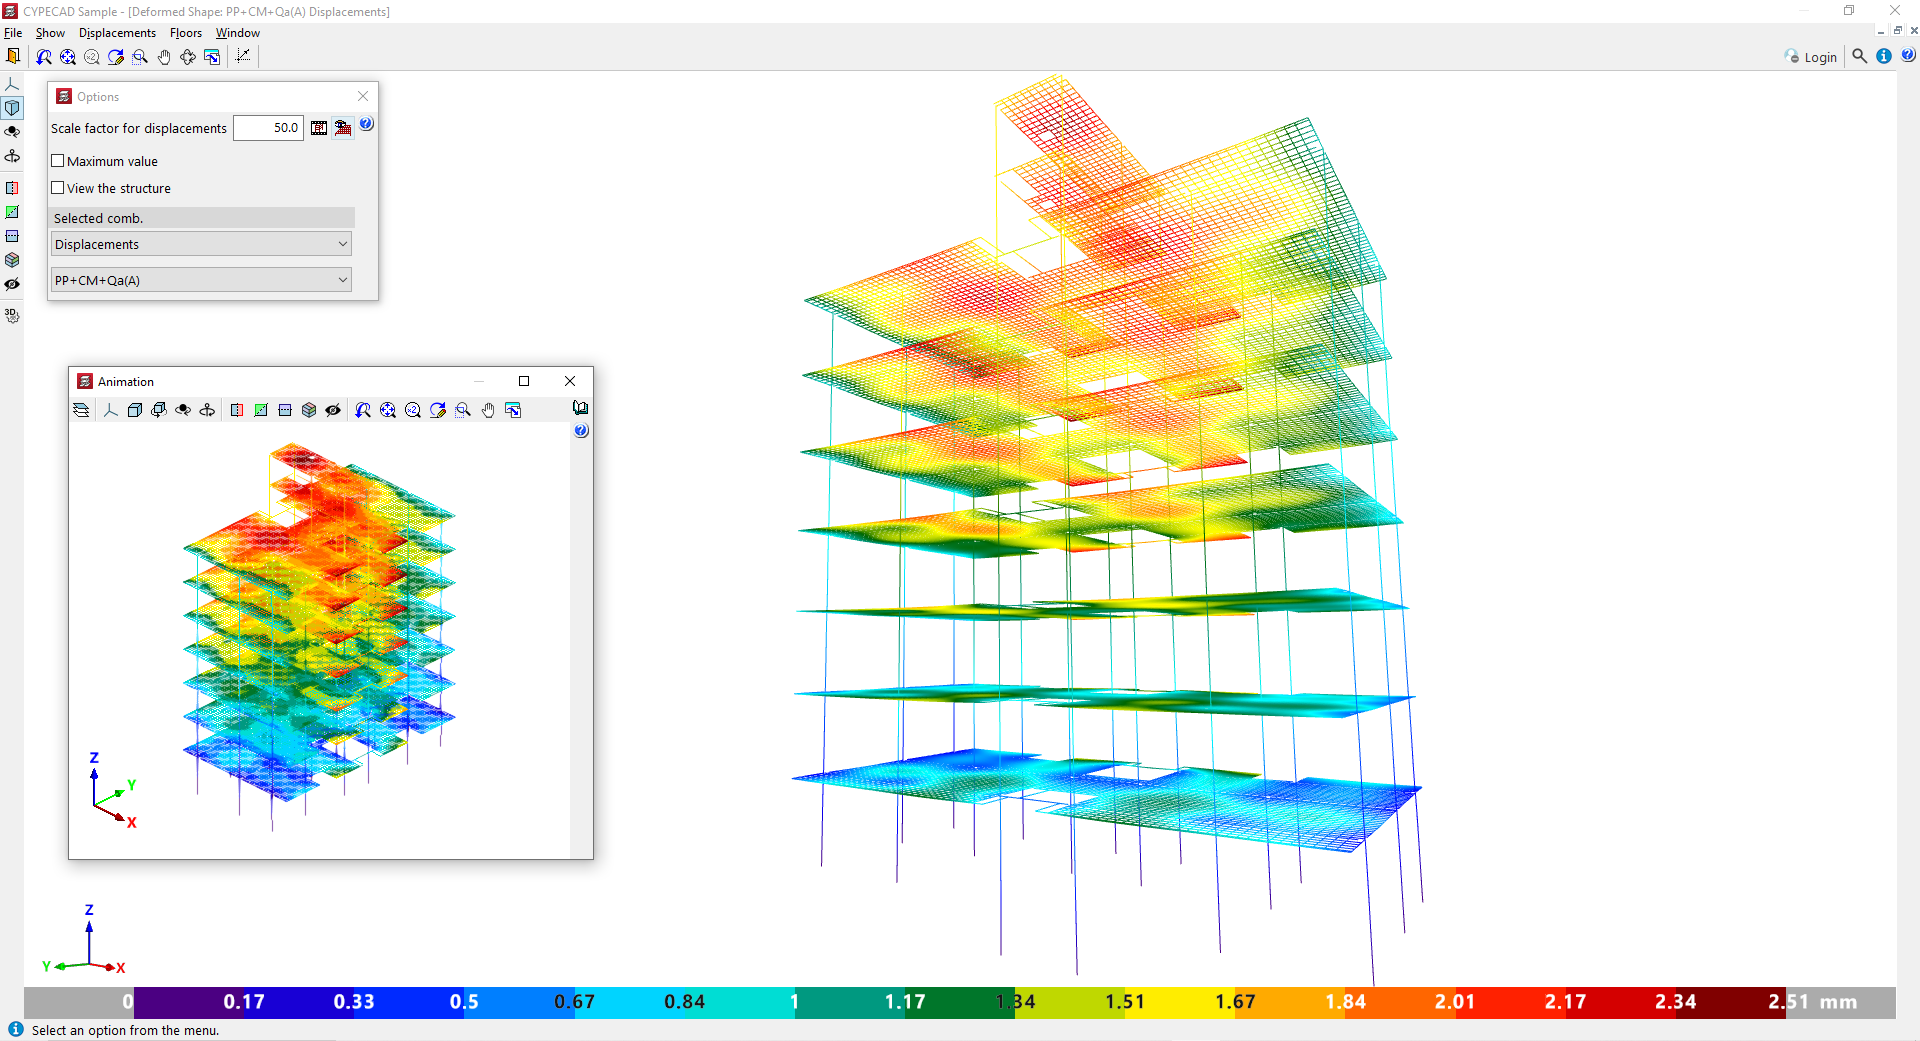
- There is also an option labelled "View grid slabs and slabs", which allows you to enable or disable the display of the mesh for these types of elements. In slabs and grid slabs, the structure is meshed using a very large number of elements, which means that rendering this mesh can be quite slow and dense. When the project is very large, it may be advisable to render the deformation without these structural elements so that, on the one hand, the rendering is faster and, on the other, the deformation of beams and columns can be seen more clearly.
- By ticking the relevant box, you can enter the "Maximum value" represented by the colour range in the elements of the deformation. Above the specified value, the deformation is displayed in grey.
- If you tick the "View structure" box, you will see a realistic representation of the structure, displayed semi-transparently alongside the deformed version.
In the "Selected combination" section at the bottom of the "Options" window, you must specify the specific loadcase or combination of loadcases you wish to view.
Among these options, you can select "Simple loadcase", thereby choosing a specific loadcase from the drop-down menu to view the associated deformation, or "Displacements", in which case you can select one of the loadcase combinations in this category defined in the model.
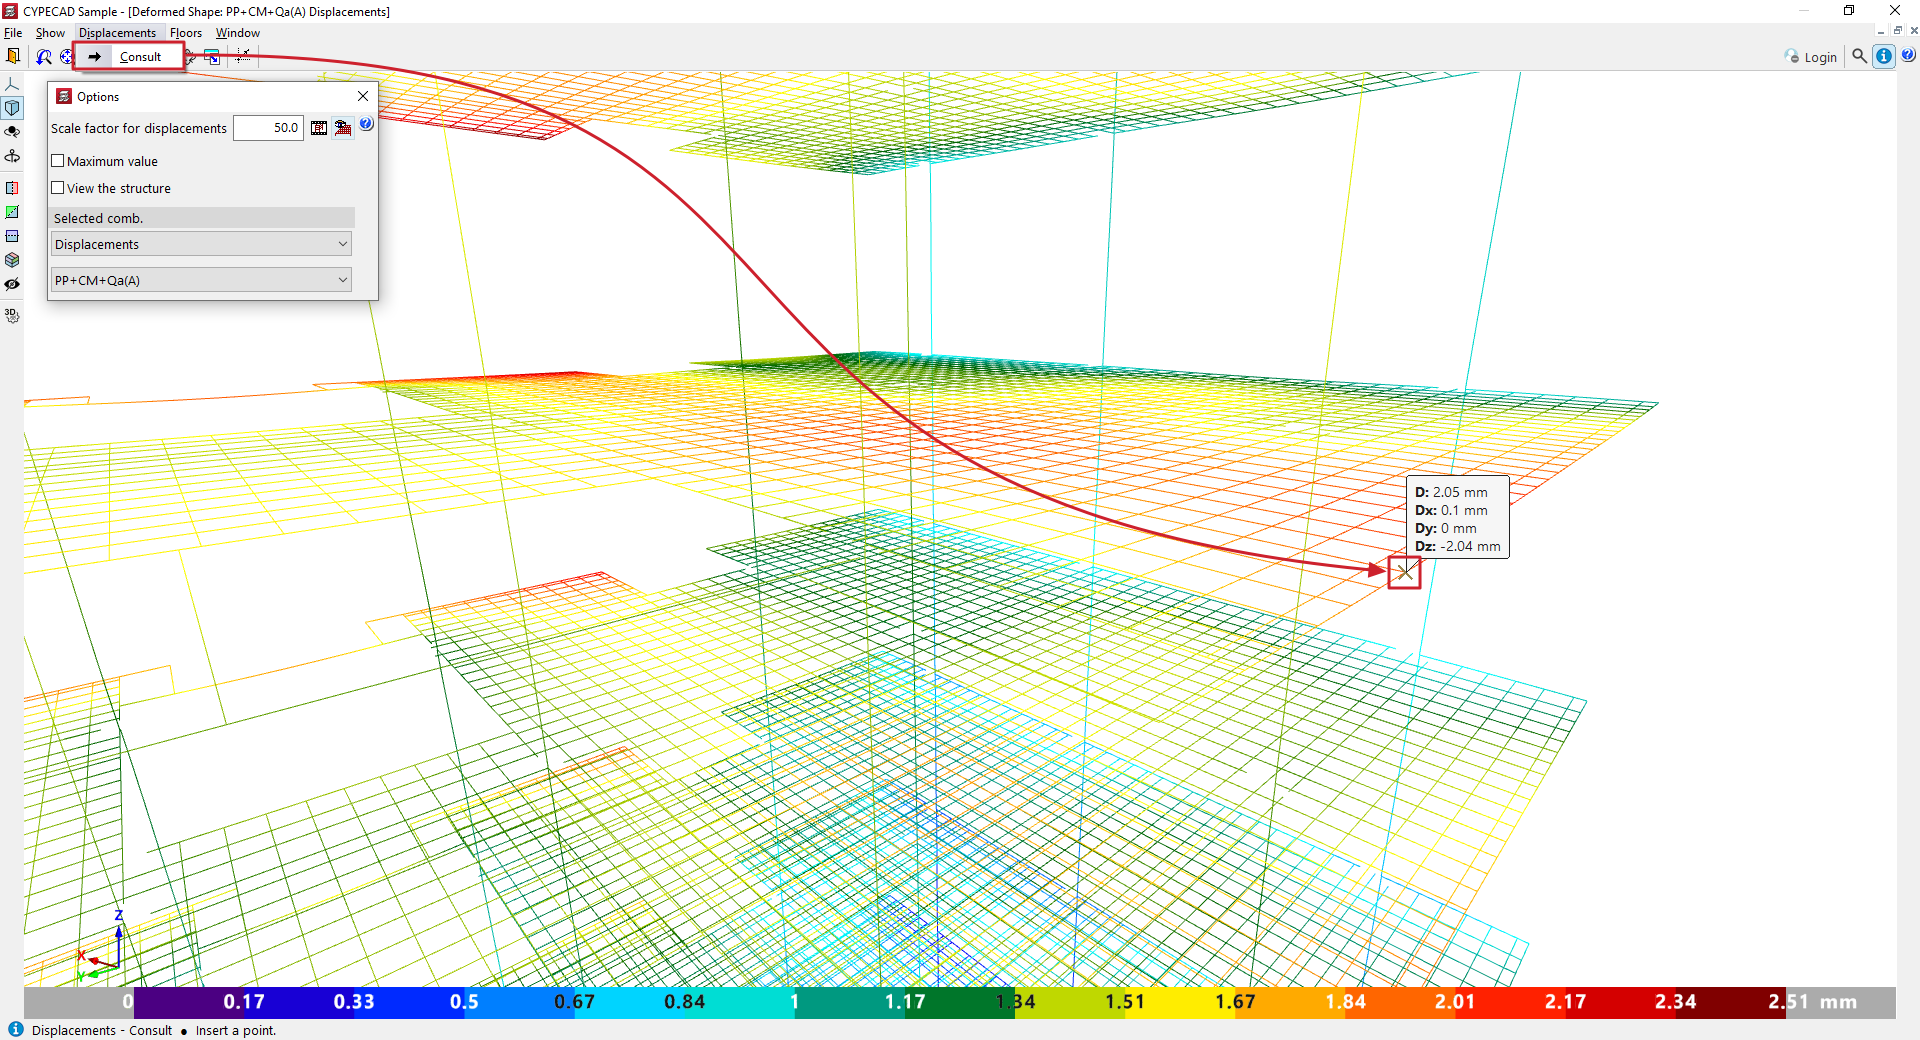
Checking displacements
In the "Displacements" menu at the top, you will find the "View" option. Once you click on it, you can hover the cursor over the elements of the analytical model to see the values associated with each point.
Choosing floors
In the "Floors" menu at the top, you will find the "Floor selection" option. When you click on it, a dialogue box appears with two drop-down menus that allow you to set the starting and ending floors you wish to view in the viewer. Upon accepting, the changes will be applied to the display, hiding any floors that are outside the selected range.
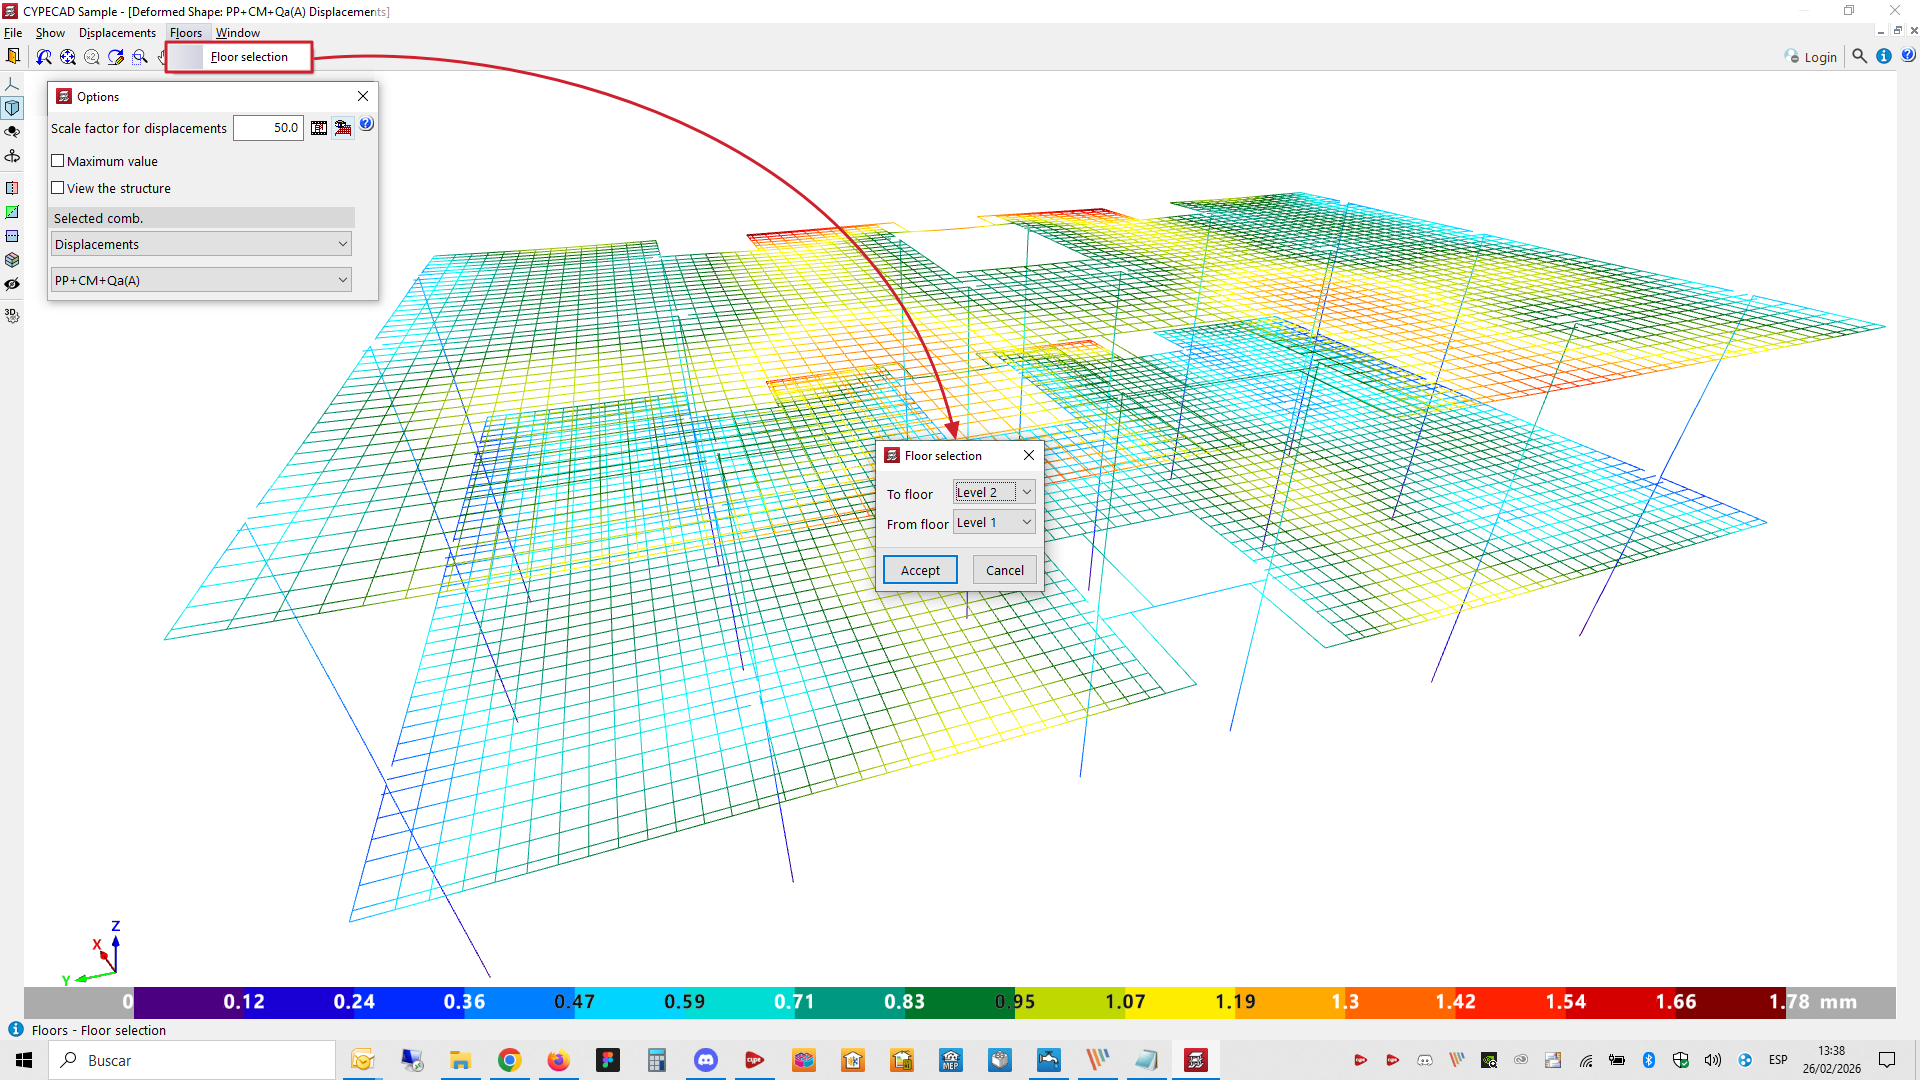
Table of contents
Complete your tour of CYPECAD by exploring the other available sections:
- Introduction
- Introduction and creating new jobs
- General data configuration
- Defining floors and groups of floors and inserting columns, shear walls and starts ("Column input" tab)
- Inserting beams, walls, floor slabs, foundation elements and special elements, and structural analysis (the "Beam Input" tab):
- Checking analysis results and editing elements (the "Results" tab):
- Options on the "Contour plots" tab
- Printing documents and exporting data
- More information:
- General features of CYPECAD