Checking the deformed shape and contour plots
The deformed shape and contour plots of the structure can be checked after carrying out the analysis using the specific option available in the "Stress / Strain" group on the top toolbar of the "Analysis" tab (within the "Structure" tab).

Deformed shape and contour plots in the active window
After clicking the "Deformed shape and contour plots" option, a pop-up window appears where you can view the deformed shape and contour plots of the elements visible in the currently active window.
The display settings for the different windows showing the deformed shape and contour plots are associated with each structural view in CYPE 3D. These settings are retained even when exiting the contour plot interface, and remain until the program is closed.
To exit the visualisation window, click the "Finish" option in the top-left corner.
"Options" window
Clicking the "Deformed shape and contour plots" option also opens the "Options" window, where you can configure what information to display:
Display options
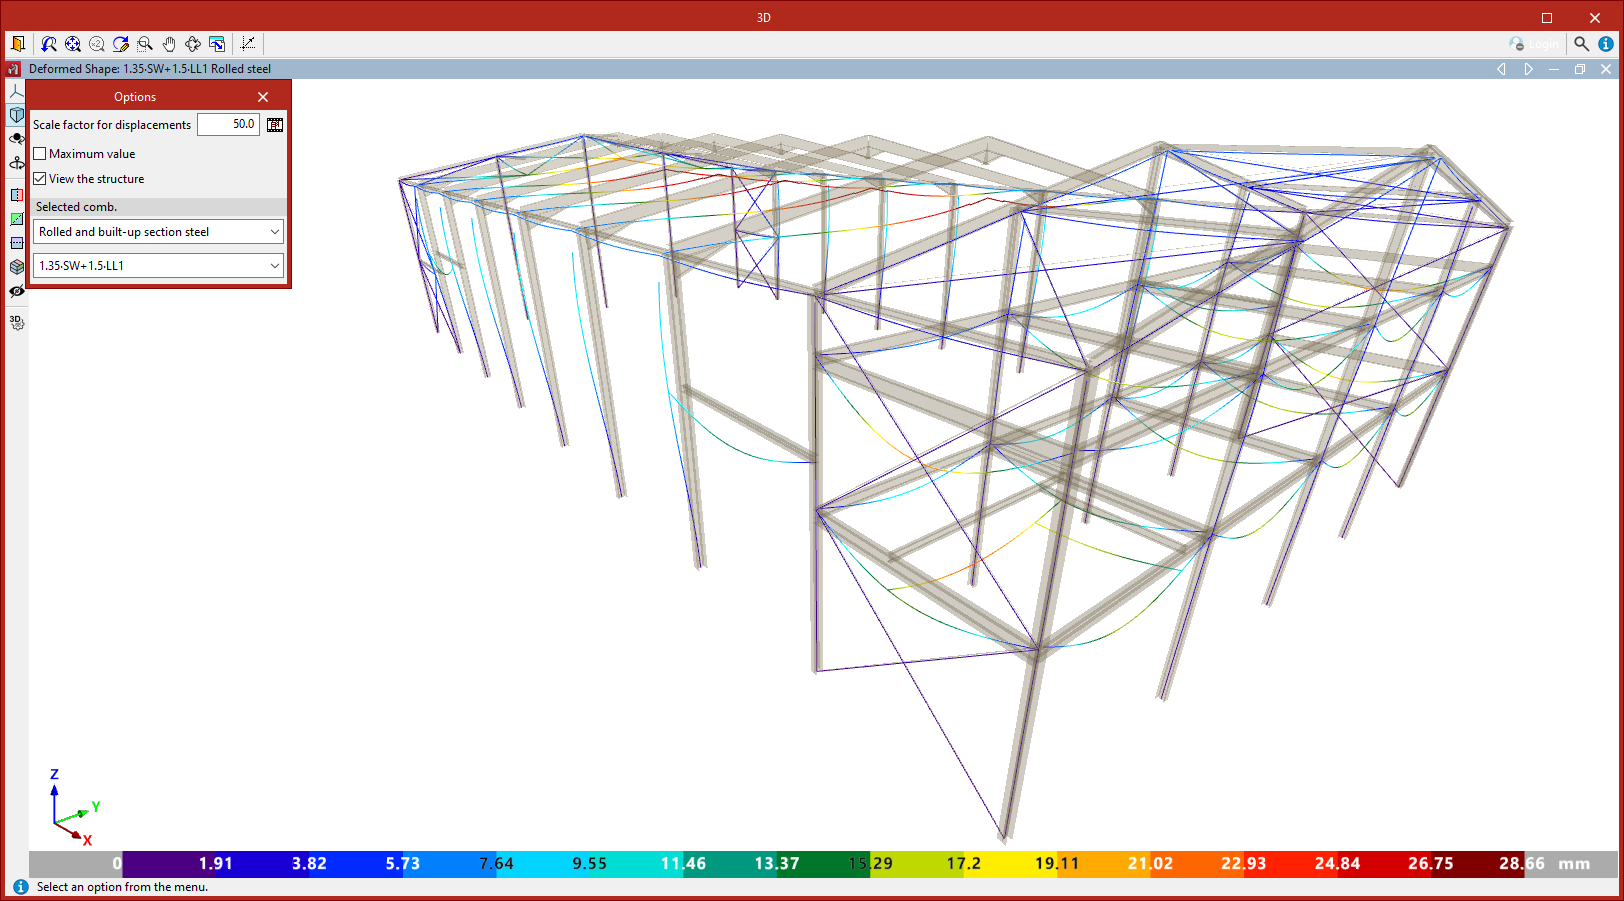
- At the top, enter a "Scale factor for displacements" to adjust the deformation scale shown in the viewer, making it easier to interpret.
- Further to the right, pressing the "Animation" option generates an on-screen animation of the structure’s deformed shape caused by the selected combination, starting from the undeformed position.
- If contour plots of shells are displayed, you can also change the "Colours for the representation of contour plots" by selecting a colour scheme from the available options using the button in the top-right corner of the "Options" window.
- By enabling the relevant checkbox, you can enter a "Maximum value" to be represented by the colour scale in the deformed shape. Any values above the specified limit will be displayed in grey.
- If the "View structure" checkbox is activated, a semi-transparent, realistic view of the structure is displayed alongside the deformed shape.
Selecting the loadcase or combination
In the "Selected combination" section at the bottom of the "Options" window, you must specify the particular load case or combination to view.
You may choose a "Single load case", selecting one from the dropdown list to view the deformed shape and contour plots associated with it.
The remaining dropdown options correspond to the different groups of load combinations defined in the model.
Checking the values at each point
In the top-right corner of the window is the "Check" option. After clicking it, you can move the pointer over elements of the structure to view values associated with each point.
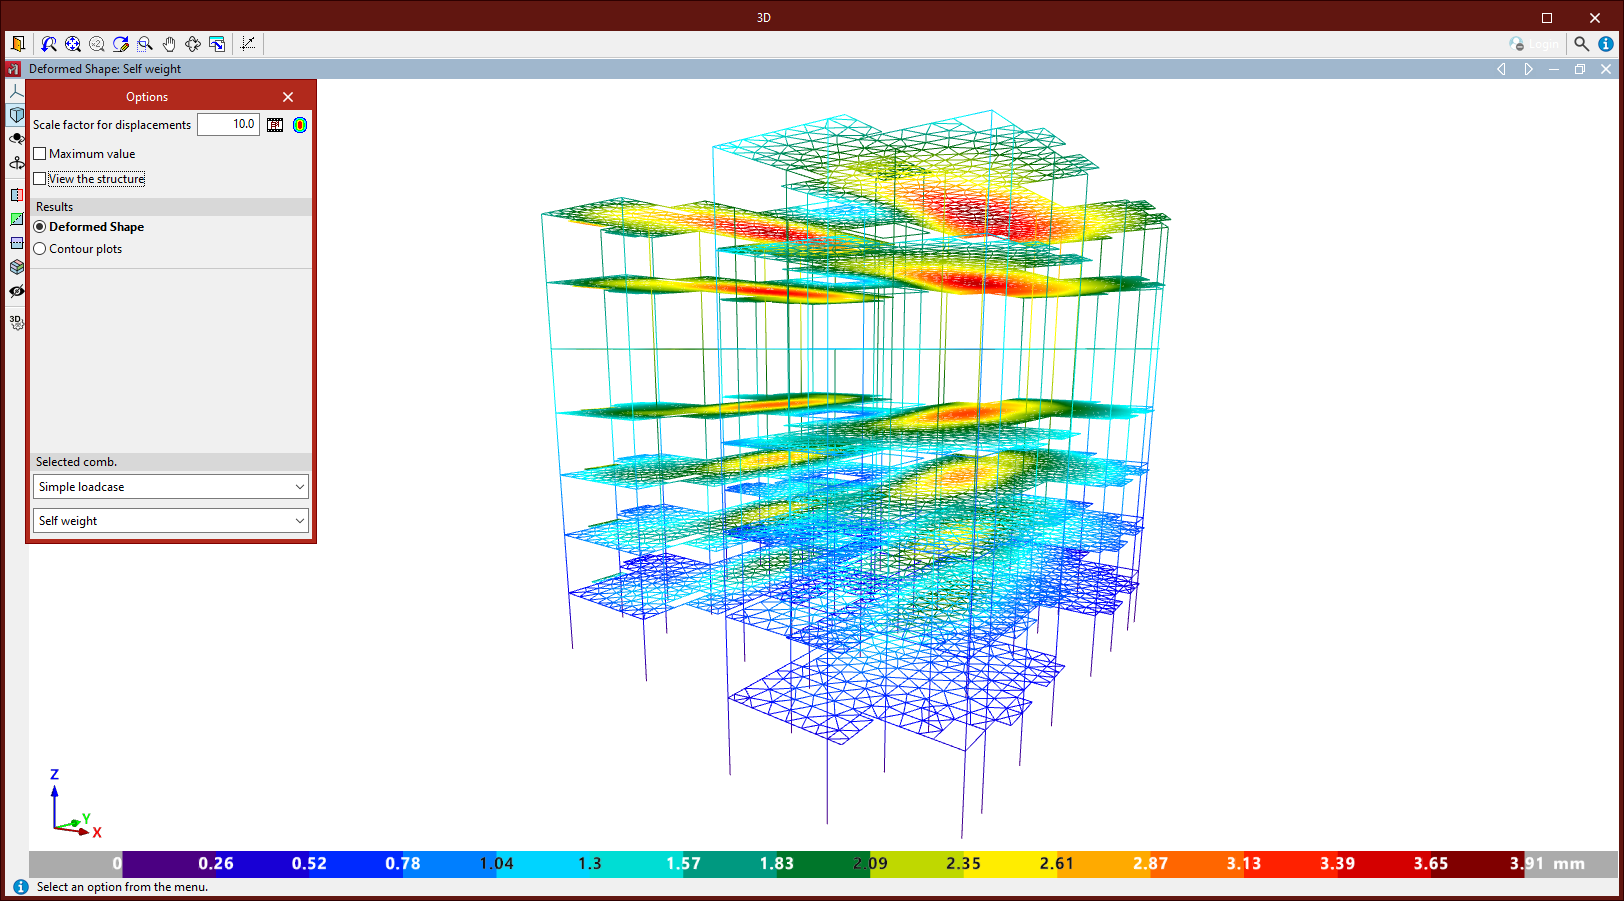
Checking the deformed shape
The "Result" section of the "Options" window only appears if shells have been entered into the structure and are visible in the active window.
Here, you can choose whether to display the "Deformed shape" of the structure or "Contour plots" of the shells.
If "Deformed shape" is selected, the deformation of the structural elements is shown for the selected combination.
If no shells have been entered or are not visible, the program defaults to displaying the deformed shape.
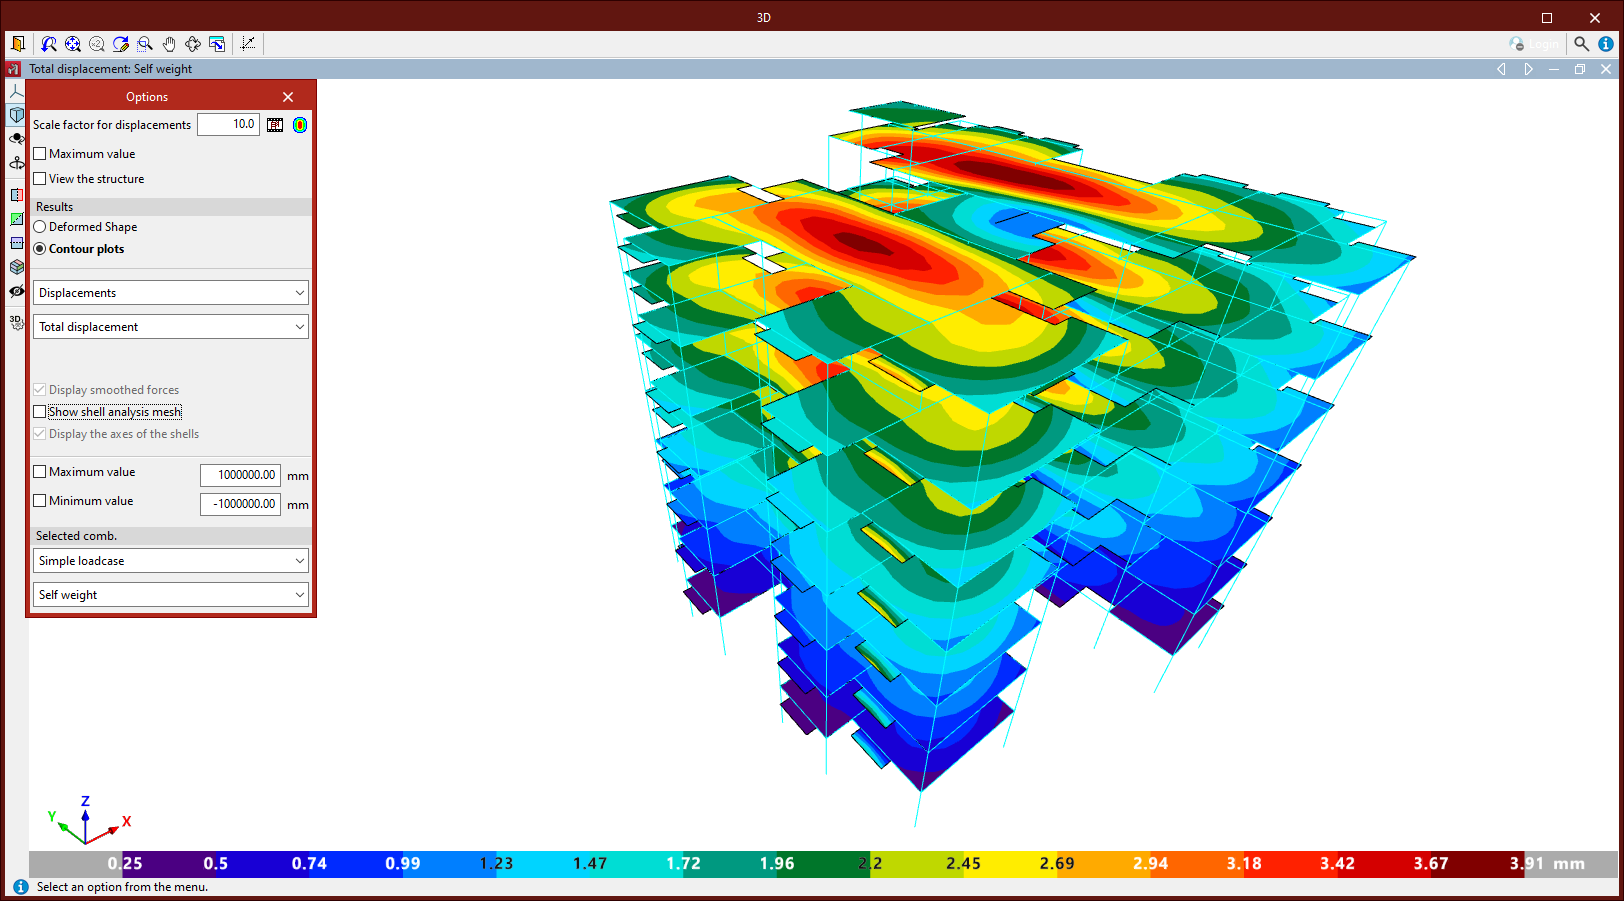
Checking the contour plots on shells
Selecting "Contour plots" in the "Results" section of the "Options" window allows you to view various types of shell element data through contour plots, depending on the dropdown selections:
- Selecting "Displacements" lets you view the "Total displacement", as well as displacements and rotations about the global X, Y, or Z axes.
- Under "Forces", you can view axial forces in X, Y, and XY, bending moments in X, Y, and XY, and shear forces in X and Y. These refer to the local axes of the shell.
- Under "Stresses", you first choose whether to view data from the "Top face", "Bottom face", "Maximum of both faces", "Minimum of both faces", or "Absolute maximum of both faces".
Then, in the second dropdown, you can choose from normal stress in X or Y, shear stress in XY, XZ, or YZ, "Maximum normal stress", "Minimum normal stress", "Von Mises stress", or "Maximum shear stress". Again, these refer to the local axes of the shell.
Additional options include "Show smoothed forces", "Show mesh", "Draw shell axes", all activated via checkboxes at the bottom.
You can also enable the "Maximum value" and "Minimum value" checkboxes to define the display range limits for contour plots. Values outside these limits are shown using the colours at the extremes of the selected colour scheme.