
Diagrams of soil pressure in footings
The soil pressure diagrams at the base of the footings can be consulted in CYPECAD and CYPE 3D. This makes it possible to evaluate the suitability of the solution adopted for the foundation, as well as the distribution of loads on the ground and the behaviour of each footing.
- In CYPECAD, the "Stresses at the base of the footings" option can be used to view the stress diagrams at the base of all footings and is located in the "Foundation" menu, visible in the "Beam definition" and "Results" tabs. The stress diagram at the base of each footing can also be accessed through its editing menu (from "Foundations", "Foundation elements", "Edit"), by clicking on the "Stresses" option.
- In CYPE 3D, from the "Foundation" tab, it is also possible to access the stress diagram at the base of each footing through its editing menu (from "Foundation elements", "Edit"), by clicking on the "Stresses" option.
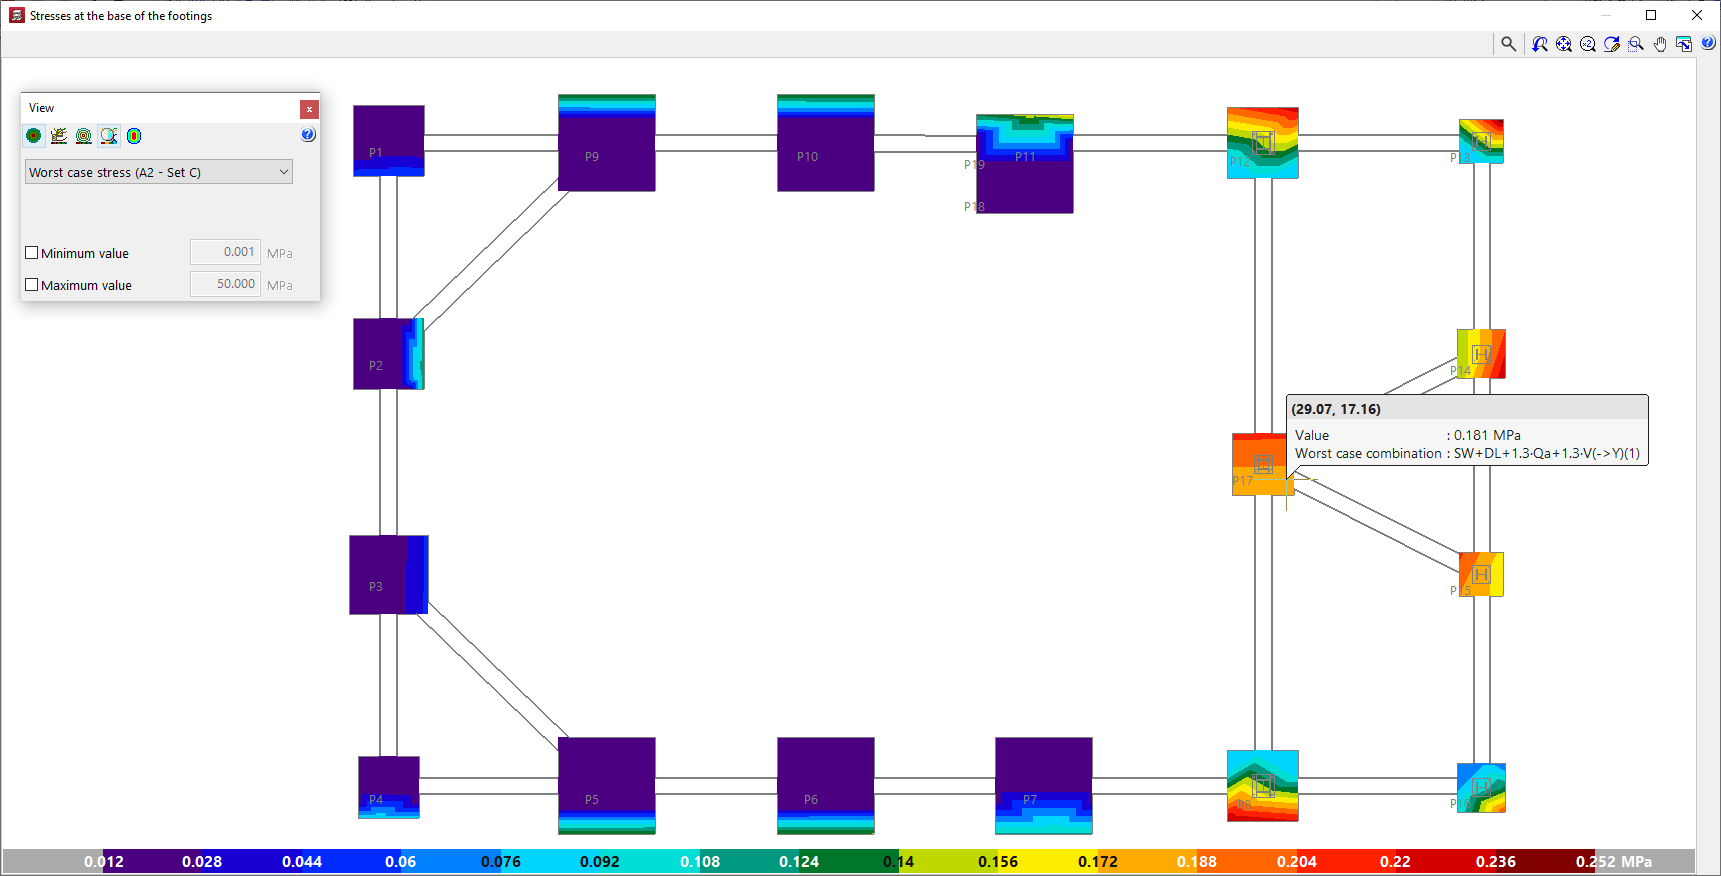
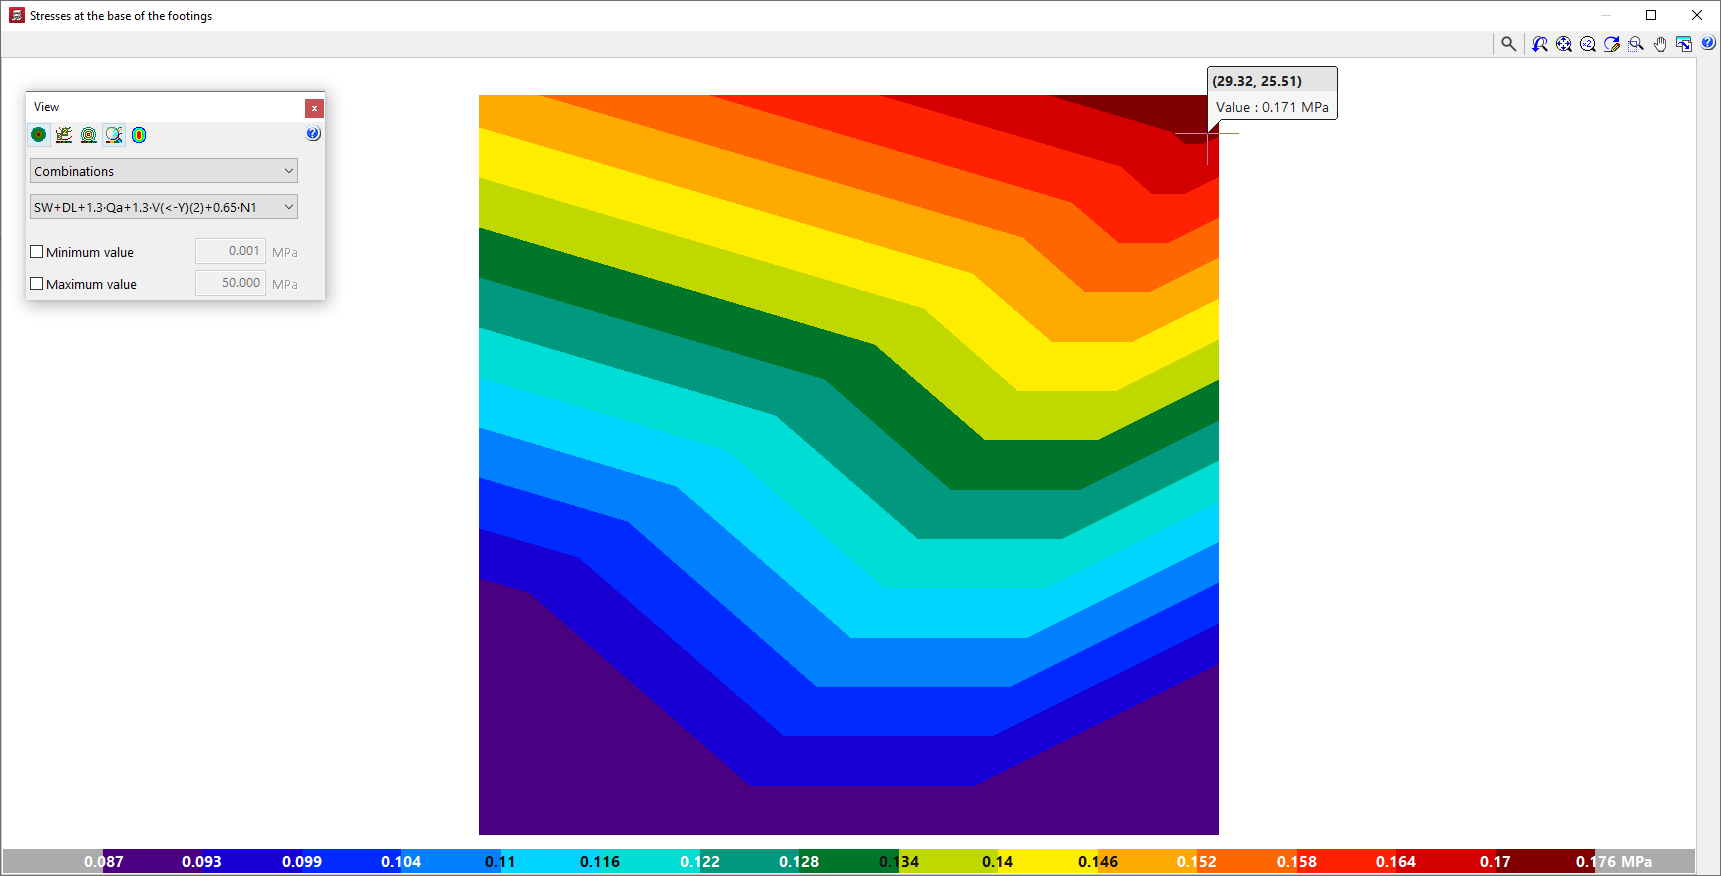
In either case, the program opens a consultation window showing the stress diagrams at the base of the footings with a colour gradient. The colour scale at the bottom acts as a legend and indicates the values represented in the diagram.
This representation is similar to the one used in CYPECAD in the "Contour plots" tab for checking the results of slabs and waffle slabs.
In addition, by hovering the cursor over each point in the diagram, the program displays an information text with the coordinates of the point, the value of the voltage shown at that point and, as the case may be, the combination in which it occurs.
Stress diagram display settings
The floating window is used to adjust the display of the stress diagrams by means of the following options:
- The following options are available at the top:
- The "See contour plots", "See contour lines with values" and "See isolines without values" options can activate the display of the information in the indicated formats.
- Alternatively, users can "Automatically scale when zooming in" so that colours, lines and values displayed on the screen are adjusted according to the visible area when zooming in.
- Optionally, the "Colours for the representation of contour plots" can be modified, including the range and number of colours.
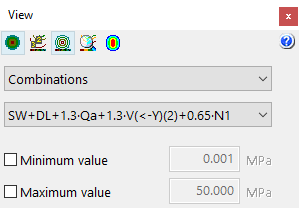
- Worst case / Combinations / Maximum
In this drop-down menu, users select whether the following voltage values are to be displayed or not:- Worst case
Displays the worst-case stress of any combination at each point. At each point, the stress shown may belong to a different combination. - Combinations
Displays the stresses of a particular combination chosen by the user, to be selected in a second drop-down. - Maximum
Displays the results of the combination resulting in the maximum stresses.
- Worst case
- Minimum value / Maximum (optional)
- By activating these boxes and entering a numerical value in the corresponding fields, the minimum and maximum values of the colour gamut range of the representation can be set.