Results output
Checking results on screen
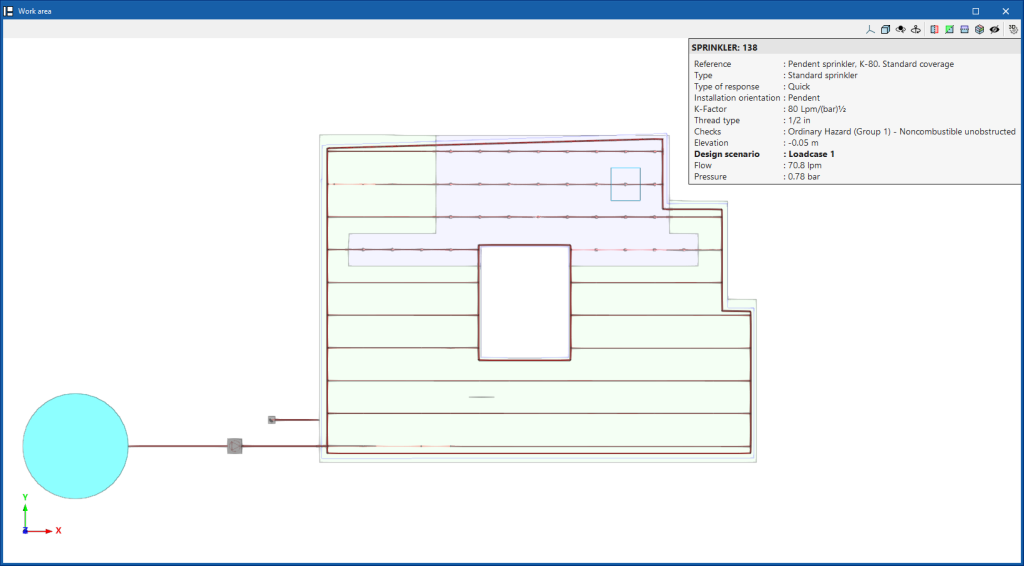
After carrying out the analysis, the program displays the results in the tooltip or information text that appears when the cursor is hovered over an element in the system. To do this, the "Show information texts" option in the top right-hand toolbar must be checked.
Checks in the editing panel
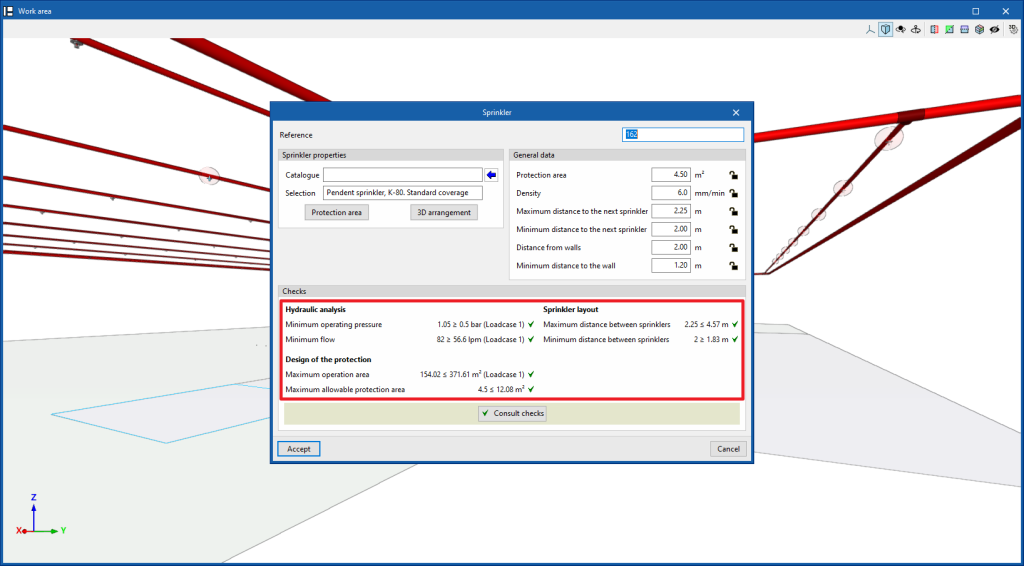
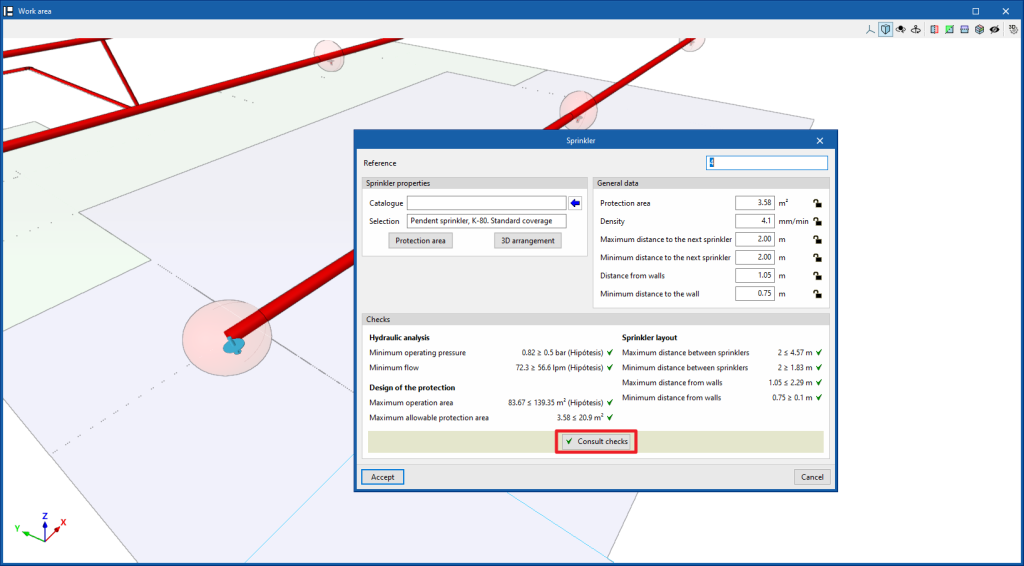
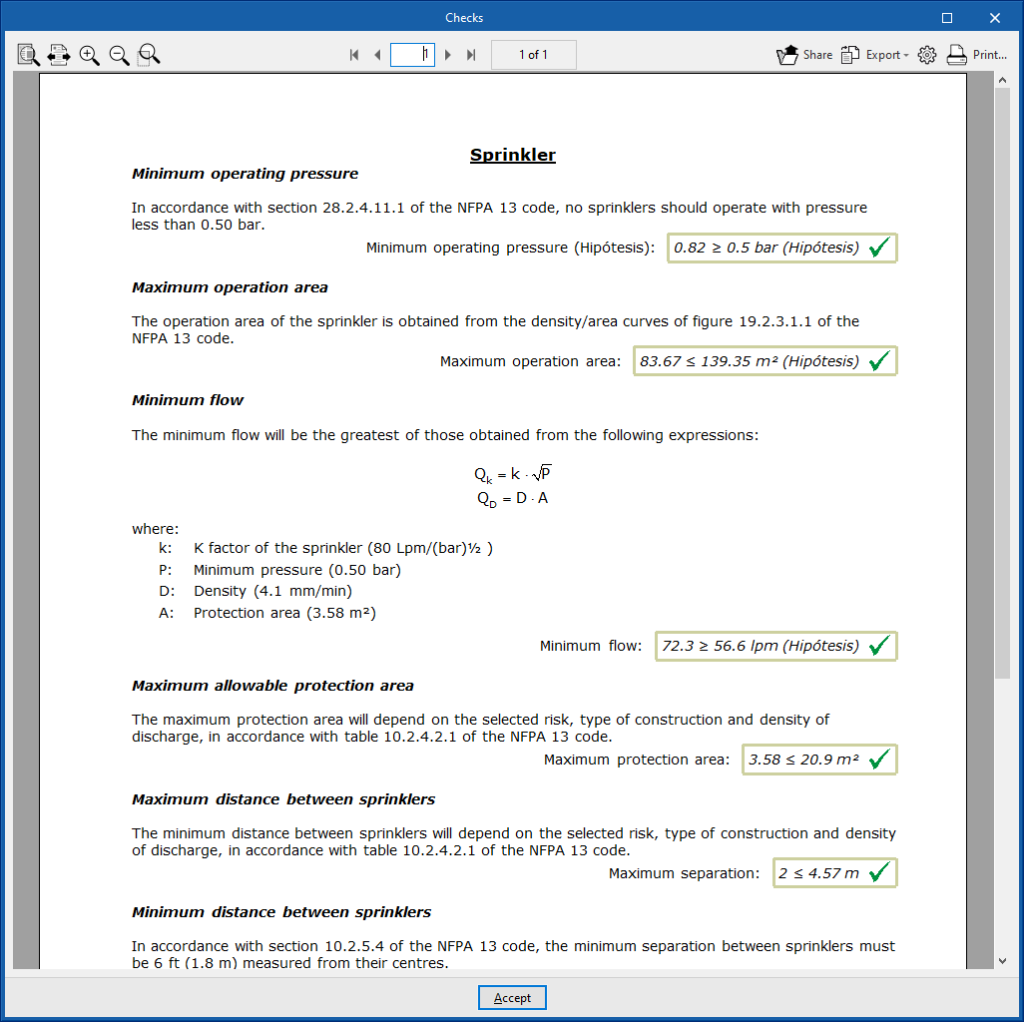
The program also displays the "Checks" of the last analysis performed in the corresponding section of the editing panel for each element, as well as its compliance status.
Graphical analysis of the results
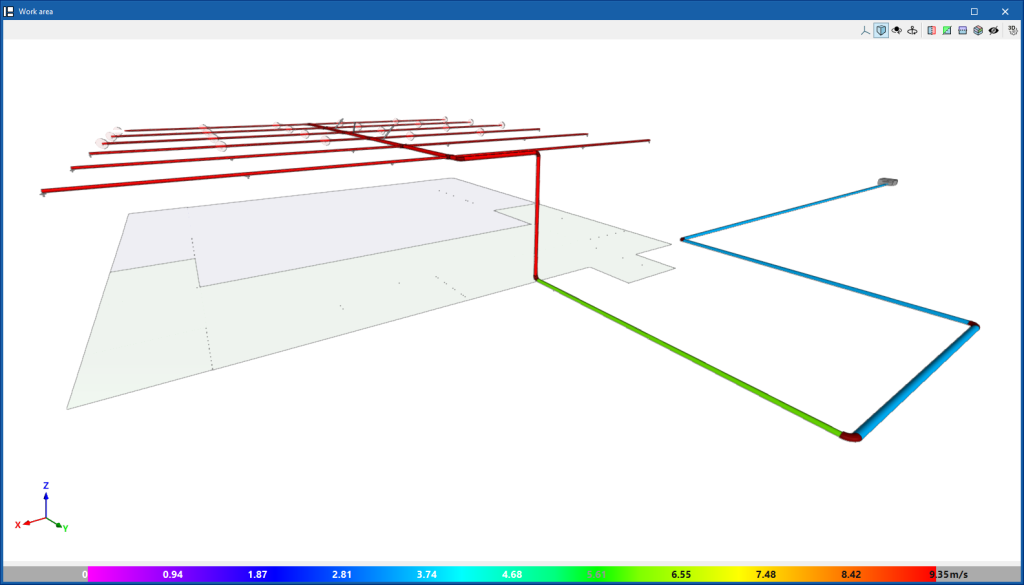
Using the "Graphical analysis of the results" option in the "Calculation" group of the main toolbar, the calculated values of different quantities are displayed with the spans of the water distribution system marked with colours.
By default, the program displays the minimum and maximum values of each factor obtained in the calculation for the entire system. However, the colour scale can be adjusted according to the specific ranges of minimum and maximum values defined in the corresponding dialogue box.
The results available in the graphical analysis of results are as follows:
- Flow rate
- Velocity
- Pressure loss
- Length
- Head
Job reports
The program can also print the following reports directly with the printer or generate HTML, PDF, TXT, RTF or DOCX files:
The reports are obtained via the "Reports" option in the "File" menu or via the specific option at the top left of the interface.
- Project
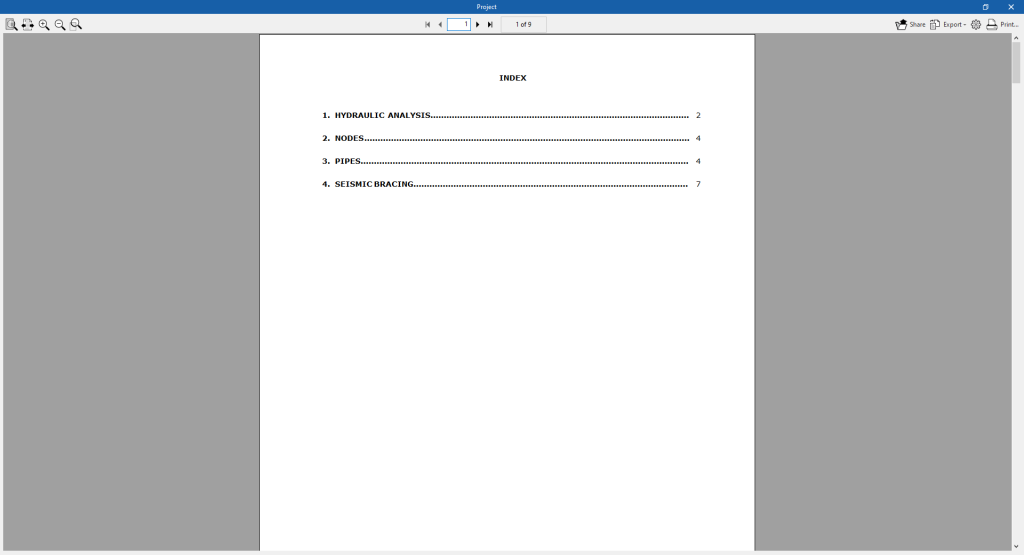
Displays a project report that includes the following sections:- Index
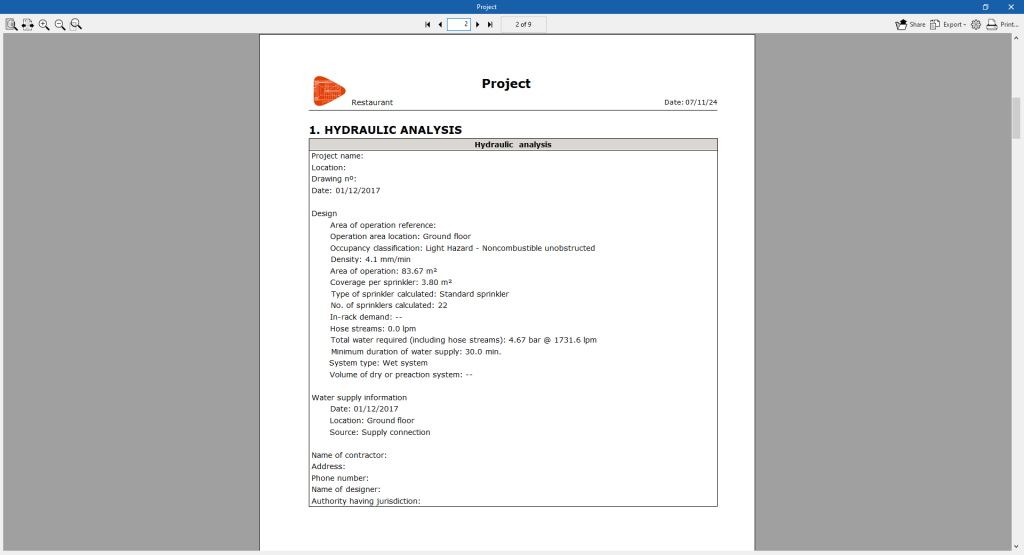
- Hydraulic analysis
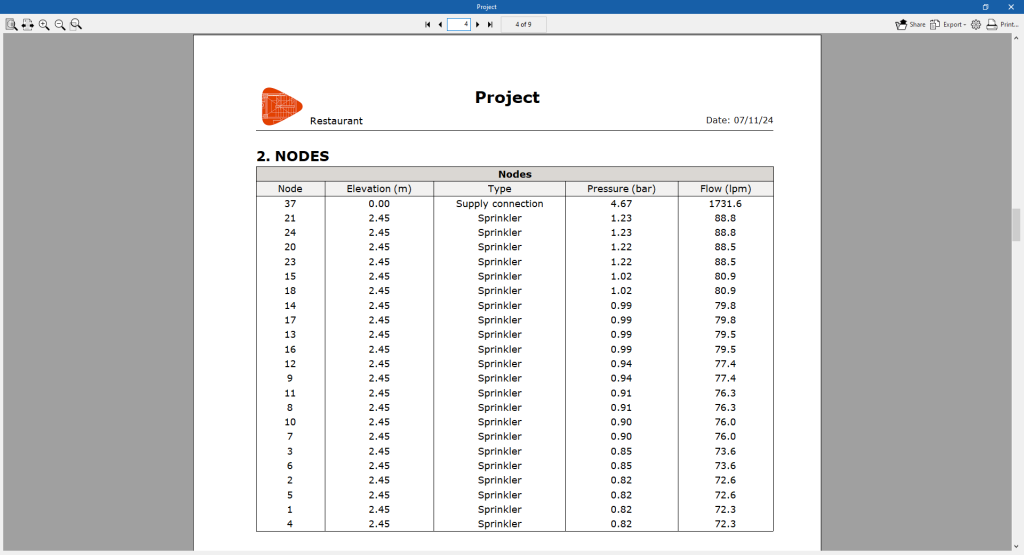
This includes the general data of the project and the flow/pressure graph of the system. - Nodes
- Node reference.
- Elevation of the node.
- Type of node.
- Flow in the node.
- Pressure in the node.
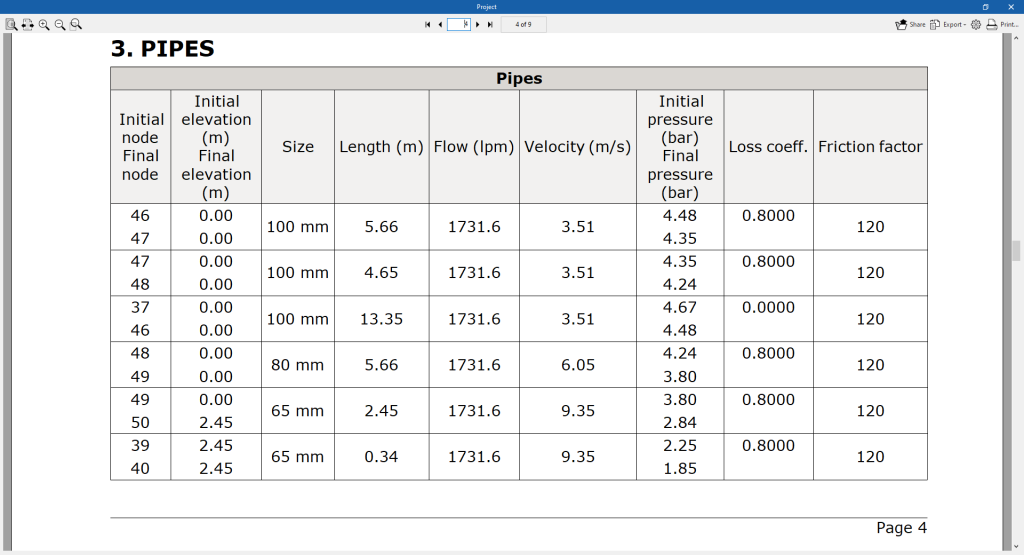
- Pipes
- Reference of the initial and final nodes.
- Initial and final elevation.
- Diameter.
- Length.
- Flow and velocity of the flow.
- Initial and final pressure.
- Loss coefficient.
- Friction factor.
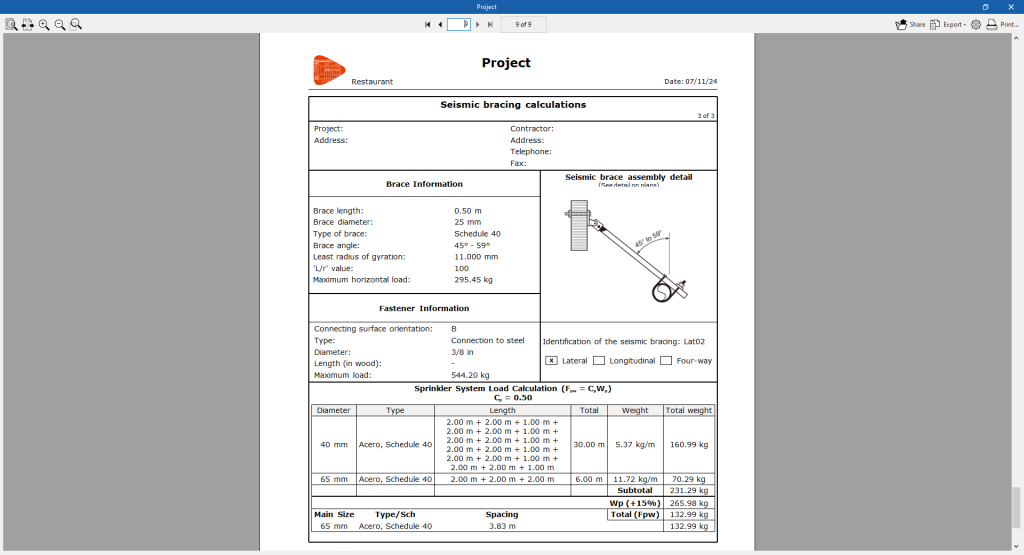
- Seismic bracing
Justification sheets of the seismic bracings provided.
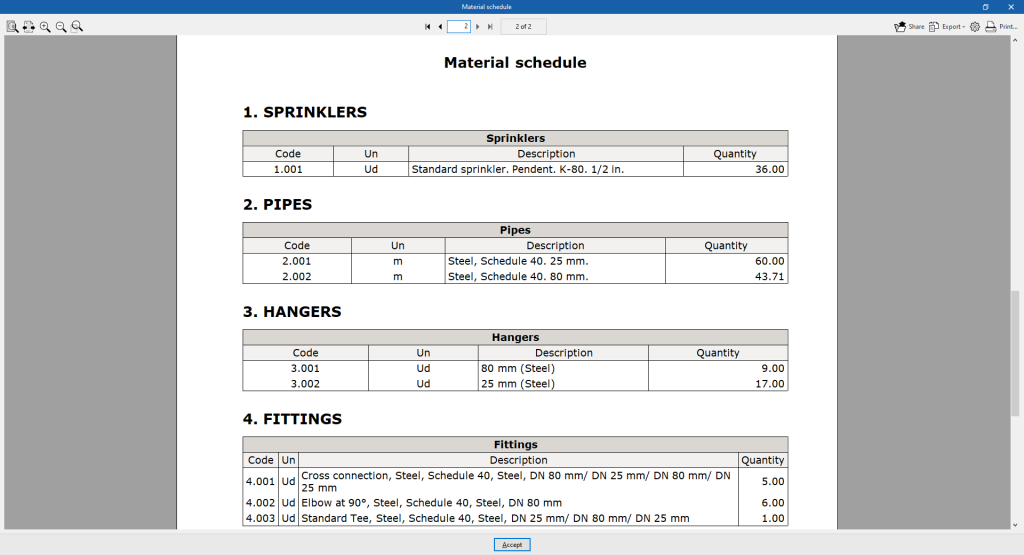
- Material schedule
Displays the material schedule with the measurement of the elements arranged in the system.
Drawings in DWG, DXF or PDF format
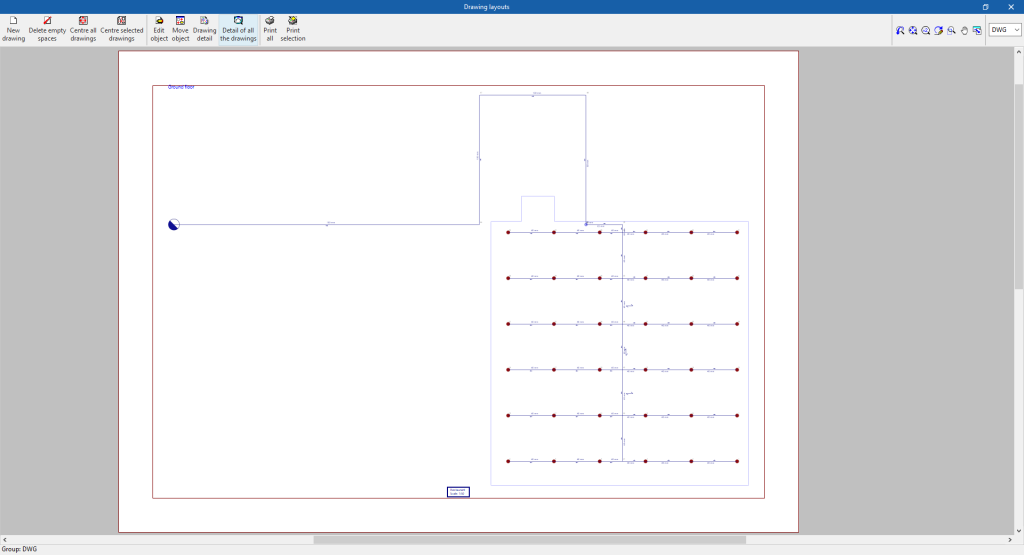
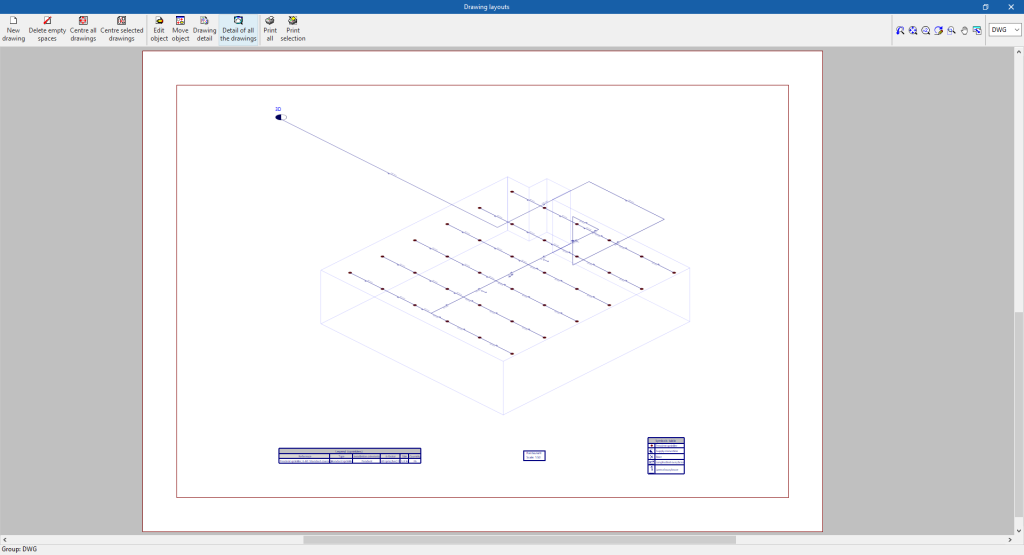
This allows users to print the job drawings of the single-line diagram on any graphic peripheral that is configured on the computer, or to create DWG, DXF or PDF files.
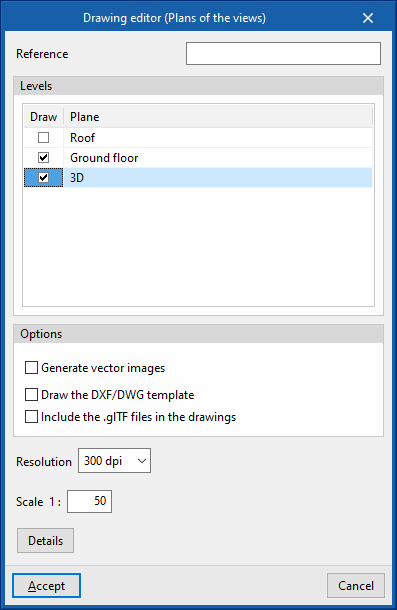
The following options can be configured when editing the drawing:
- Views to be drawn
- Options
- Generate vector images
- Draw the DXF/DWG template
- Include .glTF files in drawings
- Resolution
- Scale
- Details
The drawings can be obtained through the specific option at the top left of the interface or through the "Drawings" option in the "File" menu.
Results of the "Bill of quantities" tab
If the work is completed in the "Bill of quantities" tab, the following documents can be obtained from the program:
- Exporting the bill of quantities in FIEBDC-3 (BC3) format.
- Bill of quantities reports (in HTML, PDF, TXT, RTF or DOCX format).
Files supported by BIMserver.center
When a project is exported to the BIMserver.center platform, a 3D model is automatically exported in GLTF format for the integration of the installation model in the Open BIM project, allowing its visualisation:
- On the online platform;
- In the BIMserver.center app for iOS and Android.
- In virtual reality and augmented reality;
- In other CYPE programs.

