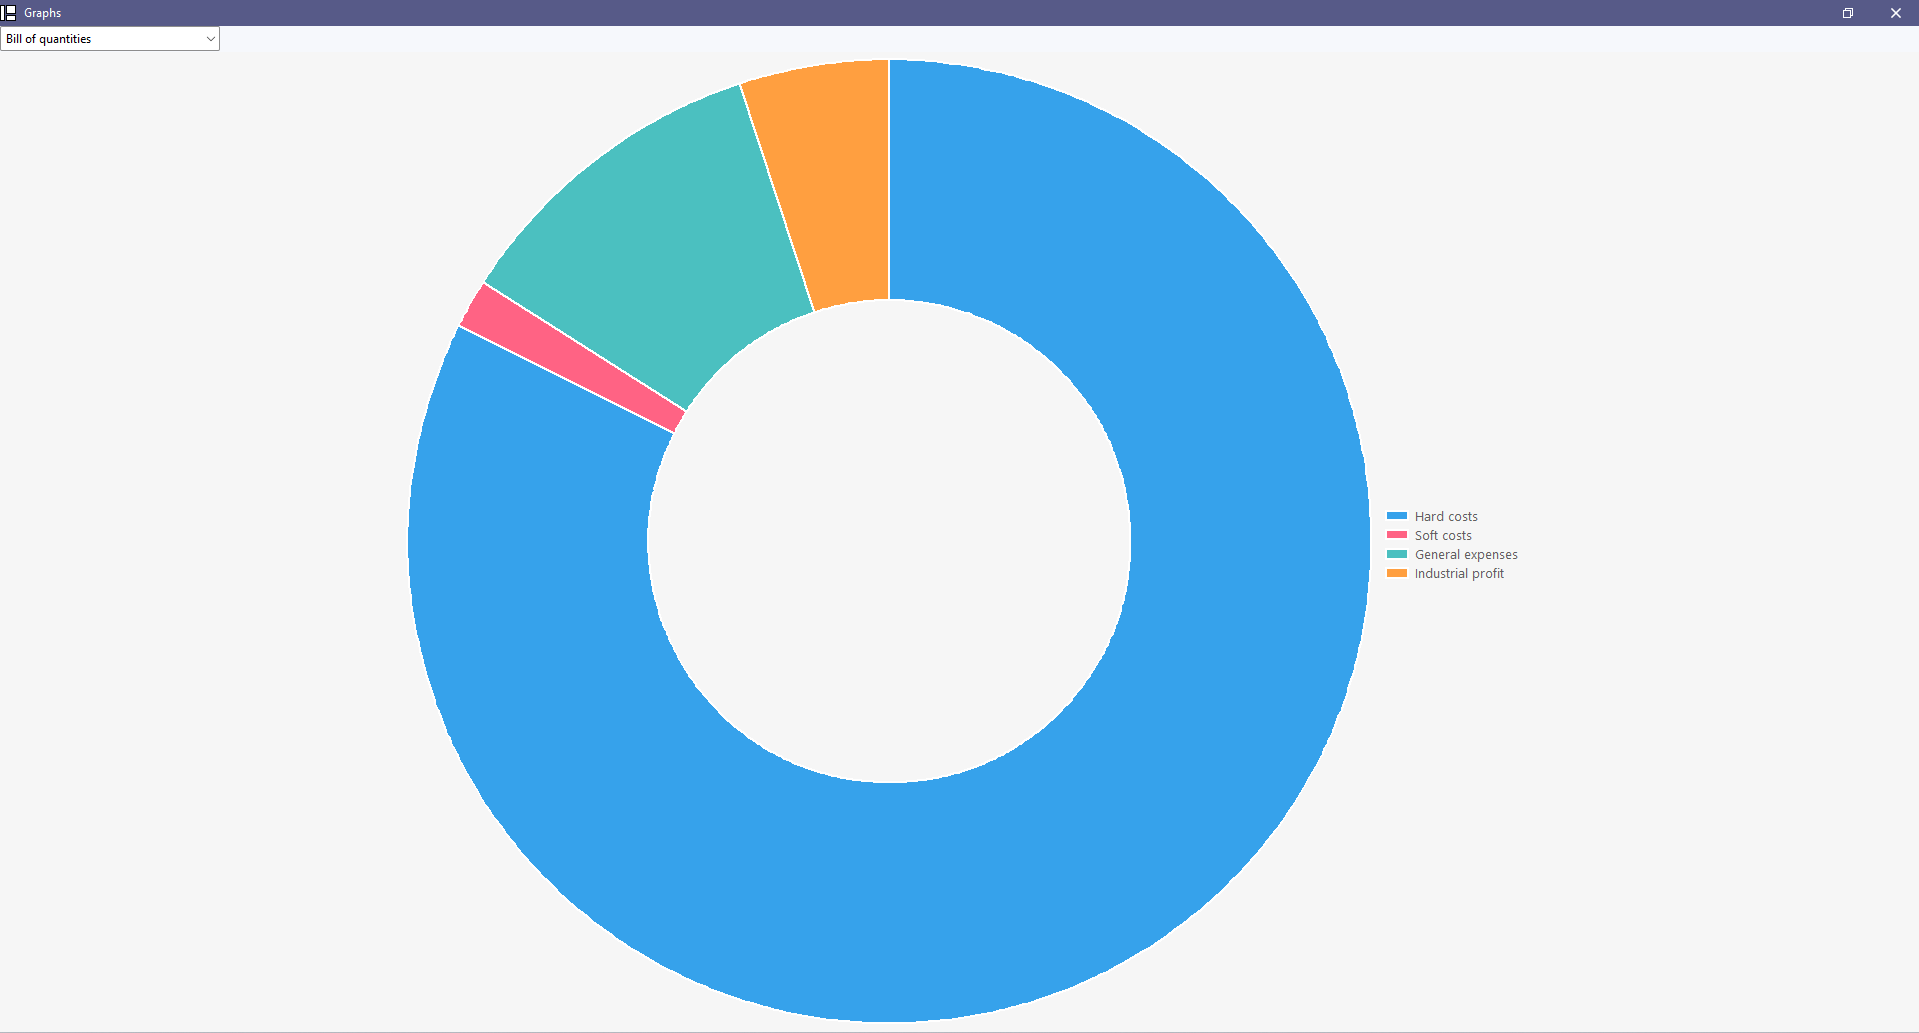


Graphical representation of the bill of quantities
The bill of quantities data can be viewed graphically from the “Graphs” section of the “Bill of quantities” tab.
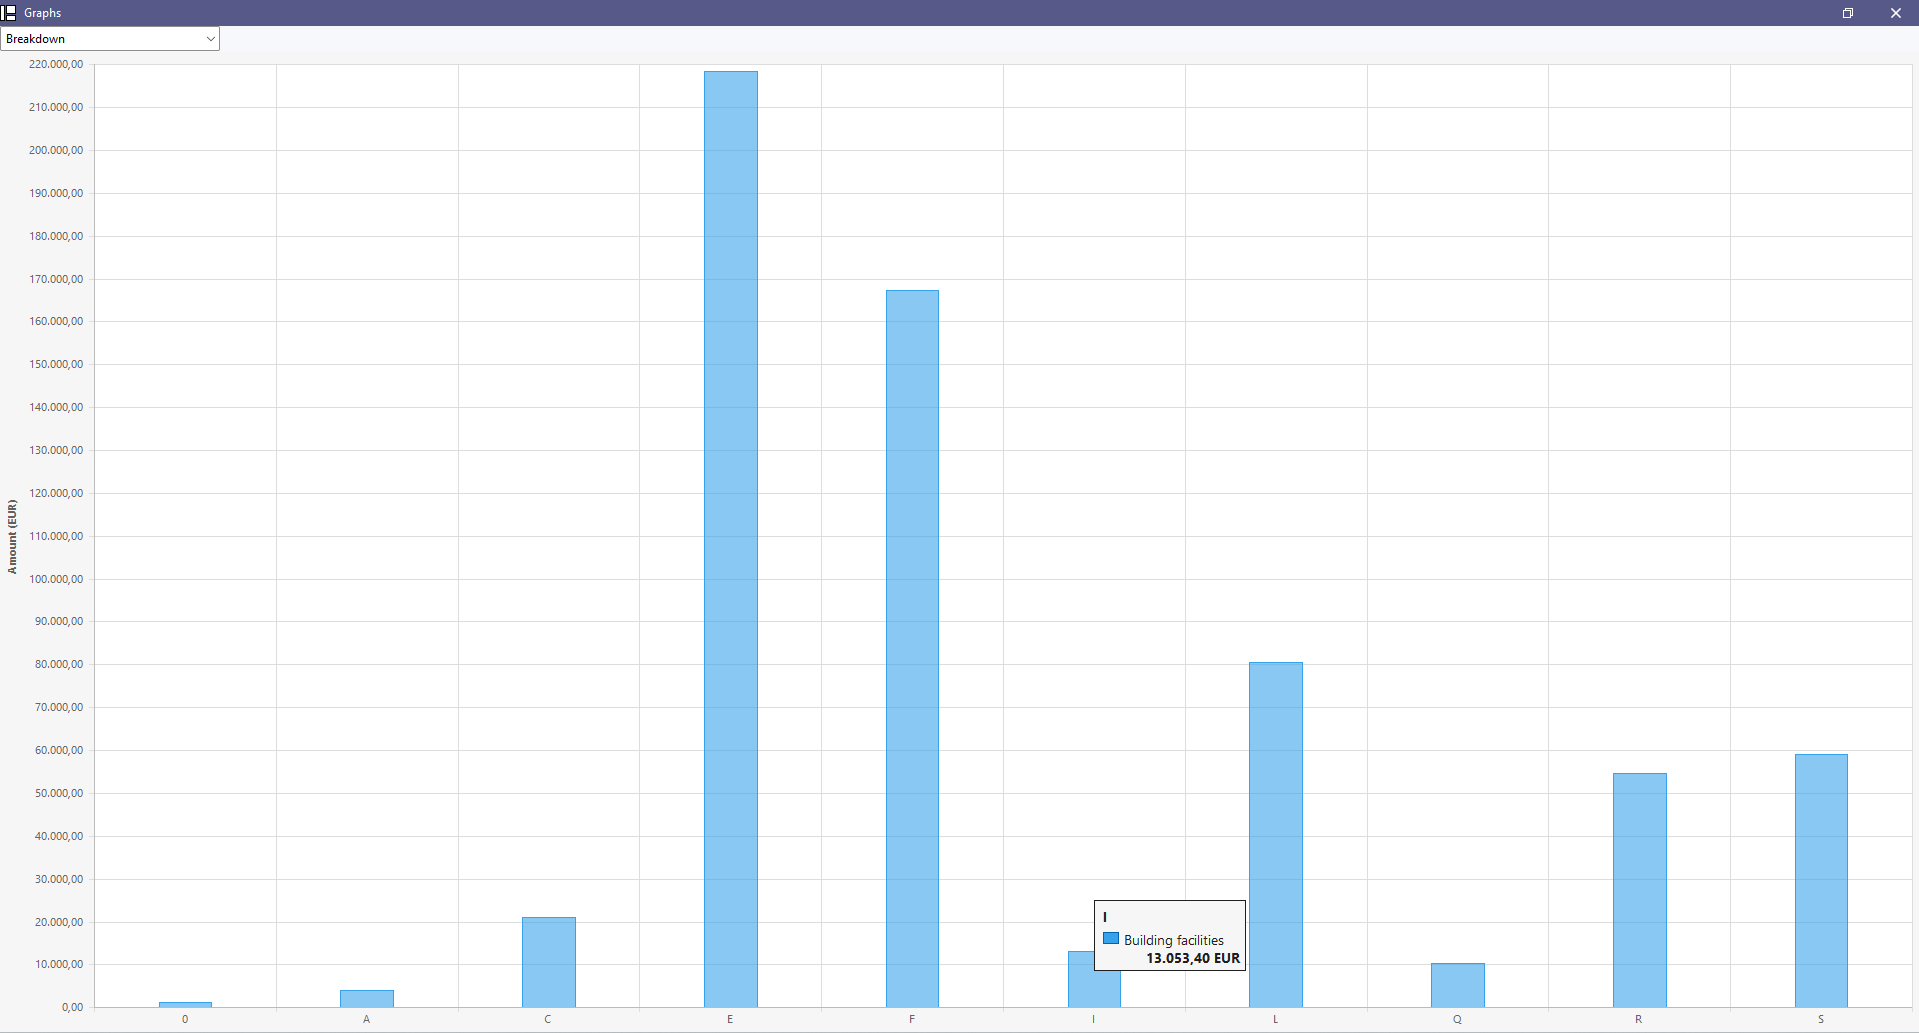
In this section, there is a dropdown list where the graph to be displayed (columns, rings, lines, etc.) can be selected for the following concepts:
- Bill of quantities
- Breakdown
- Breakdown (with/without BIM link)
- Energy cost
- CO2 emissions
- Waste mass (Type)
- Waste volume (Type)
- Waste mass (Code)
- Waste volume (Code)
- Certificates (Amount)
- Certificates (Quantity)
The graph generated depends on the component of the bill of quantities table selected. By hovering the mouse over a section of the graph, a box will appear with the parameter reference and its value.