
Creating and using Gantt charts
With Arquimedes users can create the job planning and the payment plan (foreseen investments) of a project or economic proposal based on an approved bill of quantities. This tool can be used to generate various Gantt charts based on the organisation by work sections, work sub-sections and items in the bill of quantities, as well as to draw up a work schedule and link the different tasks to one another. Once the chart has been created, the critical path and the chronograms corresponding to labour and machinery can be obtained.
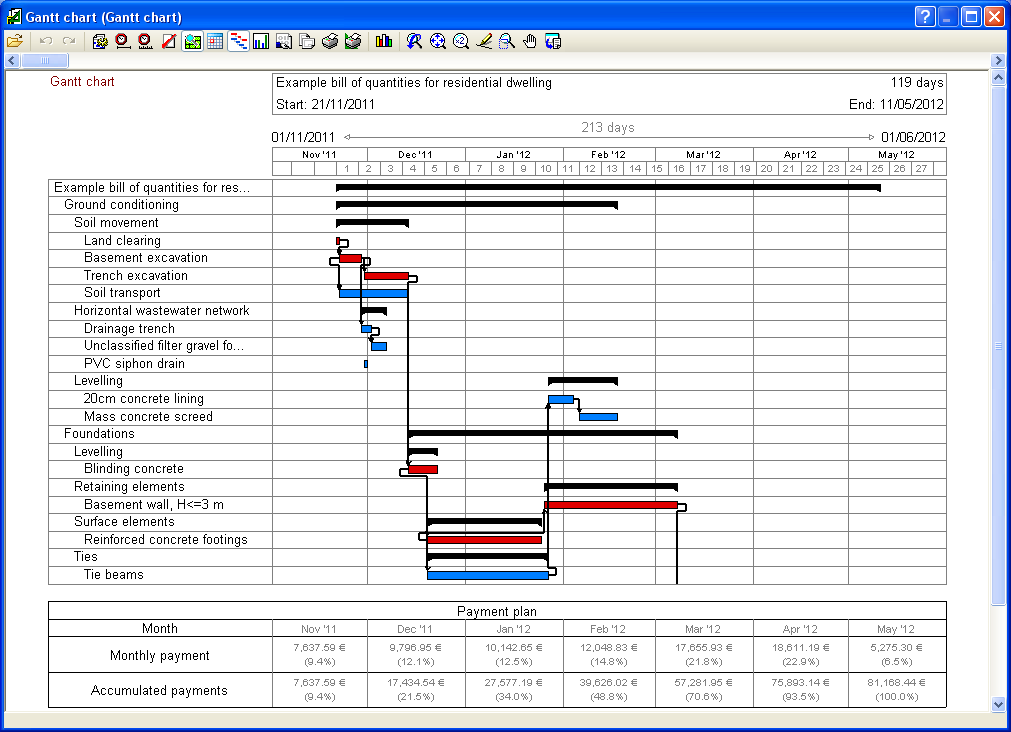
Once the diagram has been created and after a quick set-up (name of the chart, general information, calendar, etc.), the time for each task can be scheduled, either manually or by entering the daily performance that is calculated on the basis of the work designated for each task. Then, tasks can be moved, split or deleted, and dependencies can be established between them. Once these dependencies have been created, the critical path can be viewed on the Gantt chart in red.
Economic monitoring by job tasks
The payment plan is shown as a table below the chart. This table contains the same columns as the chart as well as two payment rows (monthly payments and accumulated payments) that show the amounts and percentages for each month. This plan, also called monthly investment, corresponds to the monthly estimate of the sum of task amounts per month. Amounts to be spent on tasks are defined when the time-activity chart is created.
The payment plan can be displayed on a graph: the investment curves. Two functions are drawn representing the monthly and accumulated payments. It can be exported to HTML, DXF and DWG formats.

Economically monitoring the job allows for economic quantification of the job at a given point in time. To do this, the work carried out on the reference date must be calculated in situ. Users simply have to indicate the initial or partial quantities executed at any given time and the software will automatically carry out an economic follow-up of the job.
In Arquimedes, the steps to be followed are entering the data to establish the periodic closure of the tasks or the recording of the initial or partial quantities during the period of the economic monitoring of the tasks during the construction work.
Printing and exporting
Detailed reports can be printed and exported in PDF, DOCX, RTF or HTML, DXF or DWG, XML or MPX (Microsoft® Project) format.