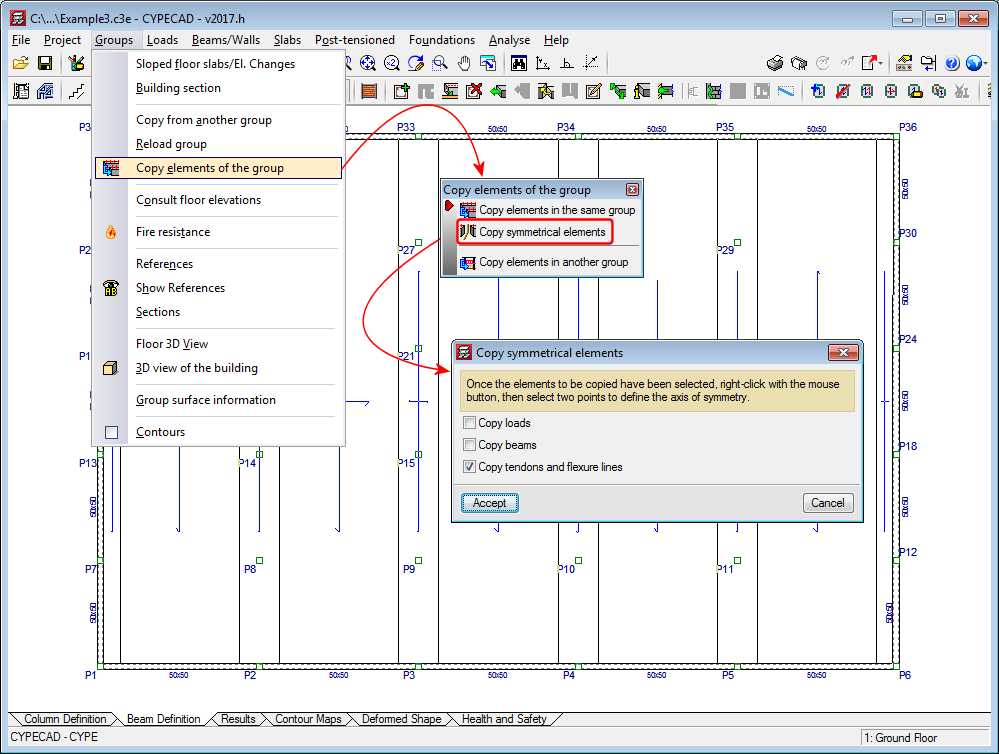
Options have been added to copy post-tensioned elements. These have been included in the “Copy elements of the group”, “Copy symmetrical elements” and “Copy elements in another group” dialogue boxes.

Options have been added to copy post-tensioned elements. These have been included in the “Copy elements of the group”, “Copy symmetrical elements” and “Copy elements in another group” dialogue boxes.
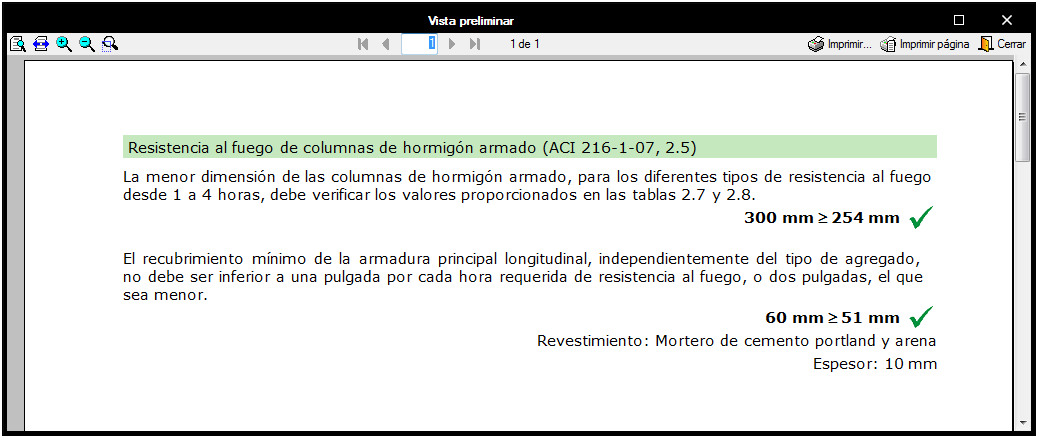
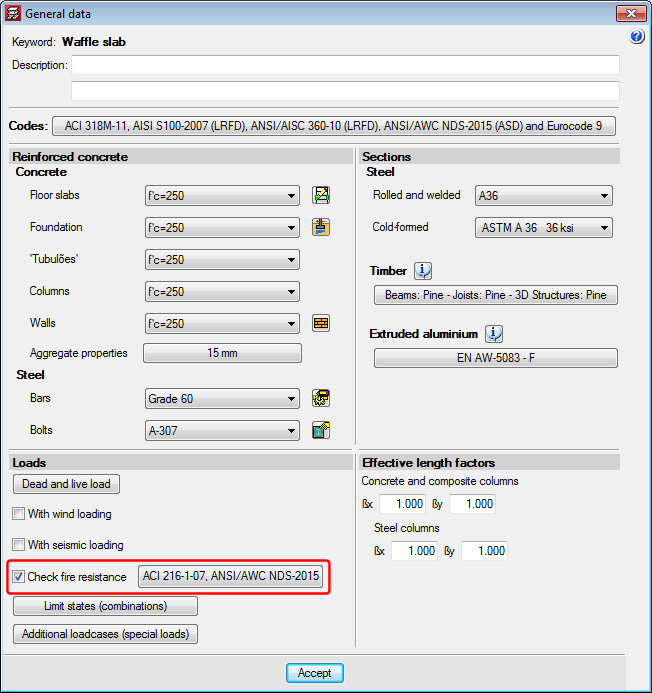
The ACI 216.1-07 code (Code Requirements for Determining Fire Resistance of Concrete and Masonry. Construction Assemblies) has been implemented in CYPECAD.
The checks of the ACI 216.1-07 code are carried out automatically when users activate the Check fire resistance box and have selected one of the ACI concrete codes: CIRSOC (Argentina), NSR-10 (Colombia), the ACI code itself, etc.).
As occurs with other codes that have been implemented, with the ACI 216.01-07:
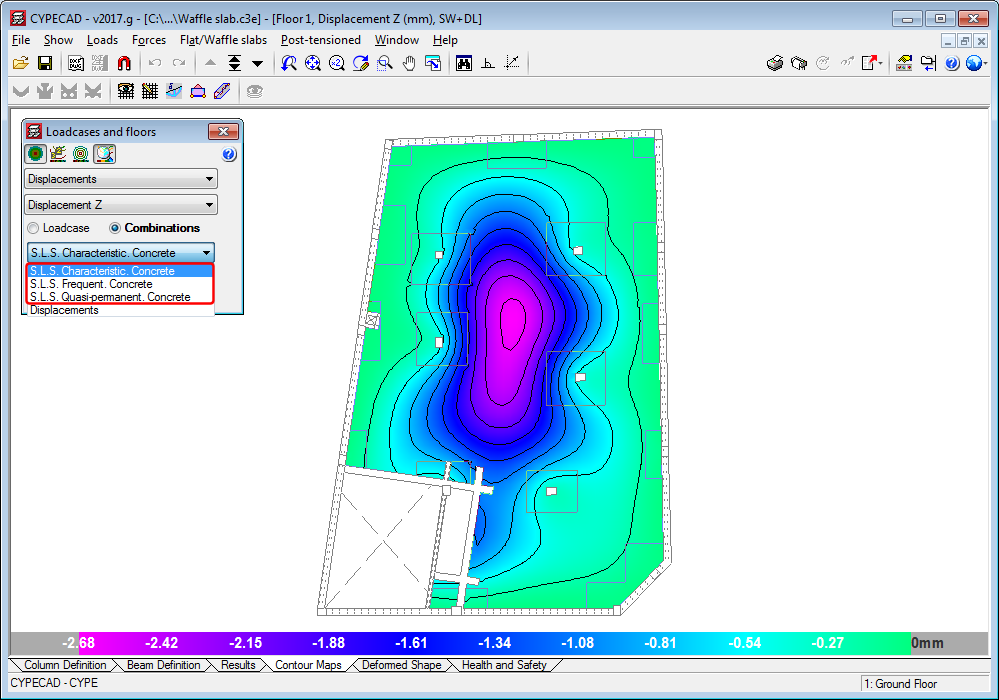
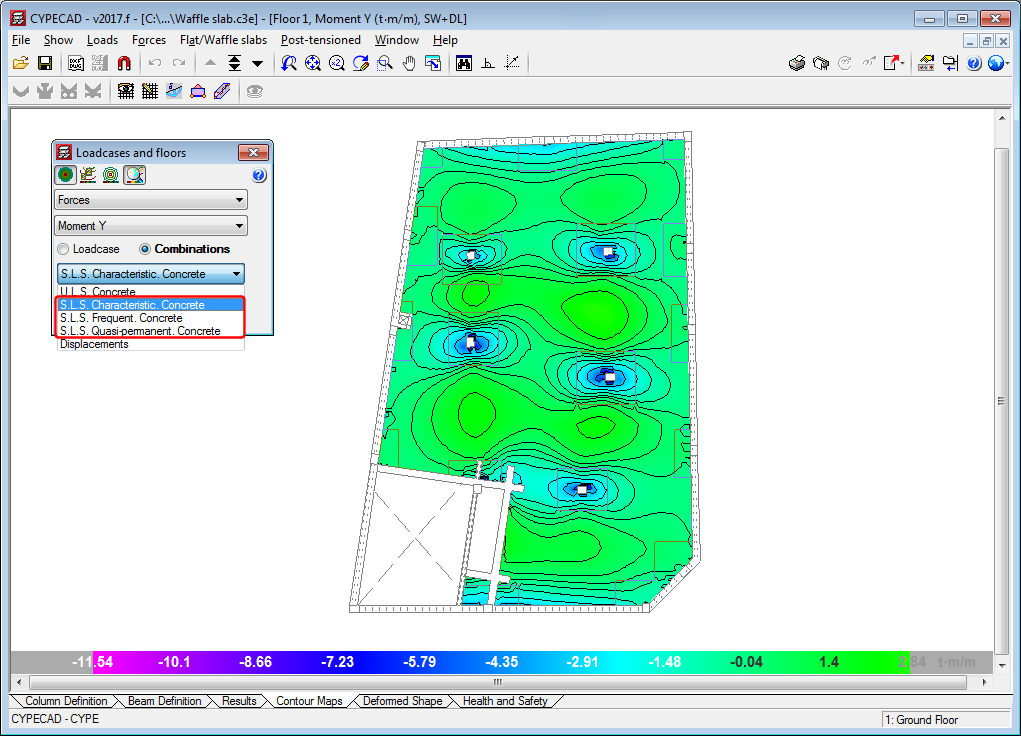
In the previous version (2017.f), the representation of serviceability limit states (S.L.S) of force combinations was implemented in the contour maps. In this version (2017.g), displacement combinations are included.
In previous versions, it was not possible to assign loads defined by users in the wind load patterns that were automatically generated by CYPECAD when wind loads are defined in the “General data” dialogue box (Project > General data). As of the 2017.g version, users can assign an additional load to introduce any of these load patterns in the program.
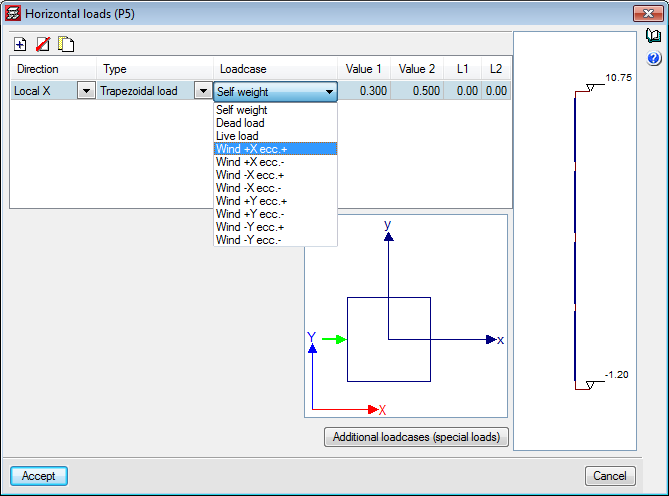
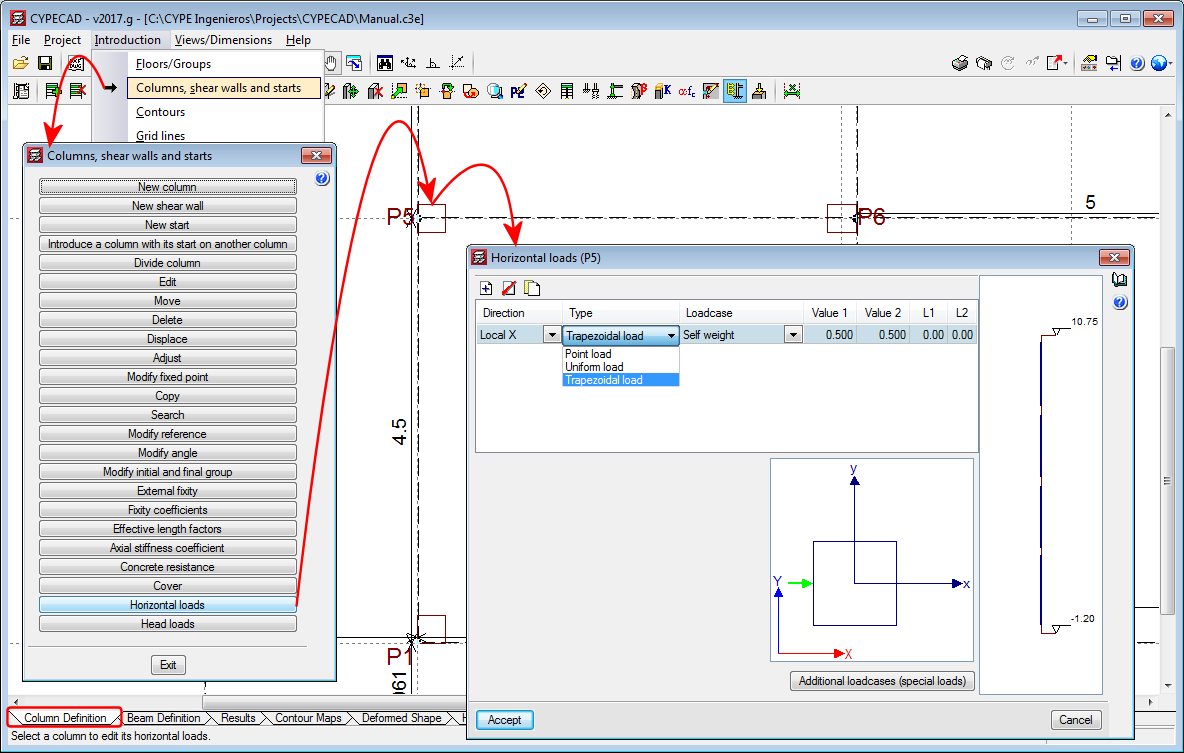
Trapezoidal loads have been implemented in the horizontal loads introduction option for columns.
As of the 2017.g version, CYPECAD allows users to analyse the project even if beams (that are not foundation beams, strap beams, supports or walls) have been introduced at the base of columns that have been defined as having external fixity. The program emits a message warning users of this situation, which allows them to ensure the introduction has been carried out intentionally and is not an error.
By introducing these beams at the base of columns with external fixity, users can introduce raised floor slabs containing beams that transmit loads to the columns.
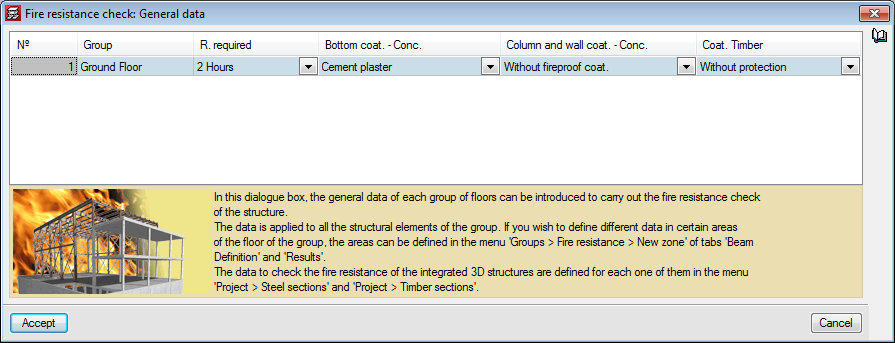
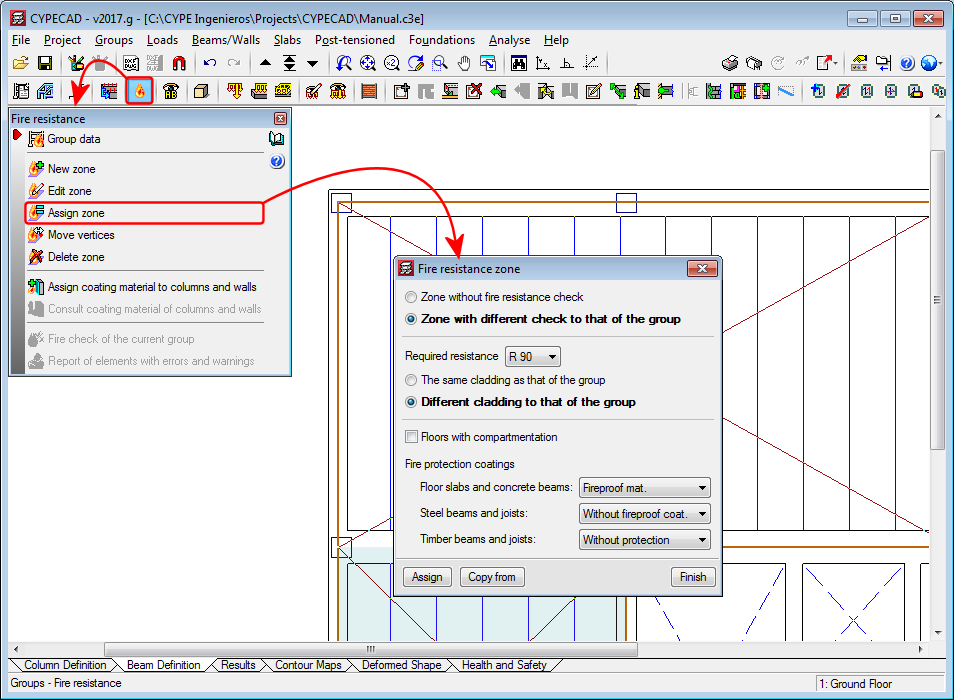
Users could, as of previous versions, create zones with different fire resistance options to those defined in the options of the project in CYPECAD. As of the 2017.g version, the option “Assign zone”, has been added to the fire resistance definition tools. This tool allows users to assign the required resistance and fire protection coatings to several zones, if required. The resistance zones can have the same or different fire protection coatings to those of the group.
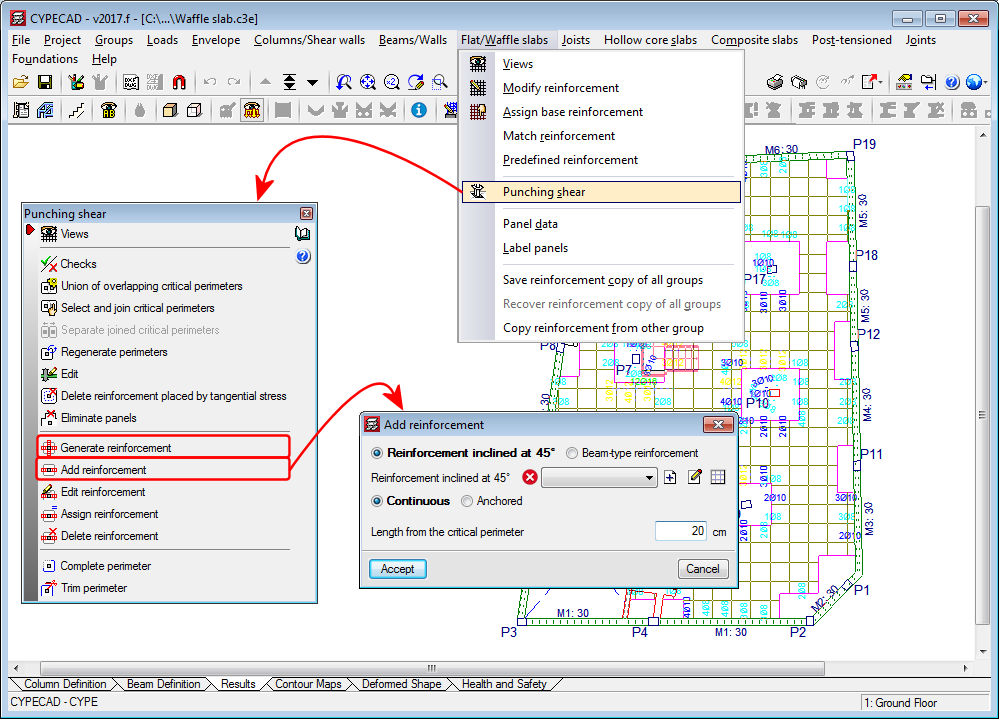
Punching shear reinforcement that is introduced using the “Generate reinforcement” or “Add reinforcement” options (Results > Slabs/Waffle slabs > Punching shear) is measured in the takeoff report (File > Reports > Job takeoffs).
Representation of the S.L.S. of force combinations
As of the 2017.f version, CYPECAD can represent Serviceability Limit State (S.L.S) force combinations in its contour maps.
Contour interval representation
In the contour maps for “Design forces”, “Steel areas” and “Ground bearing pressures”, users can define limits, so zones with values exceeding them are not displayed. In previous versions, zones whose values exceeded the limits were shown in the colour of the limit values. As of the 2017.f version, the zones exceeding the maximum limit are shown in dark grey and the zones below the minimum limit in light grey. This allows users to clearly distinguish the zones exceeding each limit.
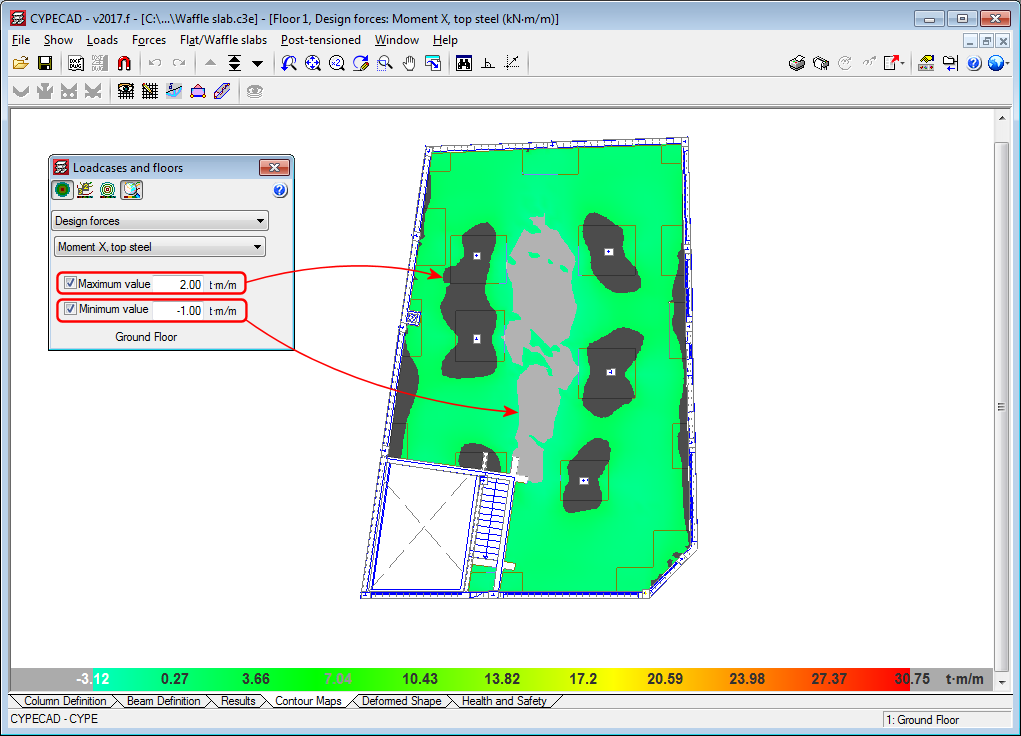
Diagram of average values between two points
In previous versions, the “Average values in a strip” diagram (which can be defined in the Contour Maps tab), was not drawn when it passed through contour zones with values exceeding the limits established by users.
As of the 2017.f version, this diagram is also represented when it passes through these zones, which are currently displayed in grey (see previous new feature: “Contour interval representation).

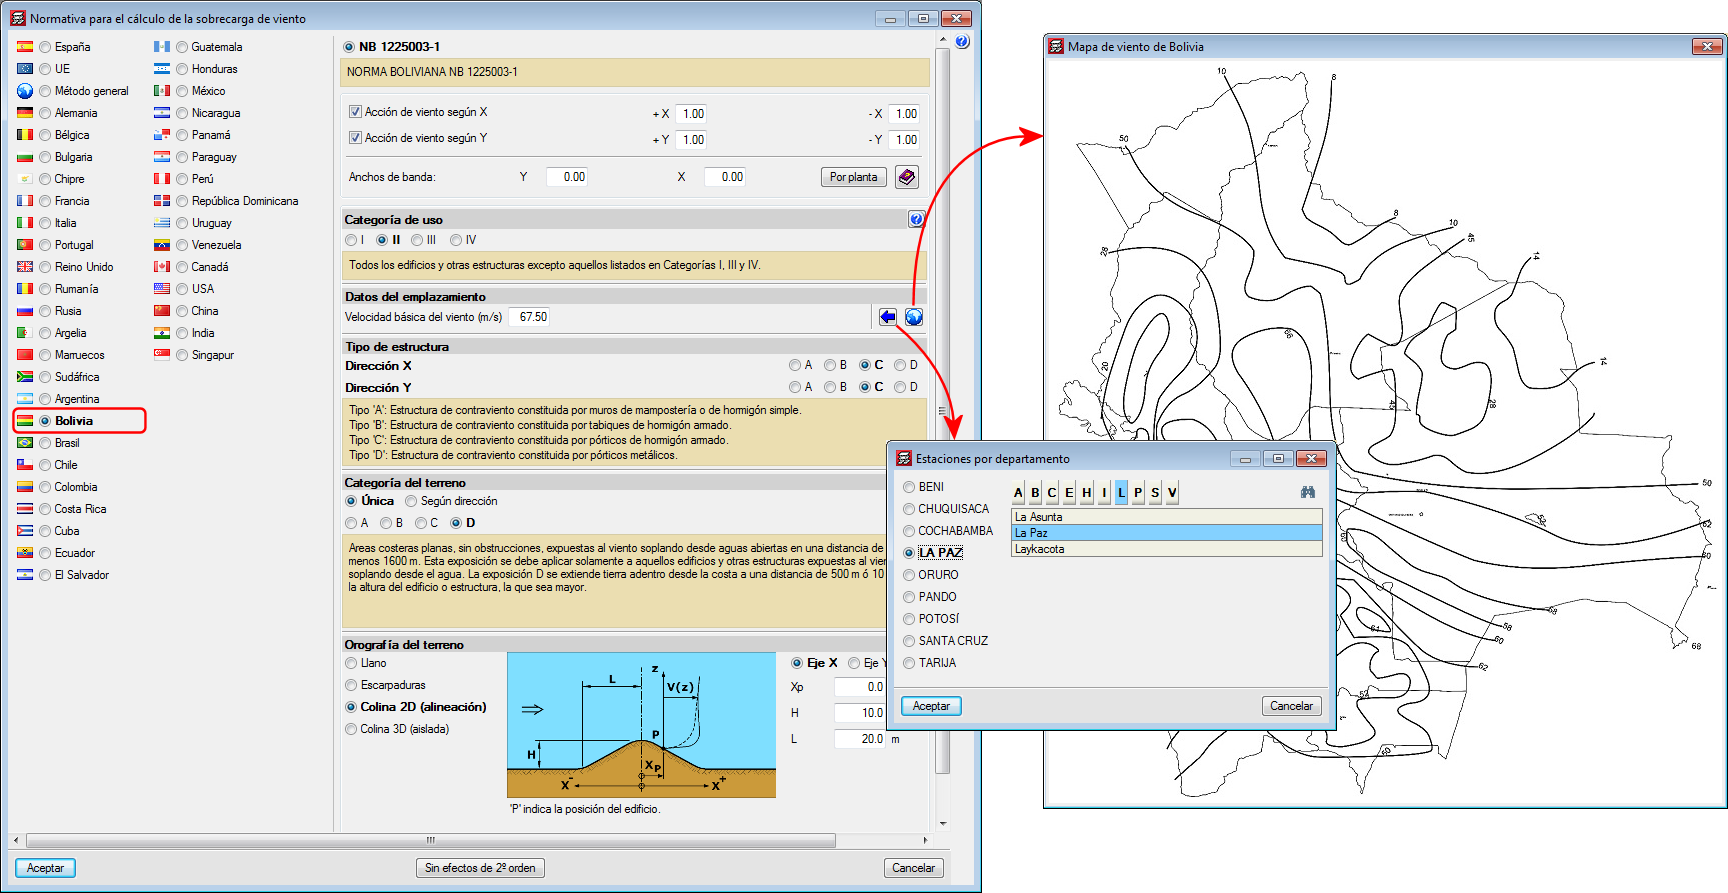
Norma Boliviana NB 1225003-1
Implemented in CYPECAD.