
Project planning: Gantt chart
With Arquimedes, users can create the project schedule (work program) and the payment plan (planned monthly expenditure) for a project or a financial proposal based on a validated bill of quantities. The tool allows users to generate one or more Gantt charts based on the bill of quantities’ structure of work sections, sub work sections and items, draw up a work schedule and link the various tasks. Once the diagram has been created, you can obtain the critical path and the corresponding timelines for labour and machinery.
It is important to distinguish the type of work plan being drawn up:
- Construction schedule as an annex to a project or a schedule submitted by the contractor to the developer
Specific dates are not usually included, as the actual plan for the start and progress of the works is unknown at that stage. Furthermore, when working on public sector projects, you must comply with the provisions set out in the Spanish Particular Administrative Clauses (Pliego de Cláusulas Administrativas Particulares) of the tender. - Project schedule drawn up by the site manager before work begins
Specific dates are included, as the actual schedule for the start and progress of the work is known at that point.
Creating the Gantt chart
Before creating a diagram, you must check that the operating system date is correct and that the bill of quantities has been finalised, with the items organised according to the construction process.
The Gantt chart editor is opened using the "Gantt chart" button on the bar or via the "Gantt chart" option in the "View" menu.
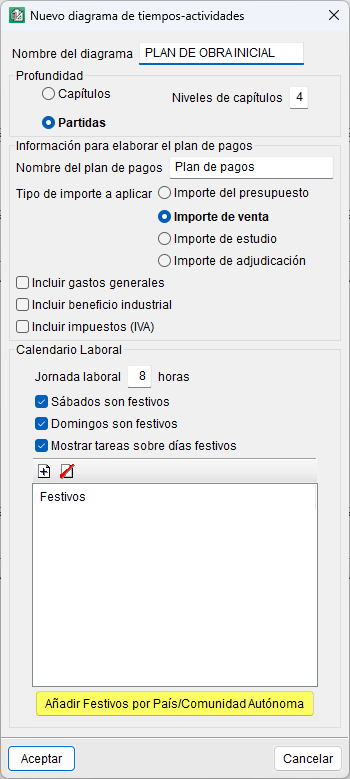
In the "New Gantt chart" dialog box, you define the data required for its initial configuration:
- Chart name.
- Selection of the depth of the "Cost breakdown structure" to generate the list of activities (work sections or items).
- Payment plan name.
- Selection of the amount type to be applied when calculating the payment plan (bill of quantities, sales, study or award).
- Inclusion (optional) of overheads, profit and/or VAT in the payment plan.
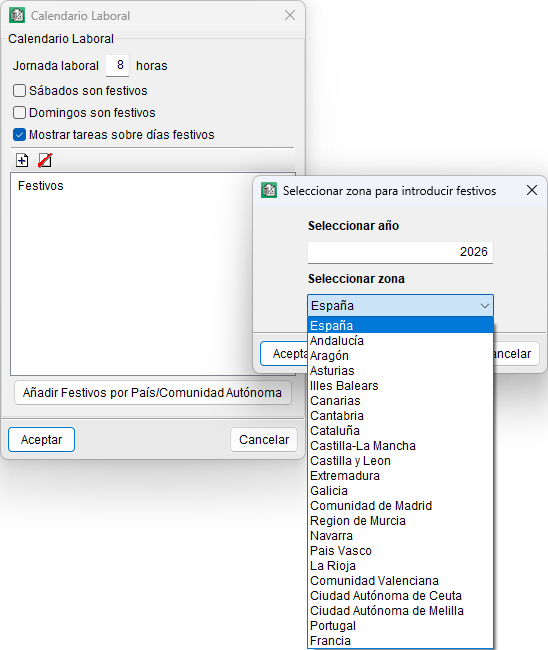
- Configuration of the working calendar: working hours, treatment of Saturdays and Sundays, display of tasks on public holidays and definition of public holidays.
An automatic entry button for public holidays is included, depending on the country or autonomous community.
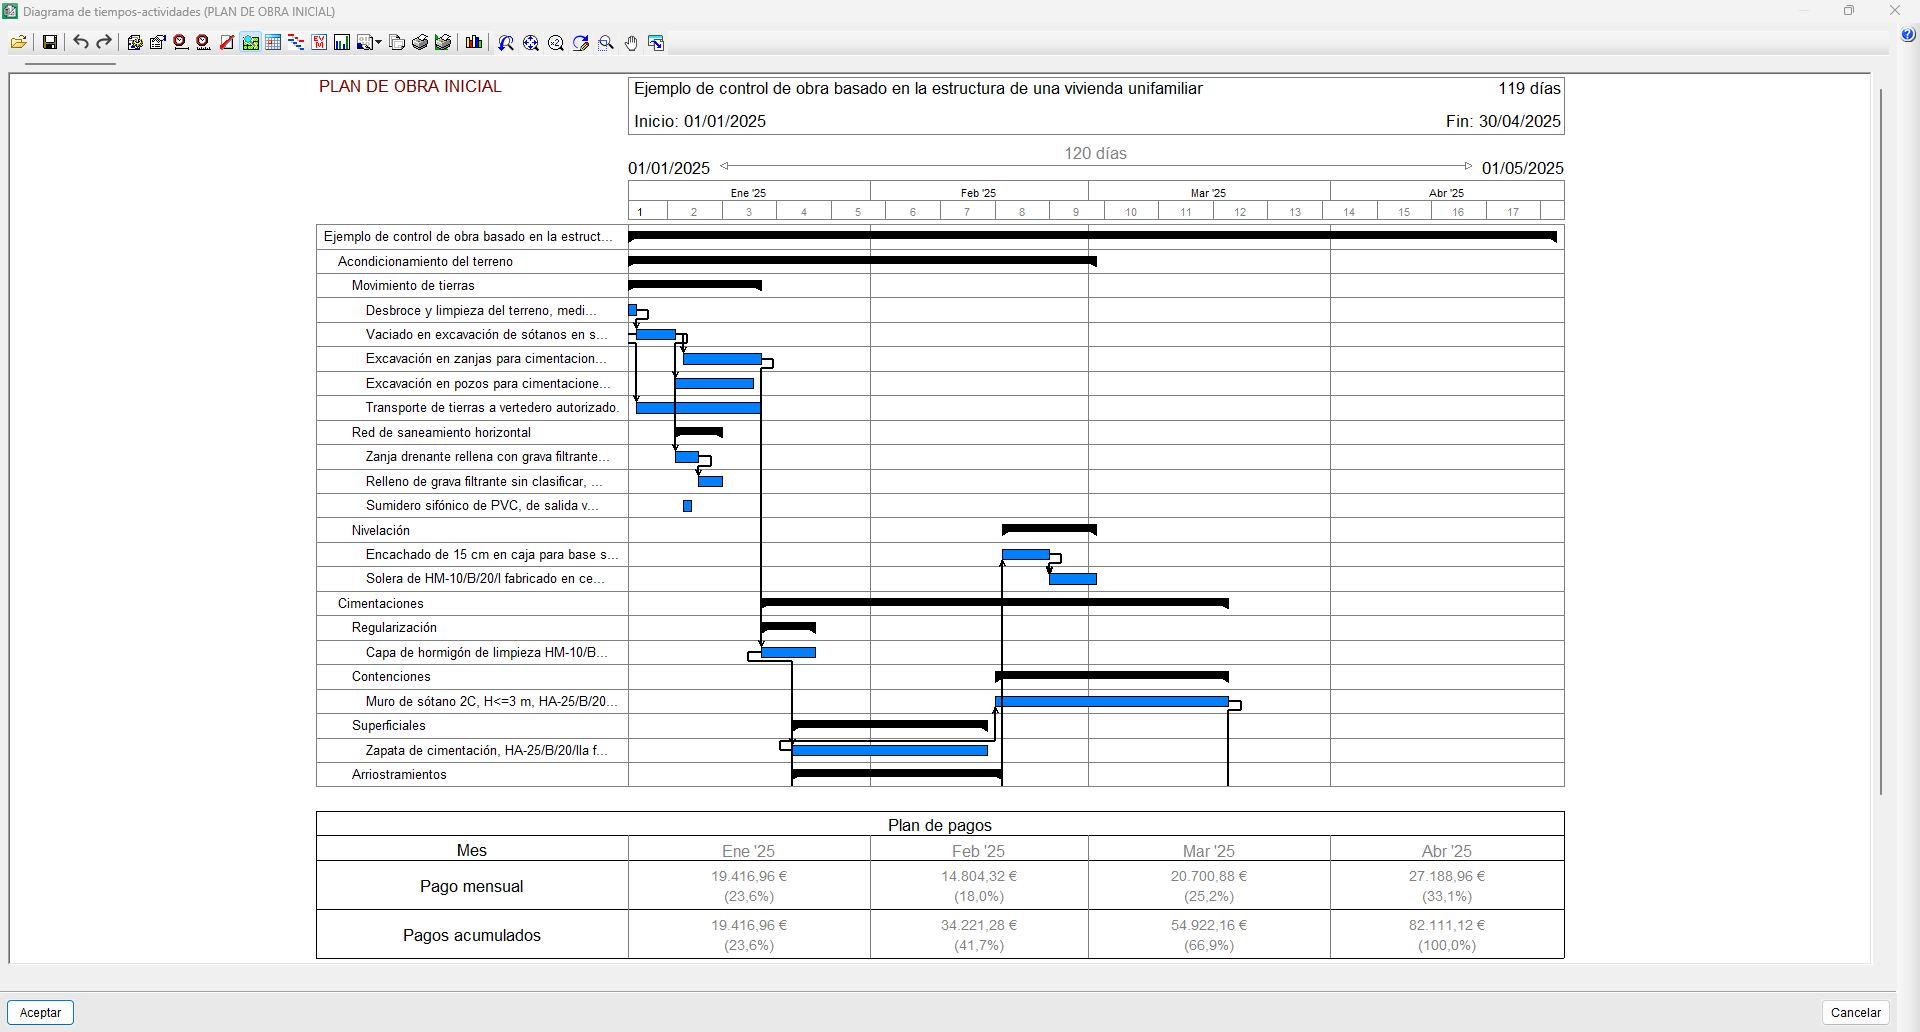
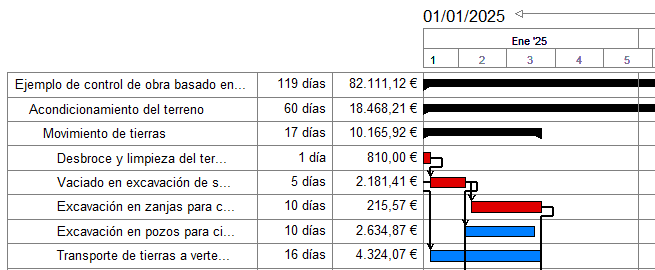
Once accepted, the editor window appears, displaying a one-day duration bar for each activity in the list, in accordance with the hierarchical order of the "Cost breakdown structure". The start date set for the first activity corresponds to the operating system date. Each work section of the "Cost breakdown structure" becomes a container task, the duration of which depends on the tasks it groups together.
From this point onwards, you can enter the durations for each task, move them, split them or establish dependencies between them. The critical path (or longest path) is shown in red if the "Highlight critical tasks" option in the bar is selected.
Gantt chart editor interface
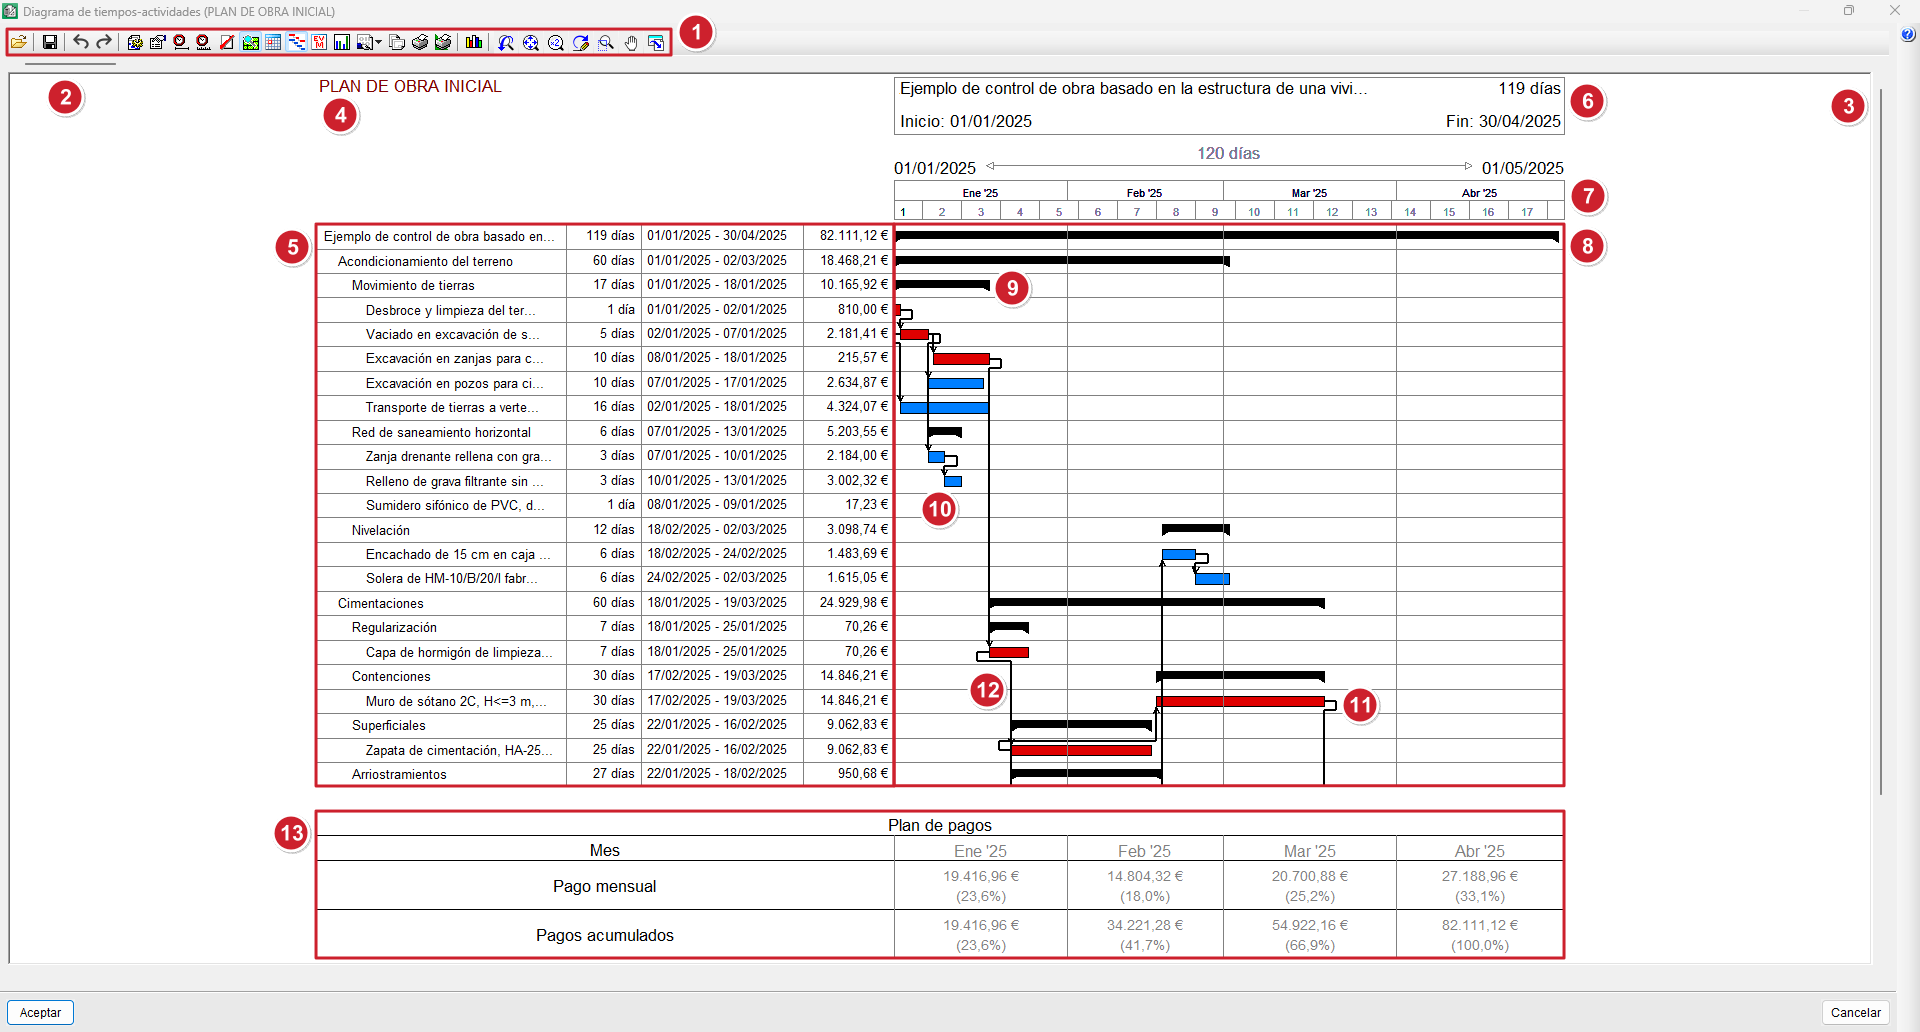
The Gantt chart editor consists of:
- Top bar.
- Horizontal scroll bar for moving along the time scale.
- Vertical scroll bar for moving through the task list.
- Name of the Gantt chart currently being edited.
- List of activities showing duration, start and end dates, and cost.
- Area showing the duration of the selected activity.
- Area showing the section of the time scale displayed on screen.
- Activity area where the various activities and their dependencies are represented by bars.
- Container task (work section or sub work section).
- Simple task (may be an item or a sub work section).
- Critical task (or longest task) shown in red.
- Dependency lines (or black arrows).
- Table showing payment plan data or planned monthly investment (if enabled).
Using the Gantt chart editor
Managing charts
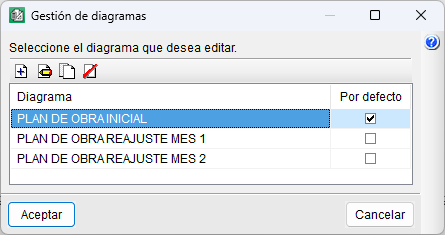
You can create one or more diagrams using the "Diagram management" option in the bar. You can also duplicate or delete them, or choose which one opens by default.
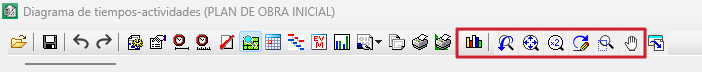
Display tools
To view the diagram in detail, there is a set of buttons on the bar that allow you to adjust the graphic display.
Delete and update tasks
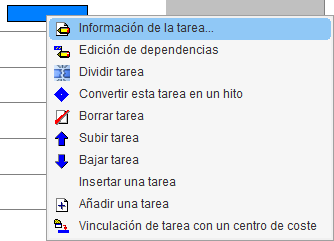
A task can be deleted by right-clicking on it and selecting the "Delete task" option from the context menu.
To recover a deleted activity, you will need to manually add a new one, link it to the relevant cost centre and, finally, update it using the "Update tasks" button on the bar.
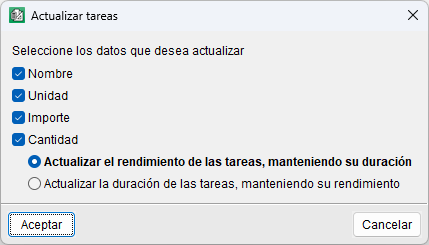
The "Update tasks" tool also allows you to synchronise the data for activities linked to cost centres when the quantities or cost of the associated items are modified. The tool allows you to choose between two options: adjust the output whilst maintaining the duration or adjust the duration whilst maintaining the output.
Set a start date and adjust the time frame
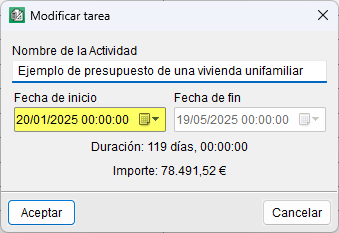
To start with a specific start date, place the mouse pointer over the bar of the first parent activity, right-click and select the "Task information" option. When you change the "Start date", all tasks will be moved at the same time.
The same action can be performed from the activity area by dragging the task to a specific date without releasing the left mouse button. To do this, you must have the "Show month and year labels" option enabled, which appears when you click the "Step" button on the bar or when you click on the area indicating the time scale range displayed on the screen.
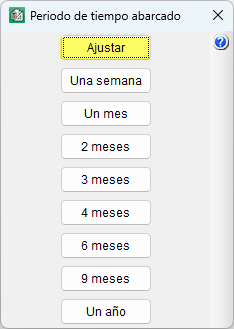
In this case, the section displayed on screen may not be sufficient, and the full diagram may not be shown. You can adjust this using the "Span" button, either by clicking "Adjust" or by selecting a more specific time period (one month, two months, etc.).
Work calendar
Arquimedes allows you to create a work schedule for each diagram by clicking the "Work schedule" button on the toolbar.
Duration of an activity
By using the "Task information" option (accessed via the right-click menu), you can also rename a task or set a duration for it. There are four ways to set a duration for a task:
- You can manually (from the activities section) use the mouse pointer to move, expand or collapse tasks according to the scale selected via the "Step" button.
- By entering a start date and an end date.
- By entering the duration directly in days.
- By entering the output per day, calculated based on the work team.
| Best practice: |
|---|
| The calculation of a task’s daily output can be estimated by breaking down the item, identifying the main resource that determines production and which takes the longest to produce a single unit of that item. |
Task amount
The cost of a task depends on the option selected in the "New Gantt chart" dialog box; it may be based on the bill of quantities, sales, study or contract award cost. Furthermore, it may include overheads, profit and/or VAT, as specified in that dialog box.
| Note: |
|---|
| For a task to have a cost, it must be linked to a cost centre (see the "Linking a task to a cost centre" tool in the "Editing tasks and dependencies" section below). |
| More information: |
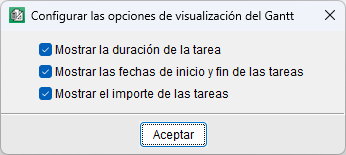
|---|
| To display the amounts, duration and/or start and end dates of tasks, you need to tick the relevant box under the "Configure Gantt chart display options" option. |
Editing tasks and dependencies
In the Gantt chart editor, tasks can be edited directly via the context menu that appears when you right-click on one of them. This menu allows you to perform the following operations:
- Task information
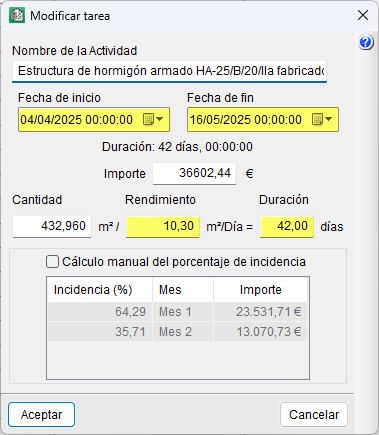
- Opens the "Edit task" dialog box, where you can edit:
- Activity name, which identifies the task in the chart.
- Start and end dates, which define the planned duration.
- Amount associated with the task, either calculated or entered manually.
- Quantity and efficiency, the ratio of which determines the duration of the task.
- Manual calculation of the percentage allocation, a box that allows you to manually enter the monthly percentage allocation for the task (adding up to a total of 100%), rather than having it calculated automatically based on the amount or duration.
- Editing dependencies
Creates, modifies or deletes dependency relationships between tasks based on the link conditions (finish-to-start, finish-to-finish, start-to-finish or start-to-start). From the dialog box, select the task to which you wish to subordinate the current task (from among the rest of the project). Next, select the type of dependency from the drop-down menu in the "Dependency" column. You can add as many tasks as you like to create dependencies with the current one. - Divide task
Inserts breaks in the execution of a task (for example, waiting periods). You can define the start and end dates for each segment in the "Task information" section, or adjust them directly on the diagram by dragging with the mouse. - Change this task into a milestone
Turns the selected task into a milestone, i.e. a marker with no duration that represents a key point in the project (such as the start or end of a phase). It is visually distinguished by a diamond and may have associated dependencies. - Delete task
Removes the selected task from the diagram, along with its dependencies. - Move task up
Changes the hierarchical order of the selected task by moving it one position up in the list. - Move task down
Changes the hierarchical order of the selected task by moving it one position down in the list. - Insert a task
Creates a new task immediately above the selected one. It is assigned a duration equal to that of the containing task and an initial amount of zero. - Add a task
Creates a new task at the end of the list, with a duration equal to that of the containing task and an amount of zero. This is useful for incorporating complementary activities or new phases. - Linking a task to a cost centre
Associates the selected task with a cost centre, i.e. with an item or work section in the "Cost breakdown structure". There will be a single linked cost centre (item or work section) in the list, and it is possible to unlink it via the box in the "Linked" column.
| Note: |
|---|
| If you hover over an enclosing task (work section or sub work section) and right-click on it, the context menu will display the option "Add an enclosing task". |
Cost tracking by construction task
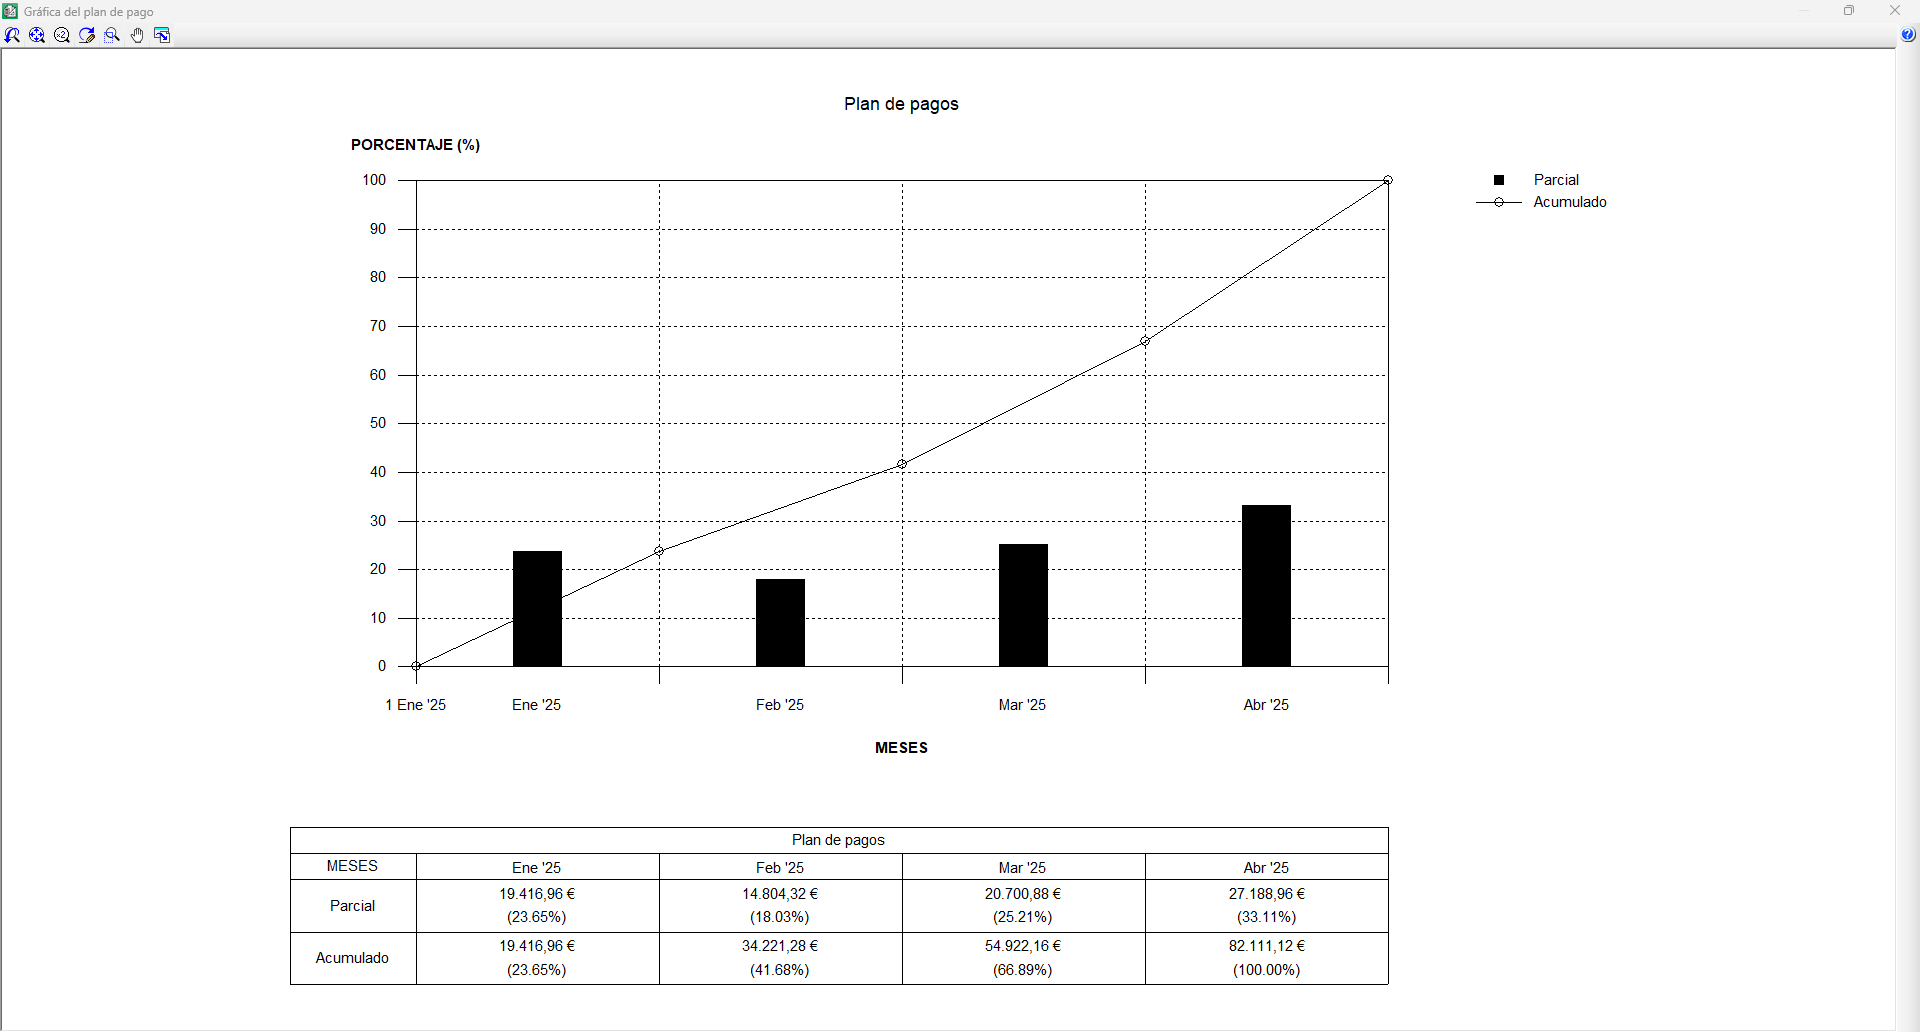
The payment plan is displayed as a table at the bottom of the diagram, provided the "Payment plan" option on the toolbar has been selected. This table consists of the same number of columns as the number of months the project spans, and two payment rows (monthly payment and cumulative payments), which show the amounts and percentages for each month. This plan, also known as "Monthly investment", corresponds to the monthly forecast of the sum of task amounts by month. The amounts to be spent on tasks are defined when creating the Gantt chart.
It is possible to plot the payment plan on a graph called "Investment curves". This is activated via the "Graph" option by selecting a title and defining the graph type. Two functions are plotted, representing the monthly and cumulative payments. It is possible to print the graph or save it to a file in DXF, DWG or JPG format, amongst others.
Earned Value Management (EVM)
The Earned Value Management (EVM) method is a cost control standard that enables the monitoring of a project’s costs and deadlines and provides the information needed to make decisions.
To view EVM from the site manager’s (contractor’s) perspective in Arquimedes, you must first create a Gantt chart with an "Items" level of detail. All tasks must be linked to cost centres (item type) with quantities and estimated costs, and must be updated in line with the items in the "Cost breakdown structure". It is also necessary to correctly allocate each item to its cost centre and enter the quantities actually completed to obtain the cost of completion for each phase of the project schedule. Furthermore, certificates must be finalised on the scheduled dates to record both the certified quantities and the amounts spent.
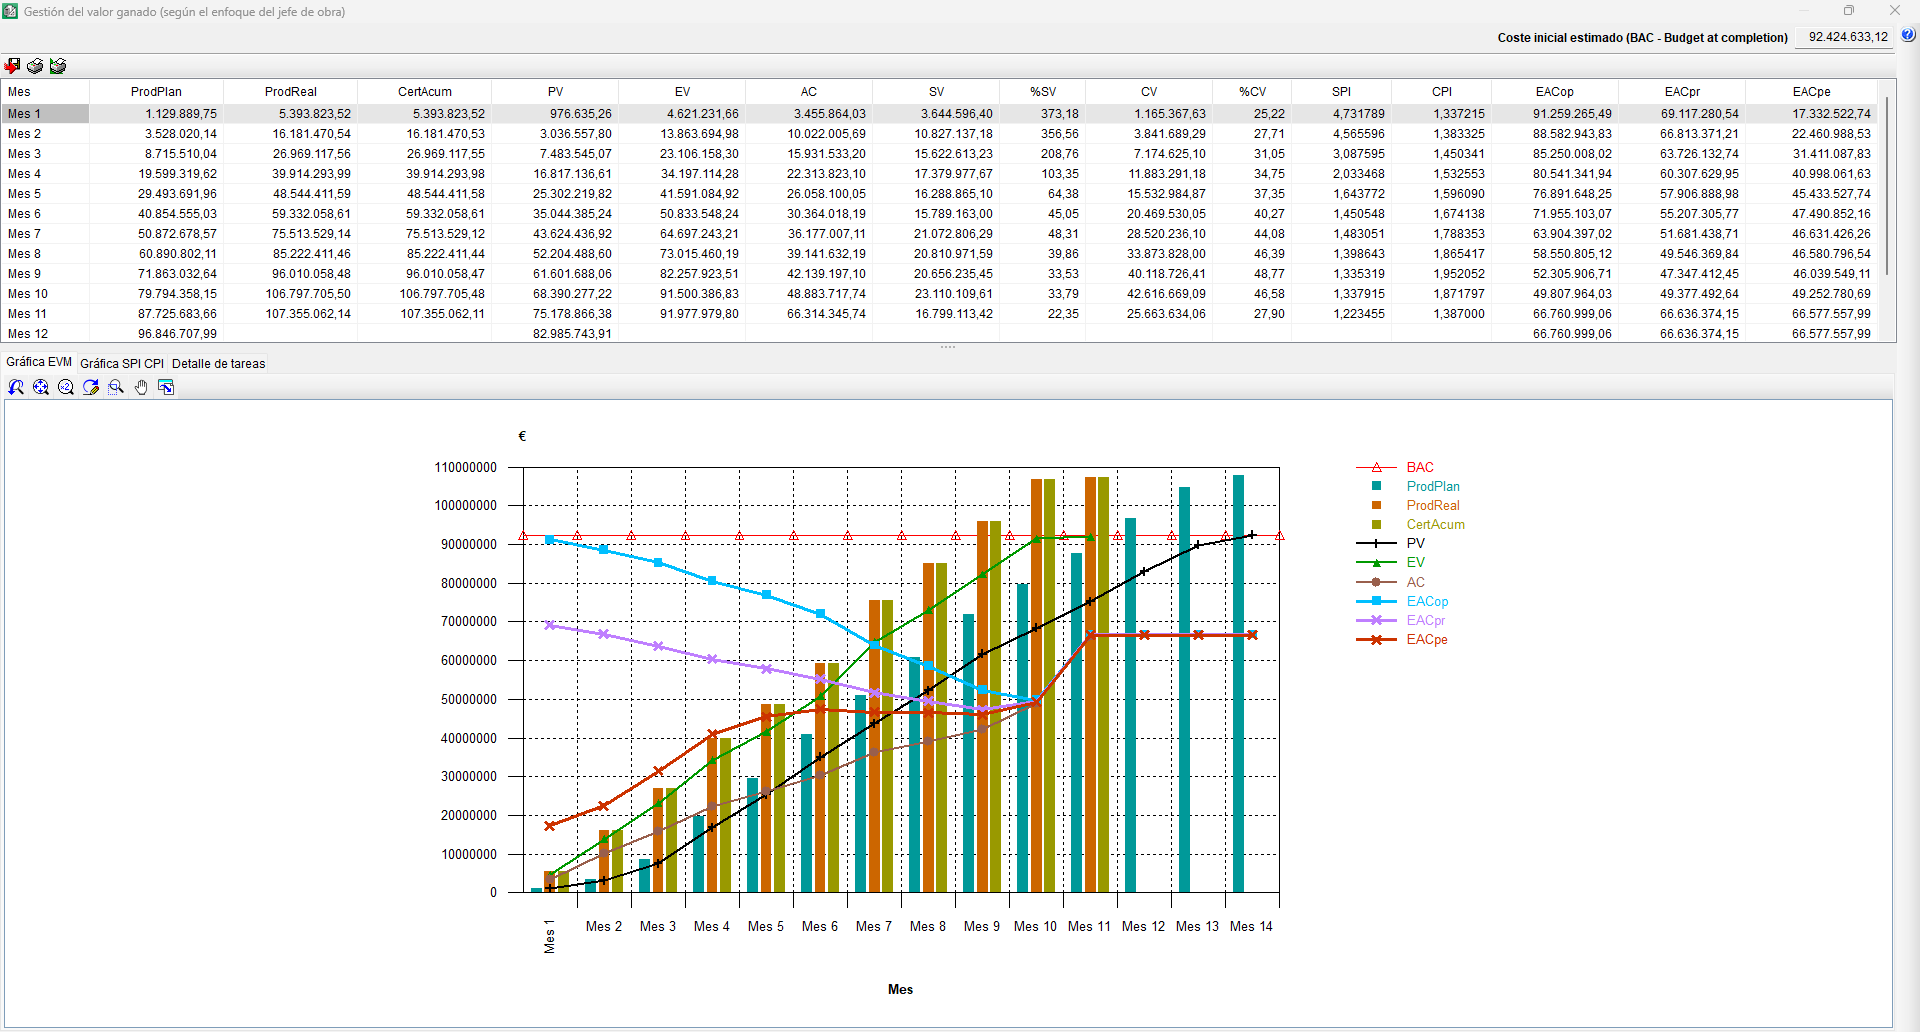
After completing all of the above, in the Gantt chart editor, click the "EVM (Earned Value Management)" option on the toolbar. A dialog box divided into two parts will then appear; the upper part displays the EVM model variables in monthly periods, together with planned production ("PlanProd"), actual production ("RealProd") and cumulative certificates ("AccumVal"). The lower part is divided into three tabs. The first displays the graph with the EVM model. The second displays the graph with the SPI and CPI indices. The third tab shows the breakdown of tasks by month.
Printing and exporting the Gantt chart
The Gantt chart editor features an "Export" option in its toolbar, which allows you to generate files in XML or MPX format (compatible with Microsoft® Project and other planning software).
| More information: |
|---|
| In Microsoft® Project versions 2007 to 2010, to import a file in MPX format, you must enable the "Allow loading of files with non-default or legacy file formats" option. From version 2013 onwards, the MPX format is no longer supported by Microsoft® Project. |
To print the Gantt chart, the editor offers several options in the bar:
- Print list template (recommended)
Prints using "Gantt" list templates. Allows you to print directly or export to PDF, DOCX, HTML, RTF, XLSX and TXT formats. - Print drawings
Print via a drawing output. In the "Drawing selection" dialog box, add a new element to the list and select the desired device. - Print current view
Print the current view displayed in the workspace or generate a file containing the drawing in a graphic format.
Using the "EVM" report template, named "pl_evm01.pla", you can generate a report based on the Earned Value Management model (from the site manager's perspective). This template is not accessible from the Gantt chart editor; you must close the editor and access it via the "Print report..." option located in the "Print" section of the "File" menu.