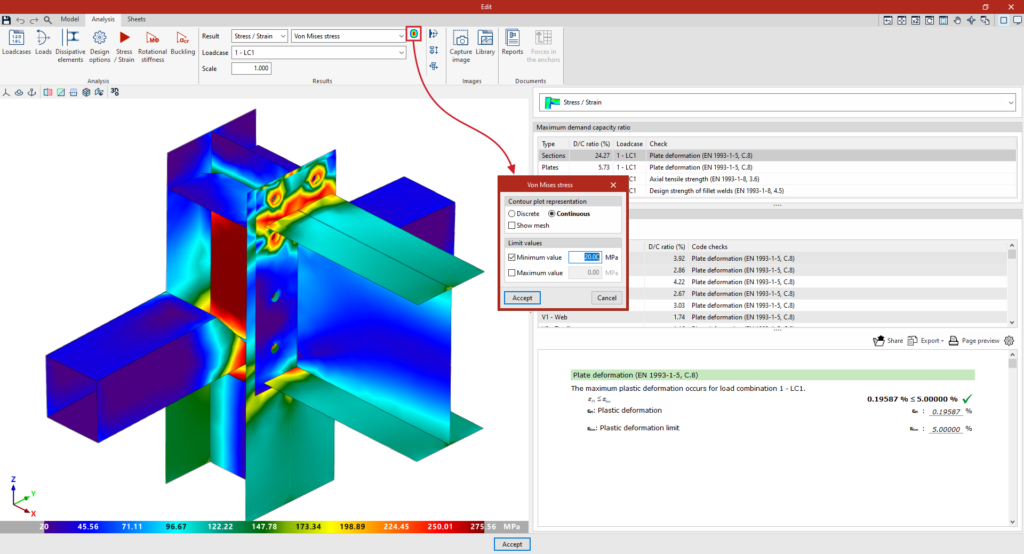

Viewing stress/strain analysis results in the connection editor
You can view the results after carrying out the connection analysis in the program by using the options in the "Results" section of the top toolbar on the "Analysis" tab within the connection editor.

In the "Result" drop-down menu, you can select "Stress / Strain" and then, in the second drop-down menu, one of the following options:
- Maximum demand capacity ratio
- Von Mises stress
- Equivalent Von Mises deformation
- Displacements
Each of these is explained below:
Maximum demand capacity ratio
If "Maximum demand capacity ratio" is selected, in the 3D view of the connection on the left-hand side of the window, each element is displayed in a colour corresponding to its demand capacity ratio.
A colour scale is displayed at the bottom of the 3D view of the connection to aid interpretation
The following results are also displayed on the right-hand side of the window when you select "Stress / Strain" from the drop-down menu:
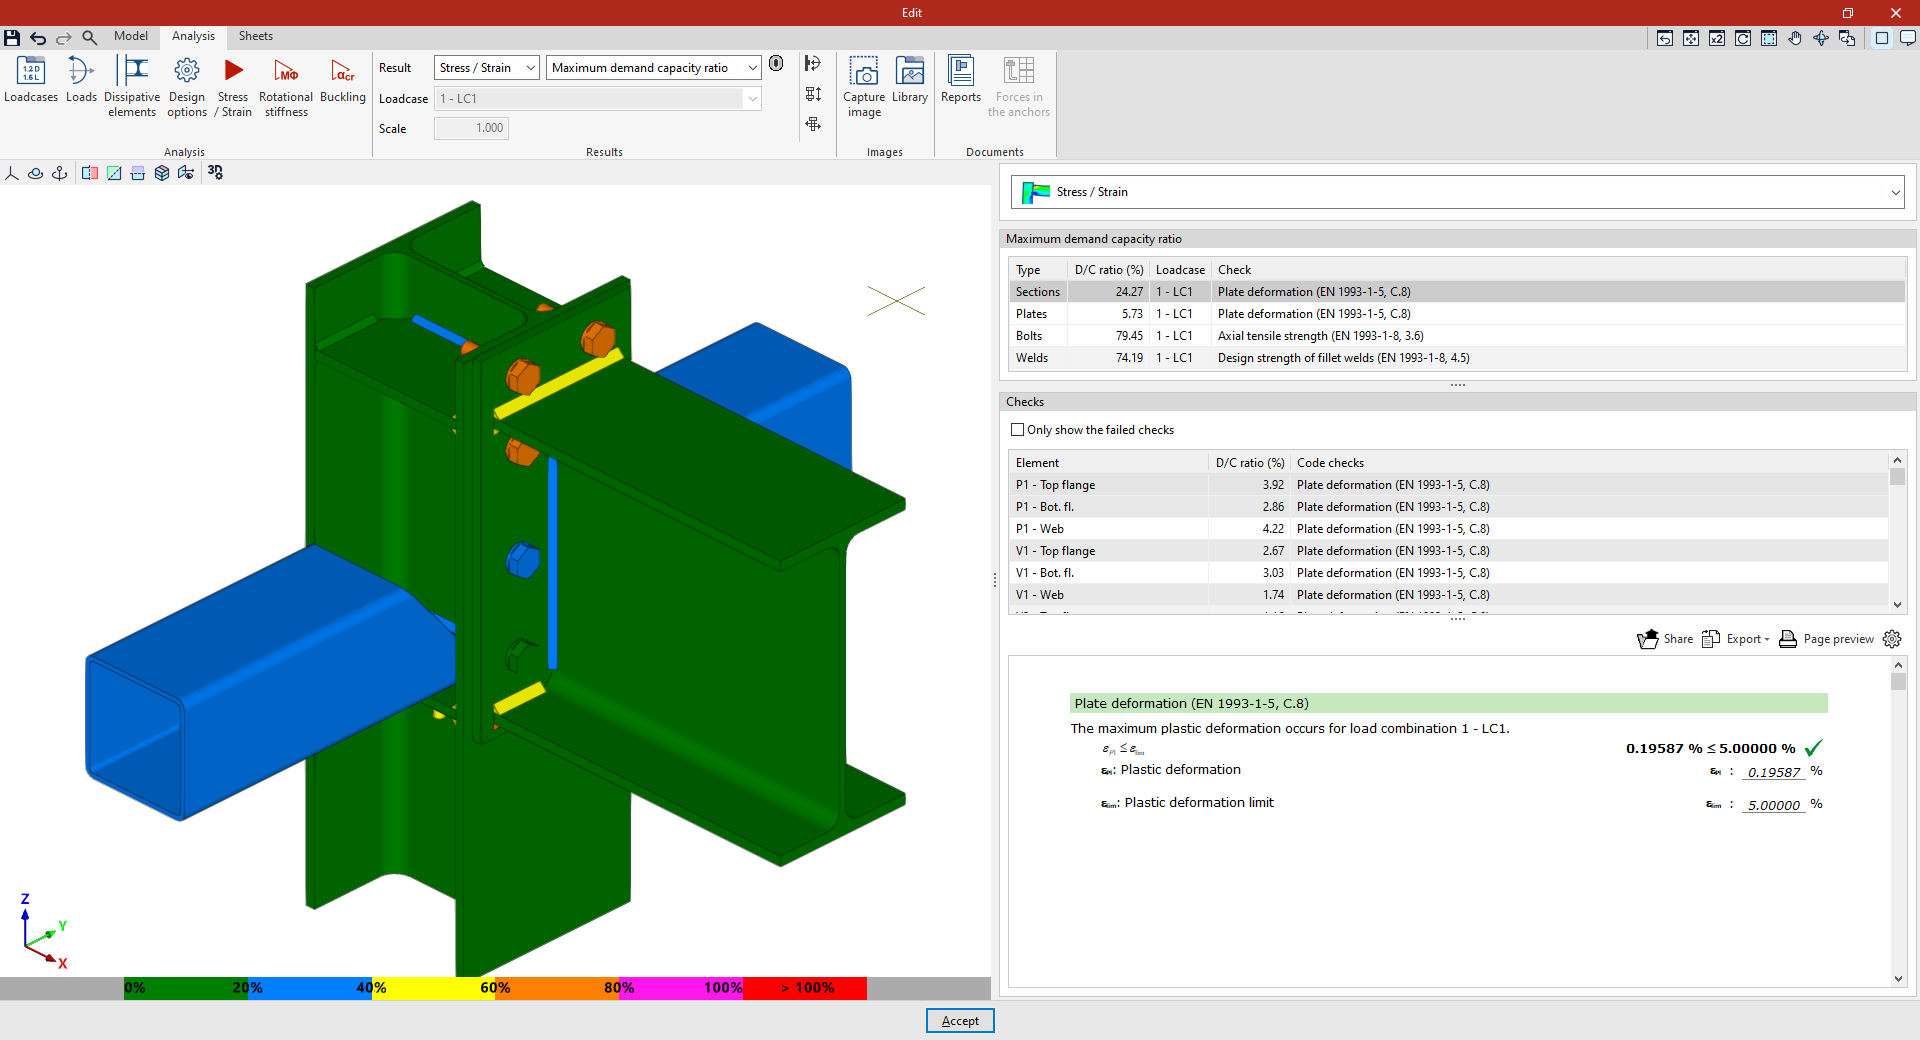
Maximum demand capacity ratios
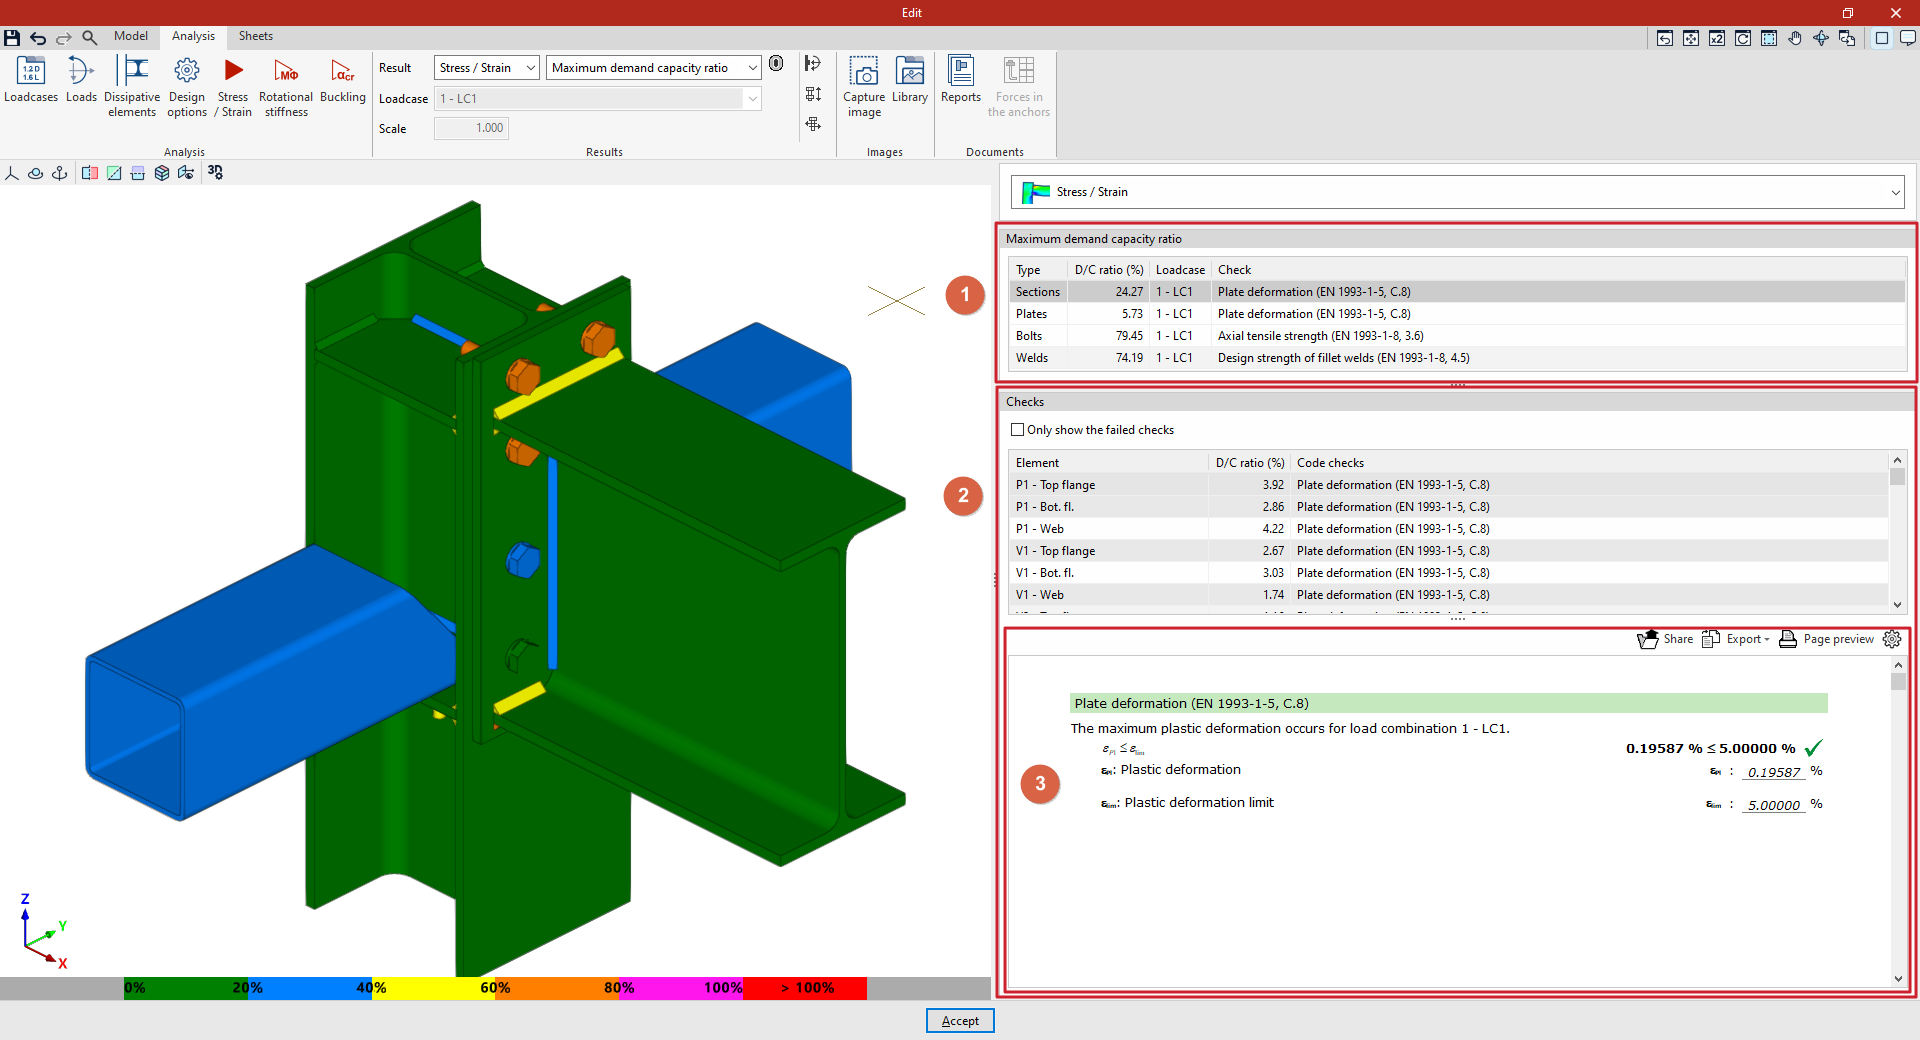
At the top of the right-hand side there is a table (1) showing the "→ Maximum demand capacity ratios" of the components for each "Type", including "Sections", "Plates", "Bolts" and "Welds".
Each of them shows the maximum "Demand capacity ratio" percentage and specifies the "Loadcase" and "Verification" to which it corresponds.
Checks
Below this is the "Checks" table (2) for each connection component, based on the various criteria set out in the standards selected by the user. If desired, the "Only show the failed checks" box can be ticked.
Here, for each "Element" in the connection, the "Demand capacity ratio" percentage is shown in the corresponding "Check".
The results displayed on the screen and on the side panel are coordinated as follows:
- If you click on a connection element in the viewport, the table will display only the checks for the selected element.
- If you click on an empty space in the 3D view, the checks for all the elements in the connection are displayed.
Furthermore, when you select an element "Type" in the "Maximum loads" table, the program selects the corresponding element in the "Checks" table.
Detailed check report
When you click on any check, the program displays a detailed report of that check (3) in the bottom right-hand corner, showing the relevant section of the regulations and the parameters involved in its verification.
This information can be "Shared" or "Exported" in various formats or printed directly from the "Preview".
| Note: |
|---|
| For "Sections" and "Plates", deformation is tested, with the plastic deformation limit set at 5 per cent. For "Bolts", the distances to the edge and between bolts, tensile strength, shear strength and crushing strength, and the interaction between shear and tensile forces are tested. For prestressed bolts, slip resistance is also checked. For “Welds”, the strength of fillet welds and partial penetration welds is checked, in accordance with the applicable standard. For full-penetration welds, their strength is considered to be greater than that of the elements they join, in accordance with the standards taken into account by the program. |
Von Mises stress
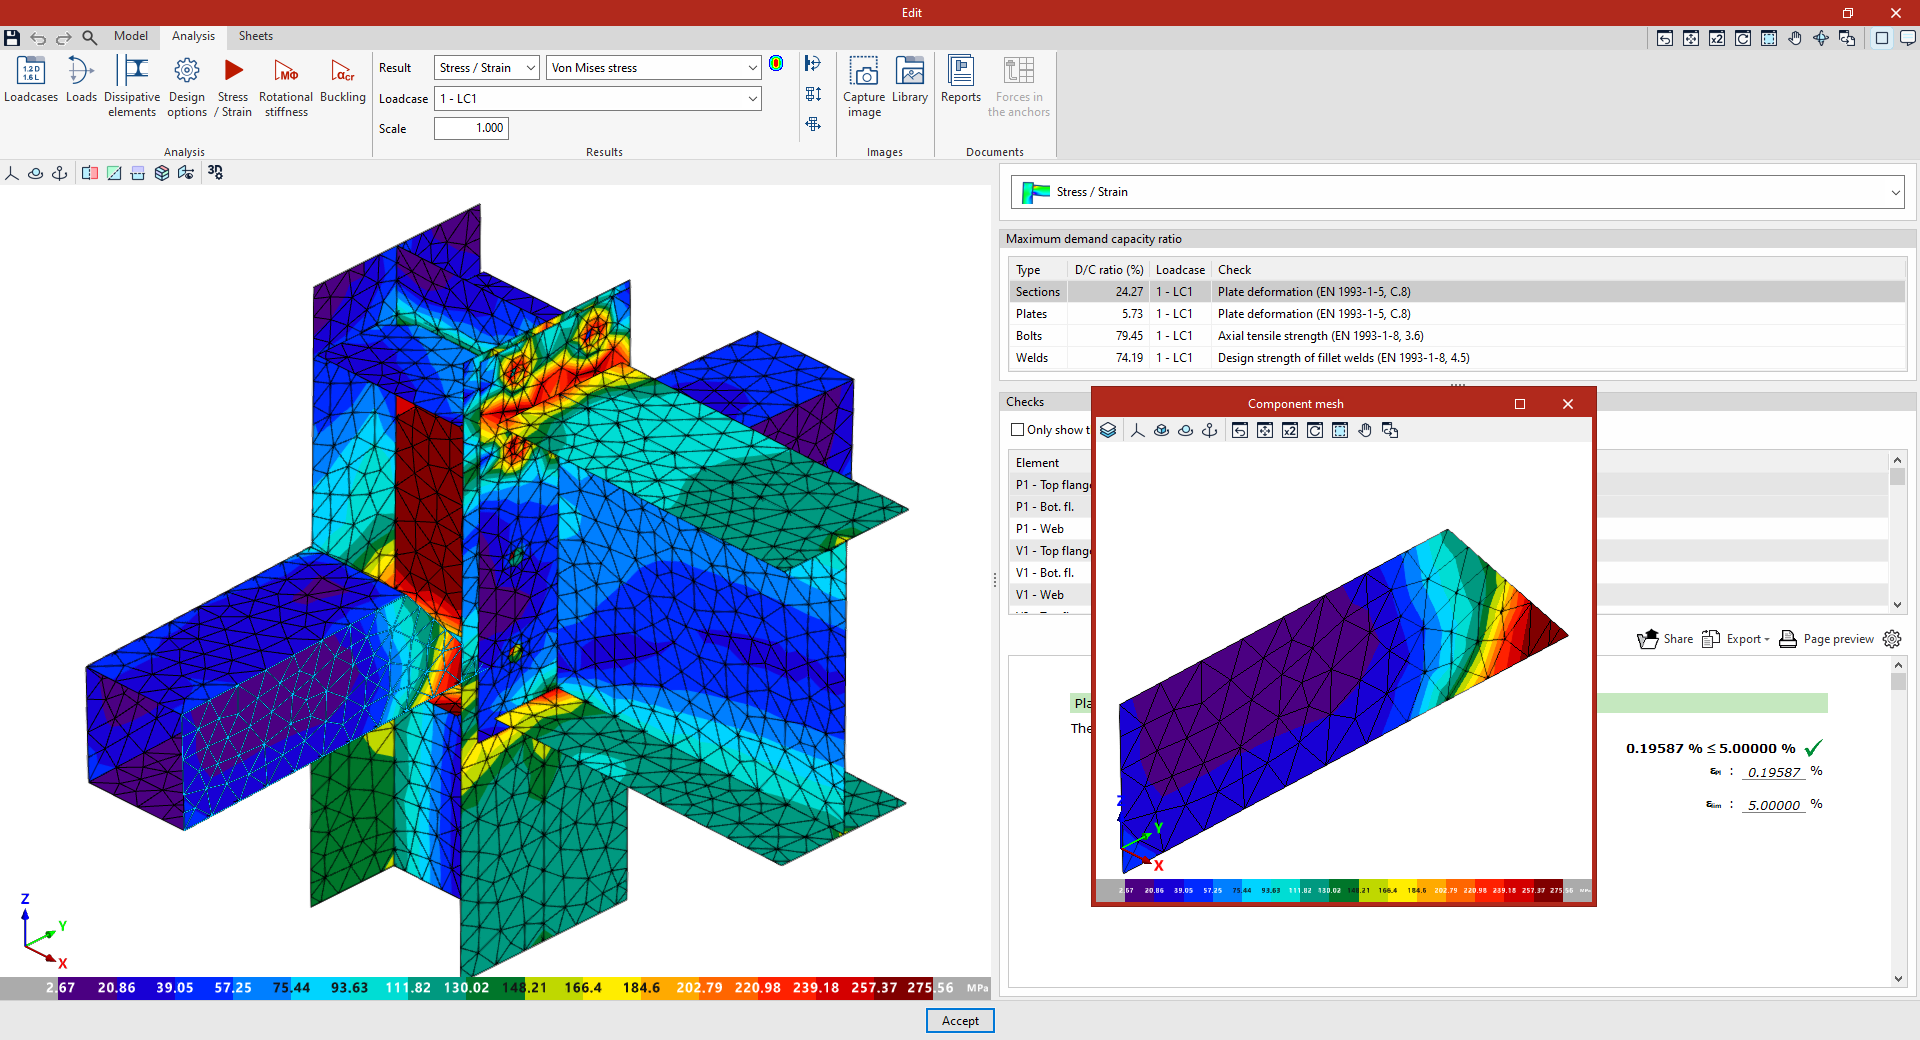
By selecting the relevant option from the "Result" drop-down menu on the top toolbar, you can also view the "Von Mises stress" for the selected "Loadcase"
As a result, in the connection view, the contour plot of the selected von Mises stress and the element discretisation are displayed.
You can also click on any sheet to bring up a pop-up window showing the "Component mesh" and the results for that specific sheet.
Equivalent Von Mises deformation
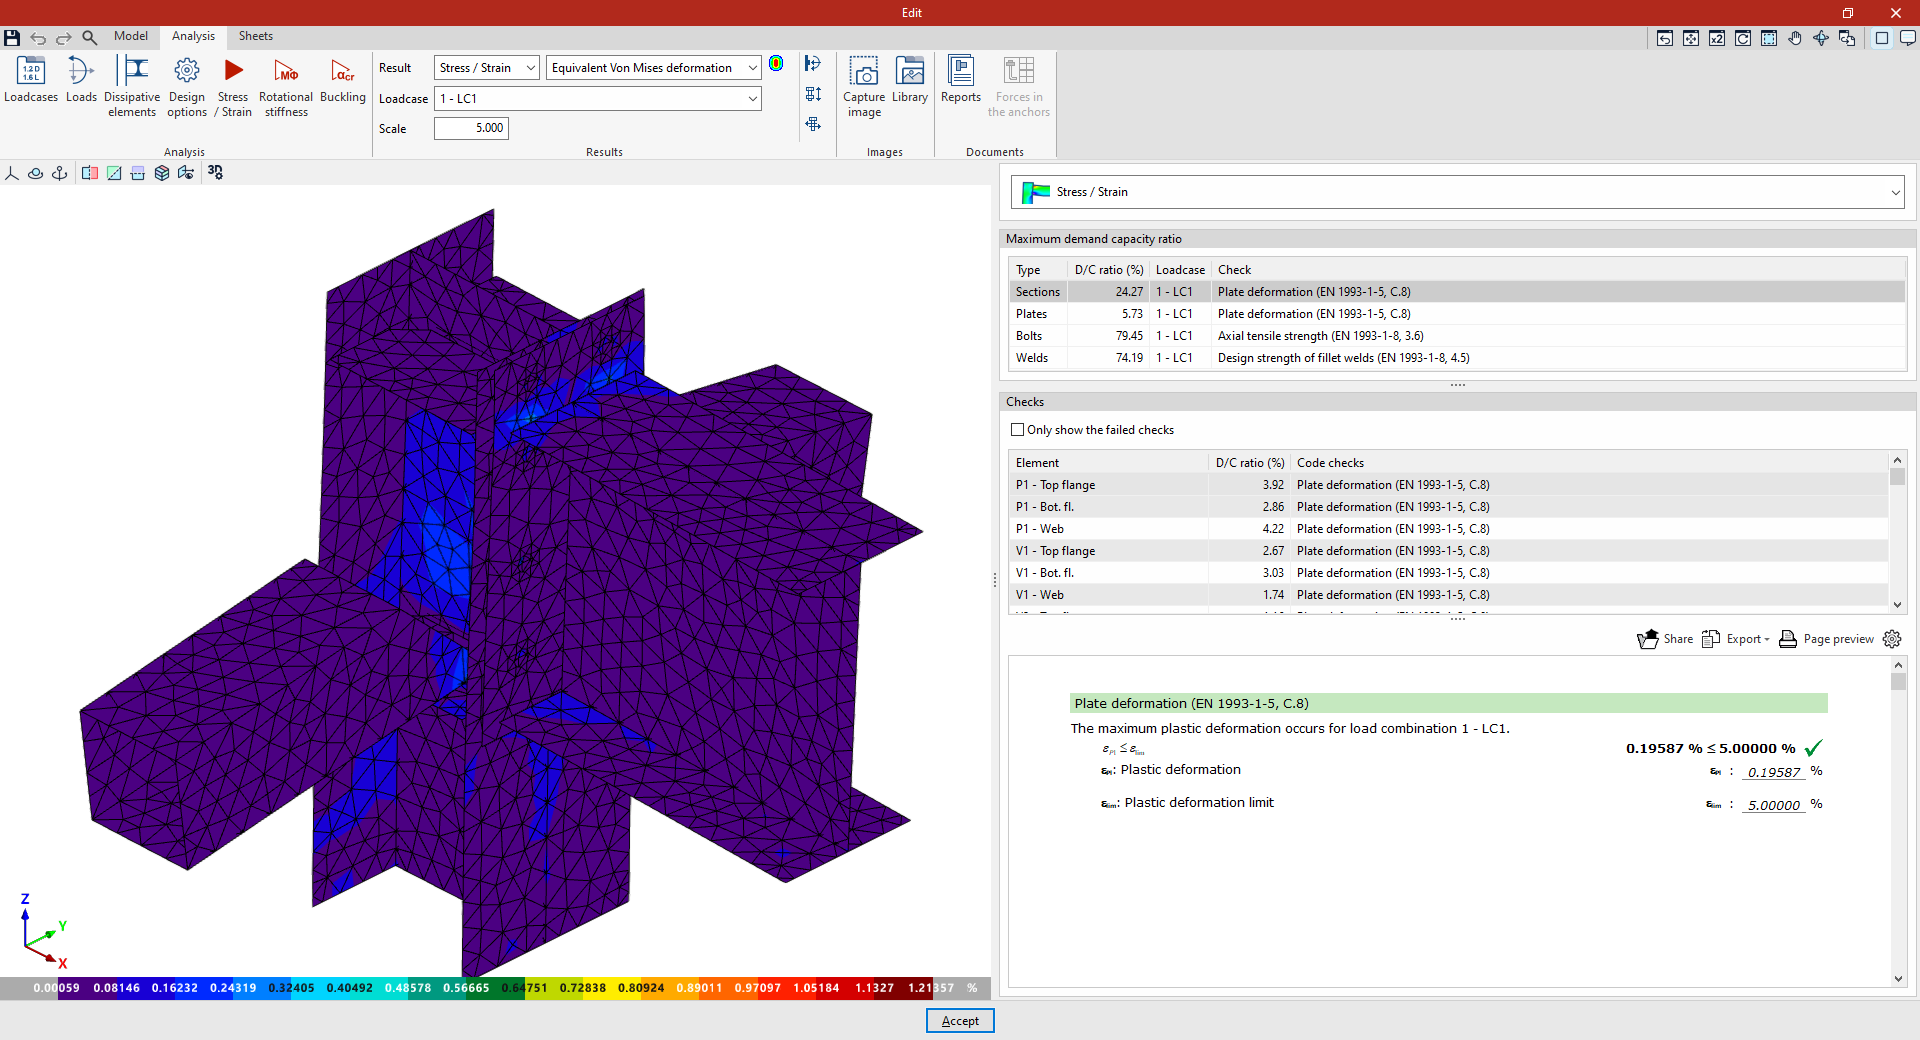
The next result that can be selected is the contour plots for the "Equivalent Von Mises deformation".
Once again, for each "Loadcase", the program plots the percentage values of the deformation using contour plots.
Displacements
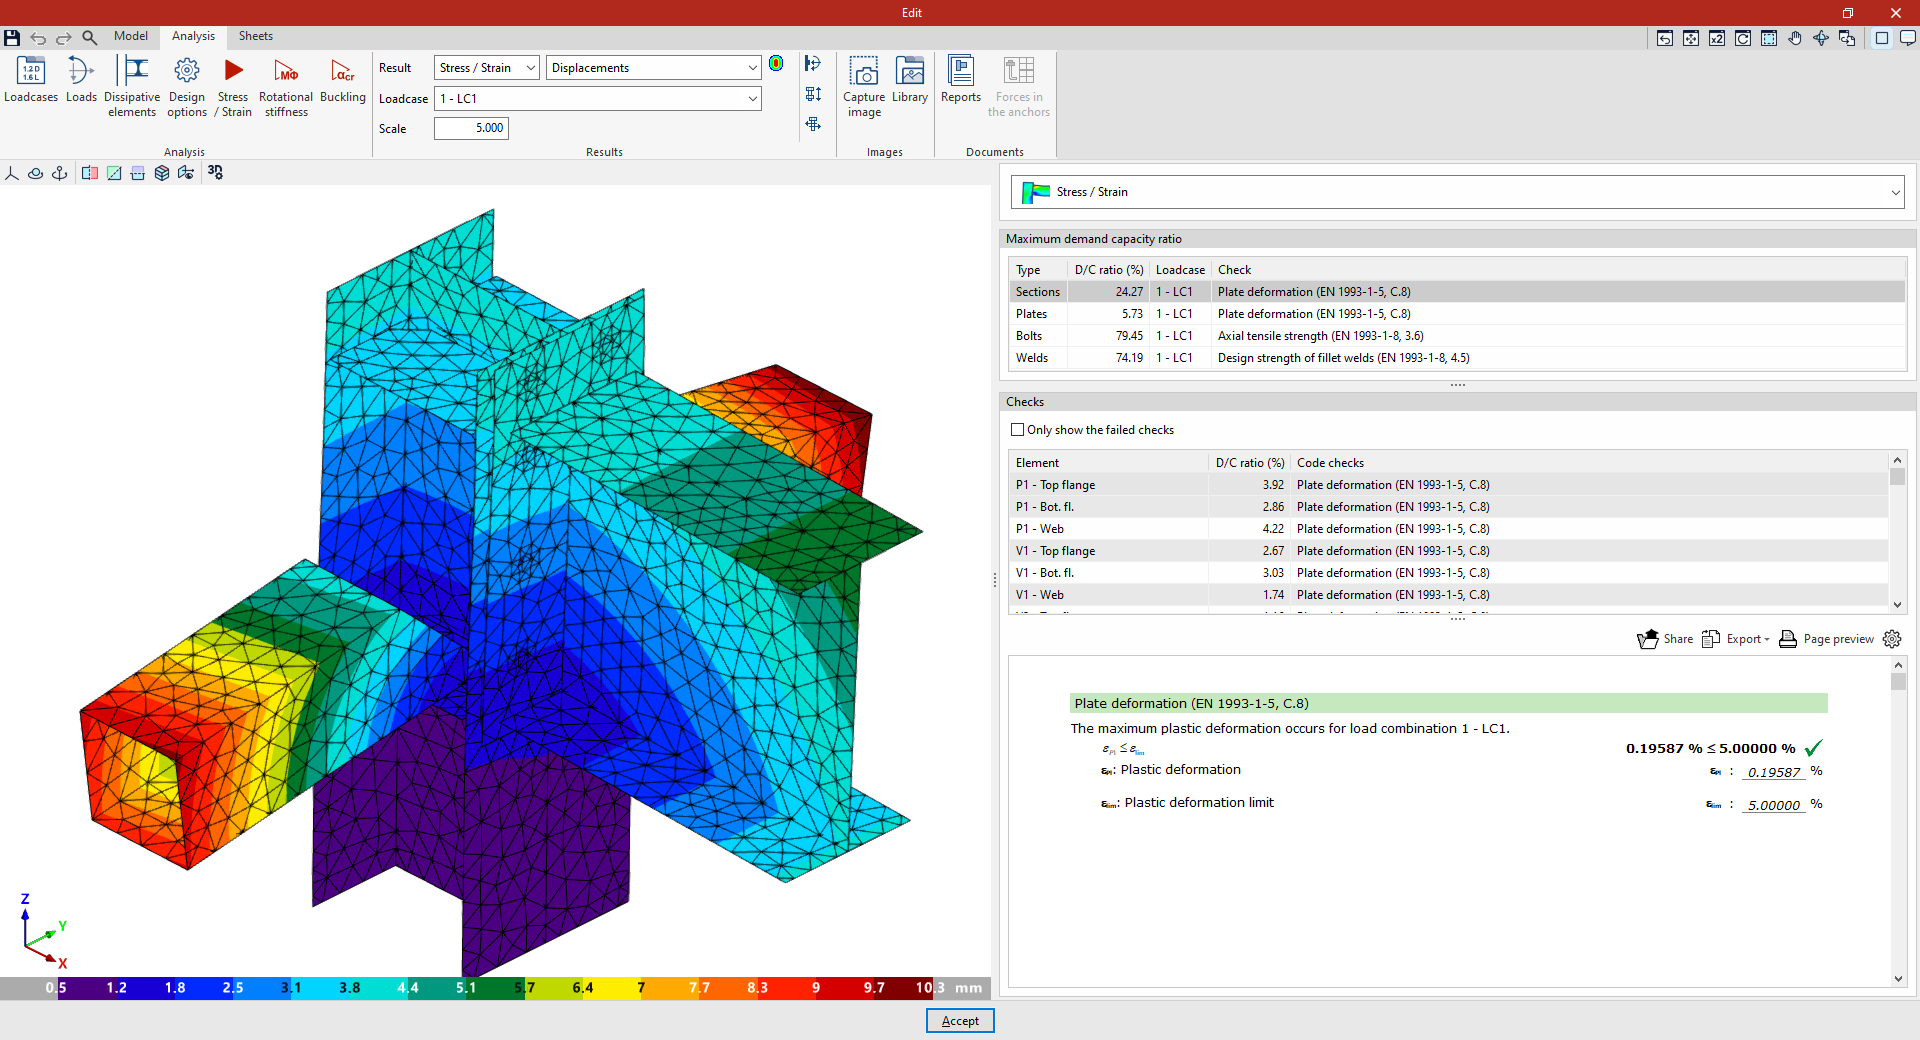
Finally, the "Displacements" values for the connection elements can be displayed via their representation in the 3D view by selecting the relevant "Loadcase".
You can apply a "Scale" to the displacements by entering a value in the relevant field in the "Results" group on the top toolbar to improve their display.
Display options
To the right of the "Results" drop-down menu, you can configure the "Display options" to adjust the result views by contour plots:
- The "Contour plot representation" can be "Discrete" if you want the program to use a finite colour scale, or “Continuous” if you want it to use a gradient.
- The "Show mesh" option is also included, which allows you to show or hide the finite element mesh by toggling it on or off.
- In addition, "Limit values" can be specified for the display of results by adjusting both the "Minimum value" and the "Maximum value" of the scale.