Graphical analysis of the results of the water supply system
In the "Installation" tab of the "Water Systems" tab, in the "Calculation" group of the main toolbar, there are options for graphically analysing the calculation results of the water supply system:

Viewing the graphical analysis of results
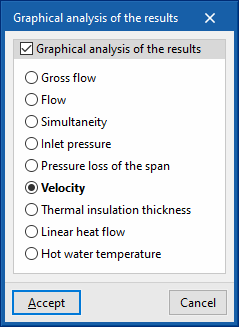
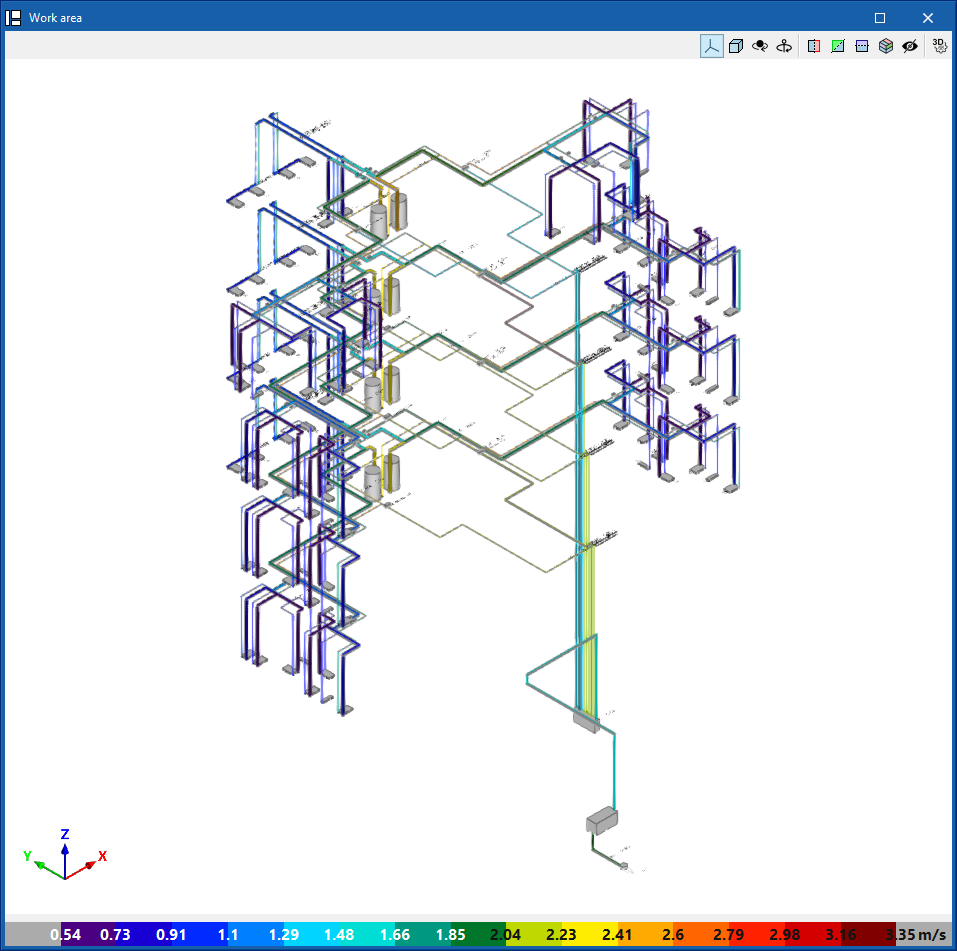
This first option is used to select the magnitude involved in the hydraulic analysis of the system to be analysed from among those available. In the "Work area", the program draws the analysis results of the calculation of the elements in the water supply system using a colour scale, making it easier to analyse them.
The magnitudes available in the graphical analysis of results are as follows:
- Gross flow
- Flow
- Simultaneity
- Inlet pressure
- Pressure loss of the span
- Velocity
- Thermal insulation thickness
- Linear heat flow
- Hot water temperature
To update the results information, the model must be re-analysed.
Editing the graphical analysis of results
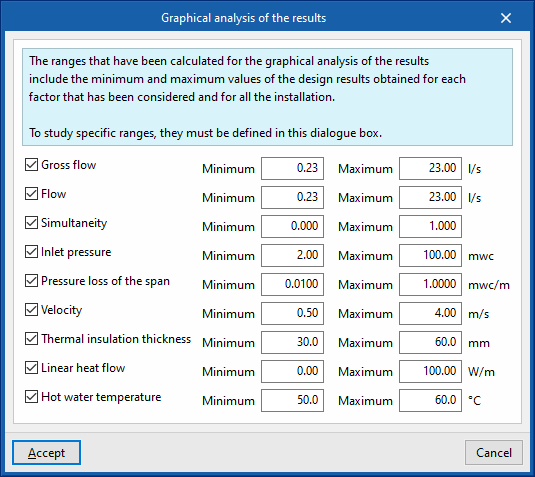
In the graphical analysis of results, the program displays the minimum and maximum values obtained in the analysis for each magnitude in the whole system by default. However, in the dialogue box that opens with this second option, the colour scale can be adjusted by specifically entering the minimum and maximum values for each of the following magnitudes:
- Gross flow (Minimum, Maximum)
- Flow (Minimum, Maximum)
- Simultaneity (Minimum, Maximum)
- Inlet pressure (Minimum, Maximum)
- Pressure loss of the span (Minimum, Maximum)
- Velocity (Minimum, Maximum)
- Thermal insulation thickness (Minimum, Maximum)
- Linear heat flow (Minimum, Maximum)
- Hot water temperature (Minimum, Maximum)