
Results output
The analysis results can be obtained in the following ways:
Viewing results on screen
After the analysis, the results can be displayed directly on the screen by means of contour plots or contour lines, both on the floor drawings and in the 3D view. The program indicates the highest and lowest power zones depending on the proximity to the emitter or wireless access point. From "View results" at the bottom left of the interface, the display option between contour plots or contour lines can be changed.
| Best practice: |
|---|
| To regenerate the 3D view, click on the "Redraw" option located on the top toolbar of the 3D model. |


On the other hand, when selecting the "Consult results" option in the "Analysis" group, CYPETEL Wireless shows the results in the tooltip or informative text that appears when the cursor is positioned on an element in the system, such as the reception points or transmitters, as well as the checks carried out on them.

Results reports by element
Using the "Consult results" option in the "Analysis" group and clicking on the reception points, the corresponding report of results for each element can be accessed.
These reports show a summary of the analysis results of the selected element and detail the calculation expressions used, as well as the magnitudes obtained.

Job reports
The program can print the reports directly or generate HTML, PDF, TXT, RTF or DOCX files.
The reports are obtained via the "Reports" option in the "File" menu or in the top toolbar.
- Report
Displays information on the analysed results for the system entered, organised in the following sections:- Floor plans
For each floor, a table with the minimum and maximum received power (dB) for each type of space is displayed, as well as a drawing for displaying the results by means of contour plots. - Emitters
Displays a table showing the power (dB) to which each emitter is set, indicating its reference and location.
- Floor plans

Drawings in DWG, DXF or PDF format
The program can print the drawings of the job on any graphic peripheral configured on the computer, or create DWG, DXF or PDF files.
Editing the drawing allows the following options to be configured:
- Scale
- Reference
- Floor plans
- Details
The drawings can be obtained via the "Drawings" option in the "File" menu at the top of the interface.


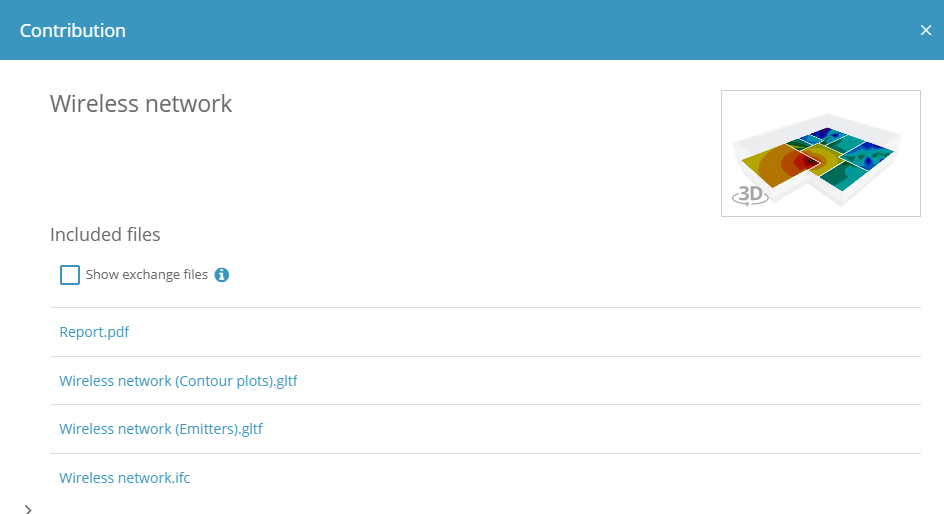
GLTF file compatible with BIMserver.center
When exporting a job that has been analysed from CYPETEL Wireless to the project hosted on the "BIMserver.center" platform, the IFC file generated includes two .gltf files: one with the coverage contour plot diagrams in the 3D view and the other with the position of the emitters. This means that both can be visualised independently in:
- on the online platform;
- in the BIMserver.center app for iOS and Android;
- in virtual reality and augmented reality;
- in other CYPE programs.
The .gltf file corresponding to the emitters provides detailed information on the emitters, such as:
- Emitter reference.
- Emitter type.
- Installation height.
- Transmitting power.
Bill of quantities
In addition to generating "Bill of quantities reports", the system's bill of quantities can be exported to the standard FIEBDC-3 (.bc3) format so that it can be read by any compatible application.
To carry out the export, simply use the "Export BC3" tool in the "Import/Export" group of the "Bill of quantities" tab, assign a name to the file and activate the desired boxes to include associated information (graphic information, attached documents, specifications, technical information, etc.).