
Reports
The "Reports" group in the upper toolbar of the "Analysis" tab contains the options for viewing the reports generated by the program, which include reports of the analysis results and the definitions made.

The available reports are as follows:
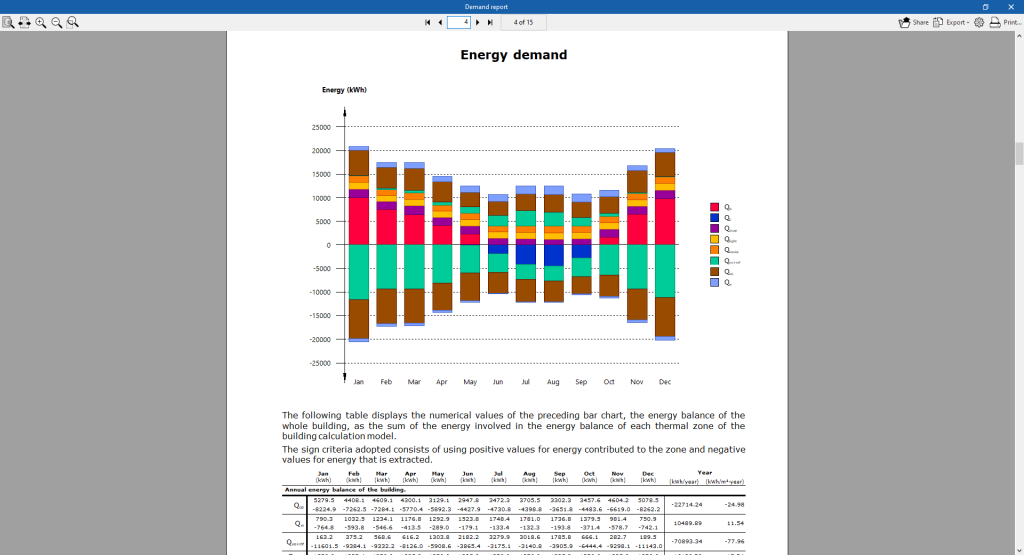
Demand report
Contains the results of the "Demand" simulation. The results of the energy demand for heating and cooling of the building and per heating zone are provided. The results of the energy balance in the building and the annual energy and power demand of the building are included graphically.
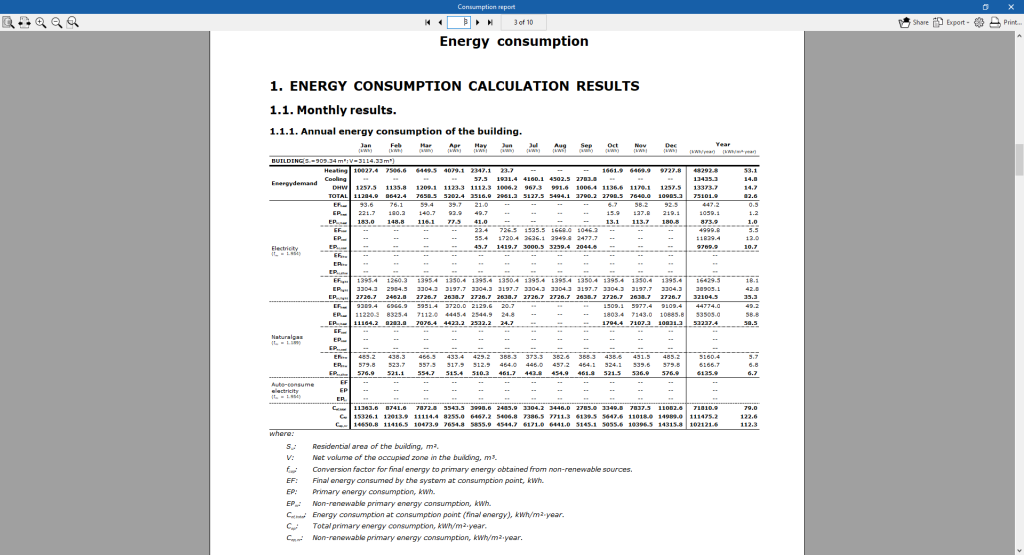
Consumption report
Contains the results of the "Consumption" simulation. It provides results of the building energy consumption for heating, cooling and domestic hot water, classified according to the type of final energy consumed.
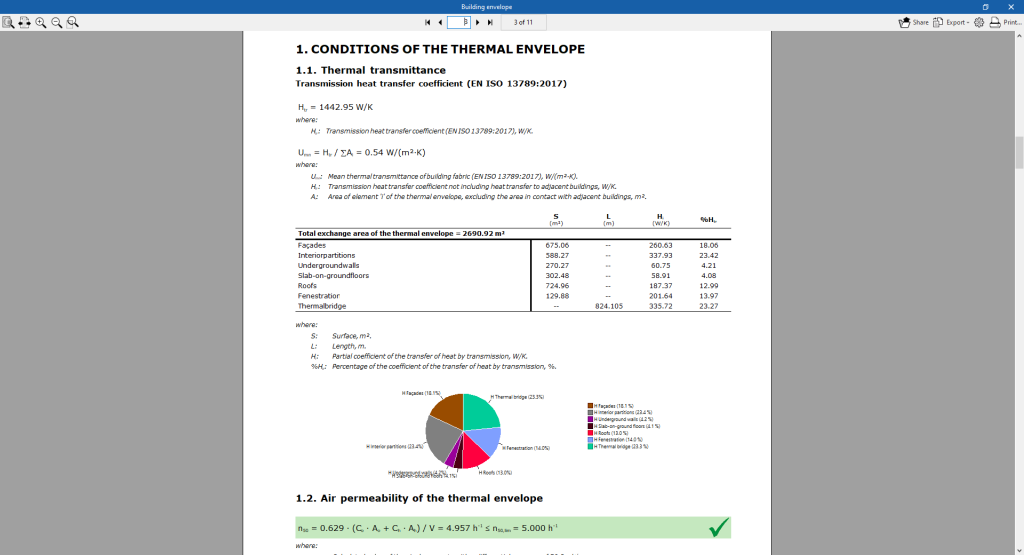
Building envelope
Contains the results of the transmittance heat transfer coefficient calculated according to EN ISO 13789:2017 and the air permeability of the thermal envelope. A breakdown by elements is made and the thermal transmittance (U) value of each element is compared with the limit value set by the user.
Complementary reports
This option is used to display and print the following complementary reports:
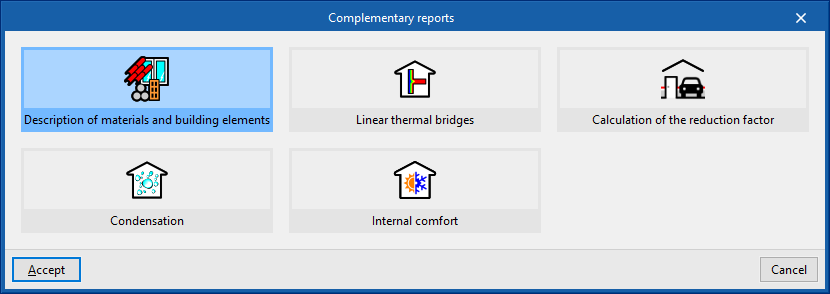
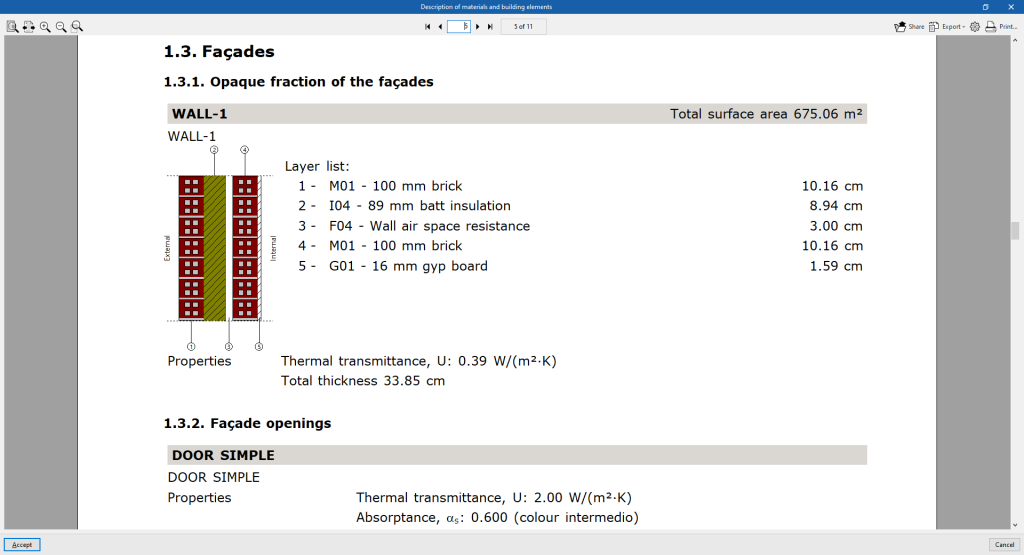
Description of materials and building elements
The different elements in the job are shown together with their materials, quantities, transmission coefficients, etc. The envelope system (external envelopes, floors, roofs and openings) and the compartmentalisation system (vertical partitions and floor slabs between floors) are specified.
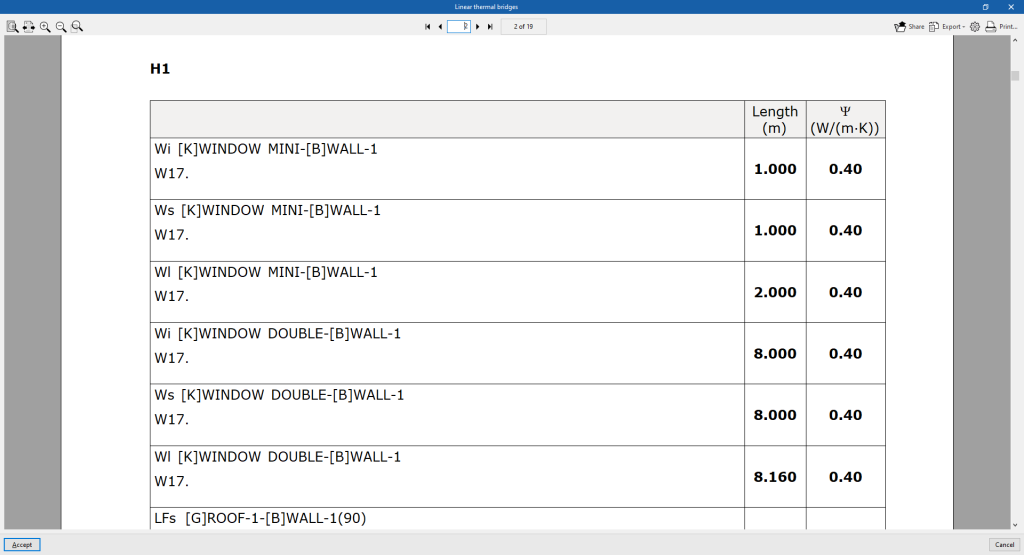
Linear thermal bridges
The thermal bridges defined in each zone and their characteristics are listed.
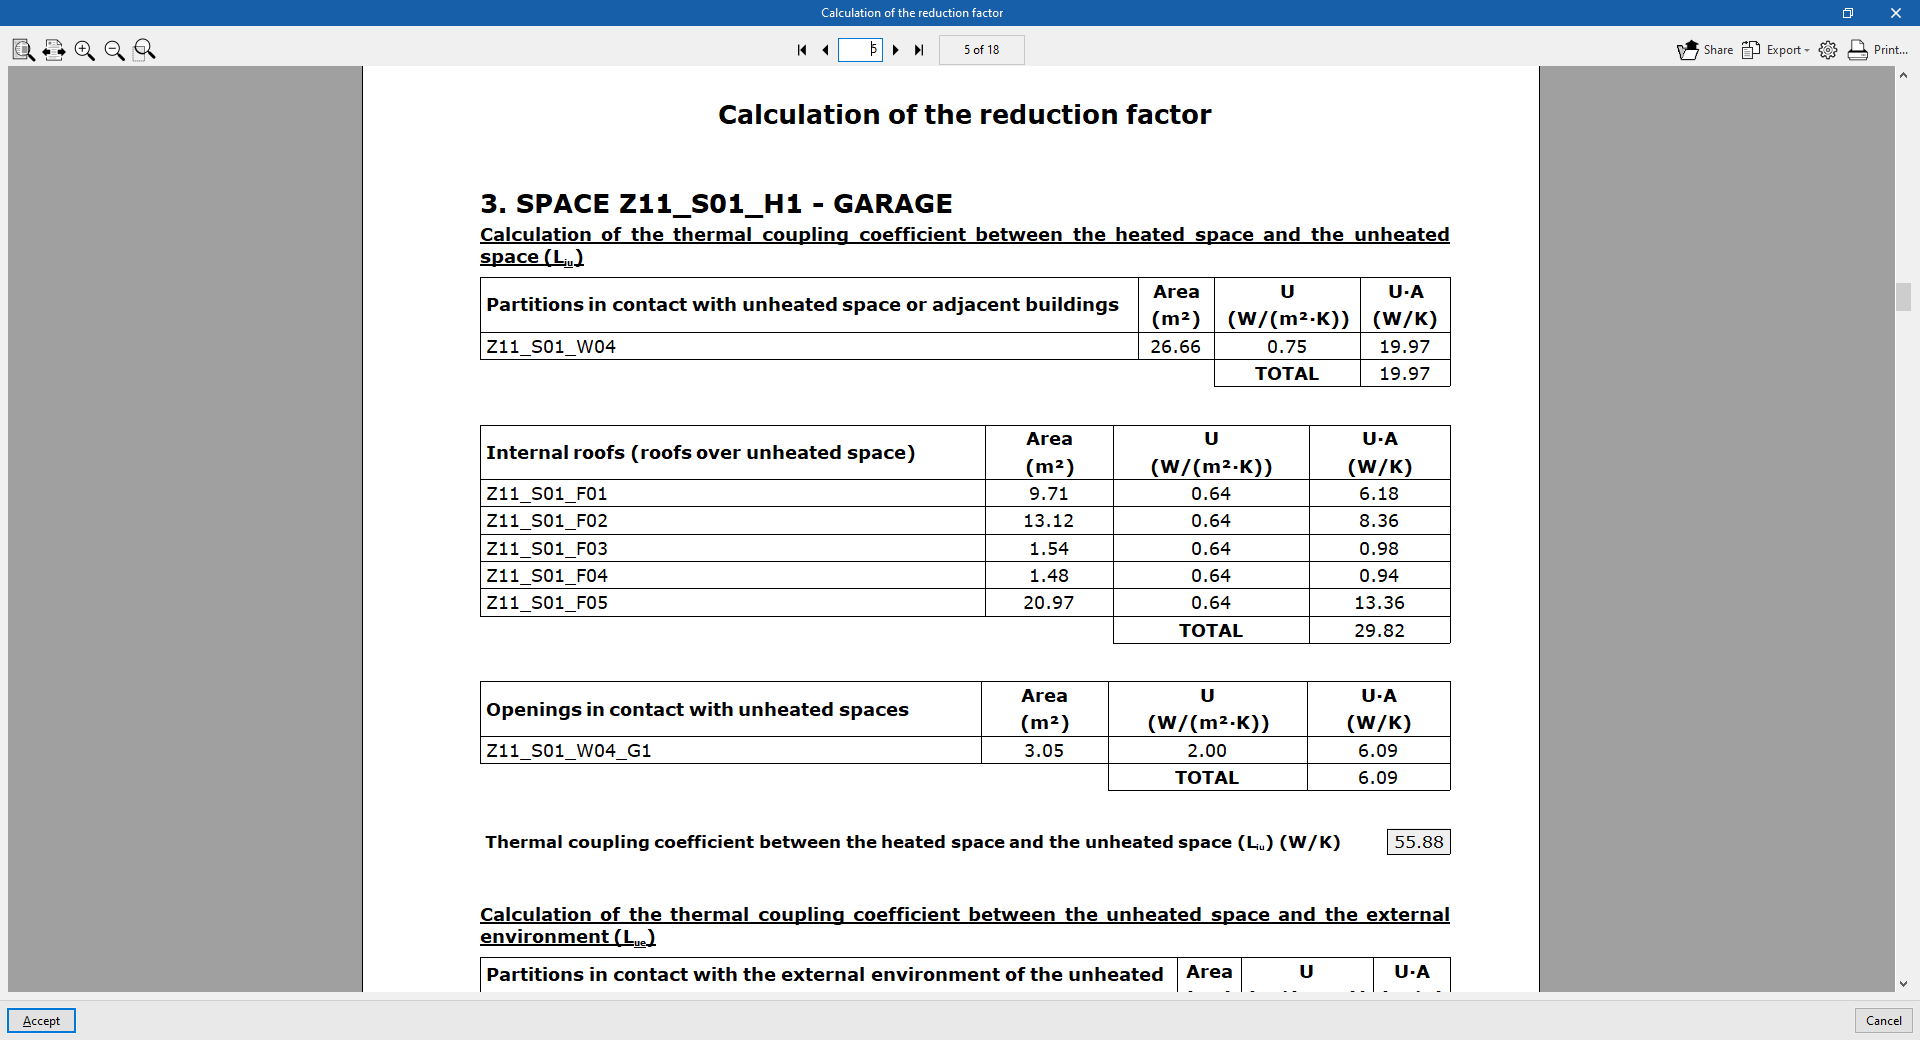
Calculation of the reduction factor
Contains the methodology and detailed results of the calculation of the heat transfer to the unconditioned spaces of the building according to EN ISO 13789:2017. These results are used in the calculation of the transmission heat transfer coefficient in the "Building envelope" report.
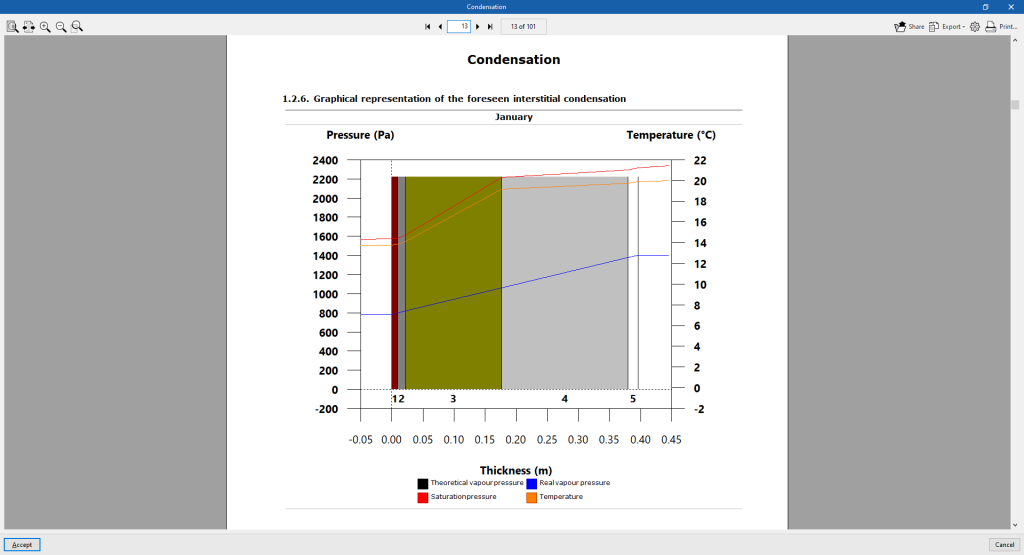
Condensation
This report is available if the "Check for the existence of surface and interstitial condensation in accordance with ISO 13788" option has been selected under "General parameters".
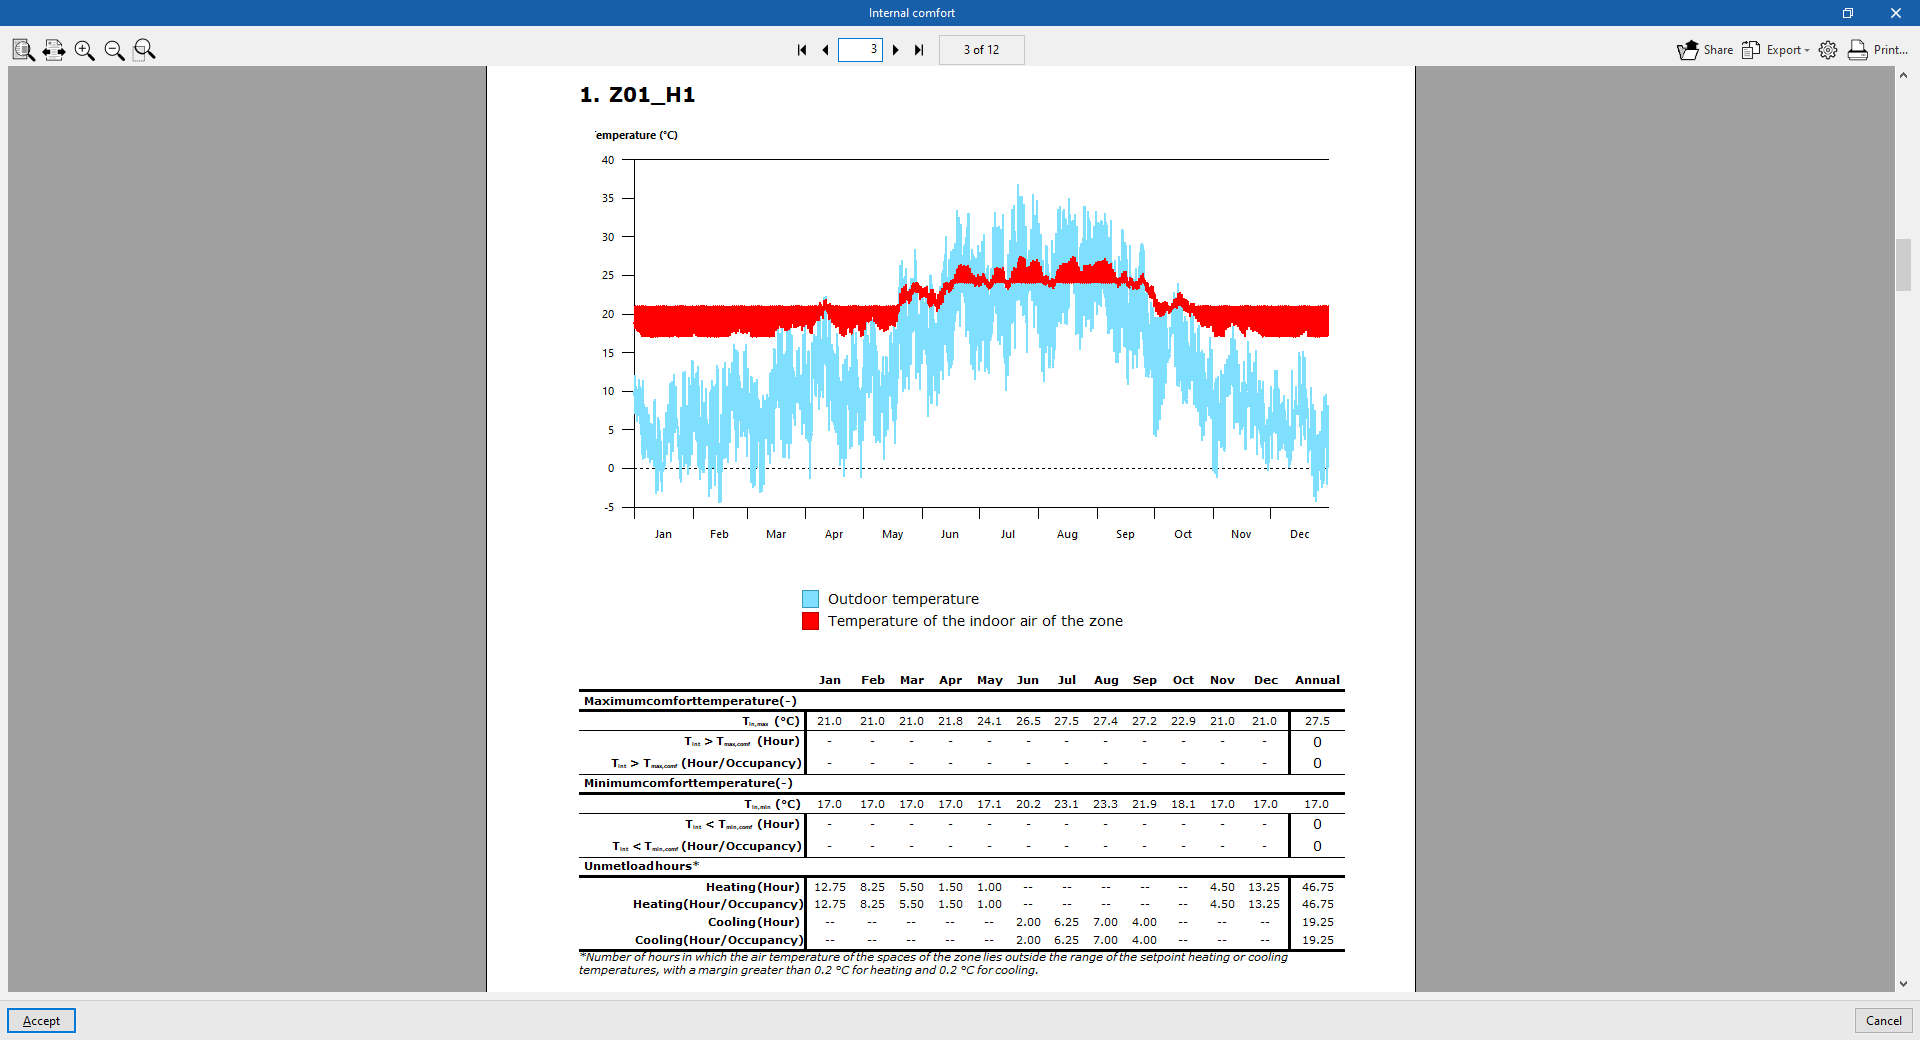
Internal comfort
The report allows users to visualise the evolution of the indoor temperature of the zones by means of graphs and tables, comparing it with the outdoor temperature. The number of hours that the indoor comfort temperature defined in each zone is exceeded and the number of hours outside the setpoint are counted.
The results of the indoor air temperature of the zones and the outdoor air temperature, for each hour of the year, are exported to a .csv file available in the ‘_dat’ directory associated to the program file. The numerical values of this file coincide with those represented graphically in the "Indoor comfort" report.
The default path to this file is C:\CYPE Ingenieros\Projects\CYPETHERM
EPlus\job_name.tri_dat\Energyplus\Project_cons.res\Zone air temperatures.csv
Document viewer options
The document viewer, which appears when displaying any report, has the following options at the top:
- Share
Shares the selected document over the internet. The document will be stored on a server in PDF format and an address will be generated to access it. Only people with this address will be able to access the file. - Export
The document can be saved in a variety of formats, including PDF, DOCX, TXT, HMTL and RTF. - Print
Sends the document to the printer to be printed directly, with the page settings that have been selected on the button with the gear icon ("Print settings").