Results output
Consulting the results in the "Analysis" tab
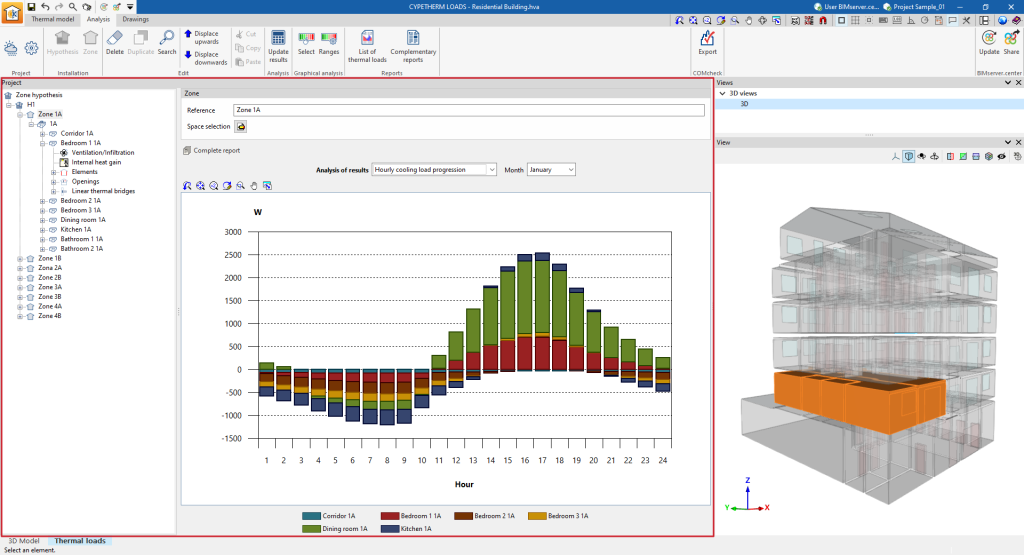
After the calculation, the program can display the results on screen in the project tree of the "Analysis" tab, including the cooling and/or heating thermal loads of the zones, the spaces and each of the associated building elements, as well as various information such as graphs and descriptive texts of the analysis methodology used.
Graphical analysis of results
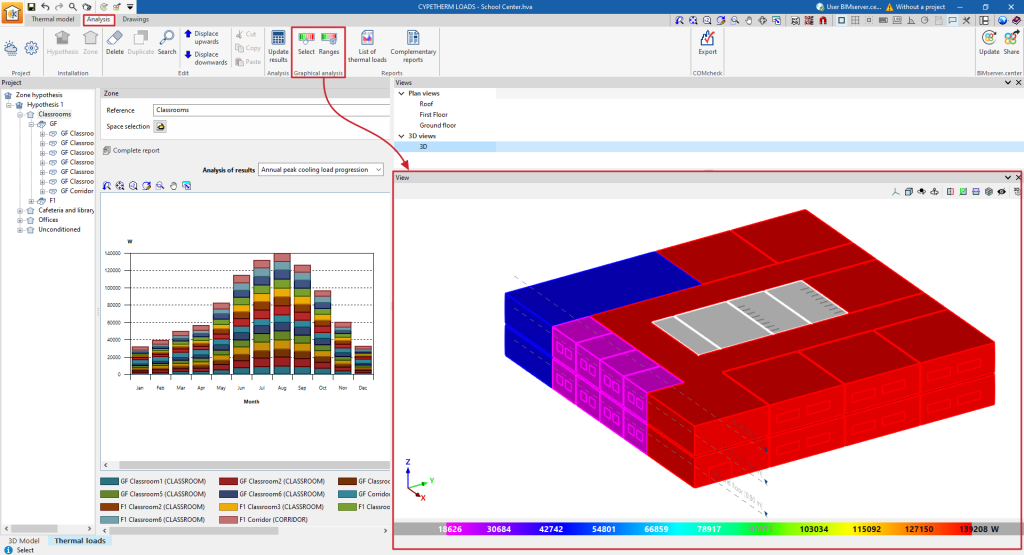
Using the options in the "Graphical analysis of results" group in the main toolbar of the "Analysis" tab, under the "Heat loads" tab, the analysed heat load values can be displayed in the "View" in the lower right-hand area by default. The zones or spaces are coloured and a colour scale is displayed as a key.
Select
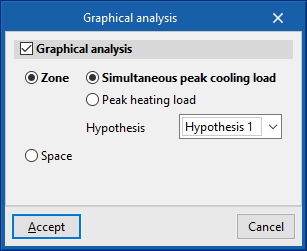
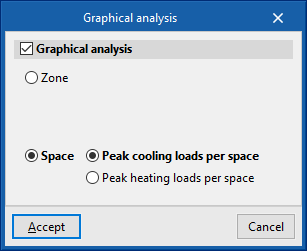
Using the "Select" option, users can select whether the graphical analysis is carried out per zone or space, and which magnitude is used in the coloured representation of the values:
- Graphical analysis (optional)
- Zone
- Simultaneous peak cooling load / Peak heating load
- Hypothesis
Selection of the zone hypothesis to be represented.
- Space
- Peak cooling loads per space / Peak heating loads per space
- Zone
Ranges
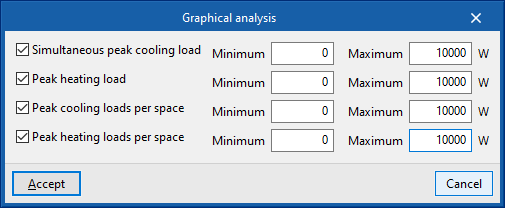
By default, the program shows the minimum and maximum values of each magnitude obtained in the analysis for the whole building. However, the colour scale can be adjusted in the dialogue box that appears when clicking on the "Ranges" option, which allows indicating specific ranges of minimum and maximum values defined for each magnitude:
- Simultaneous peak cooling load (optional) (Minimum, Maximum)
- Peak heating load (optional) (Minimum, Maximum)
- Peak cooling loads per space (optional) (Minimum, Maximum)
- Peak heating loads per space (optional) (Minimum, Maximum)
Reports by hypothesis and zone
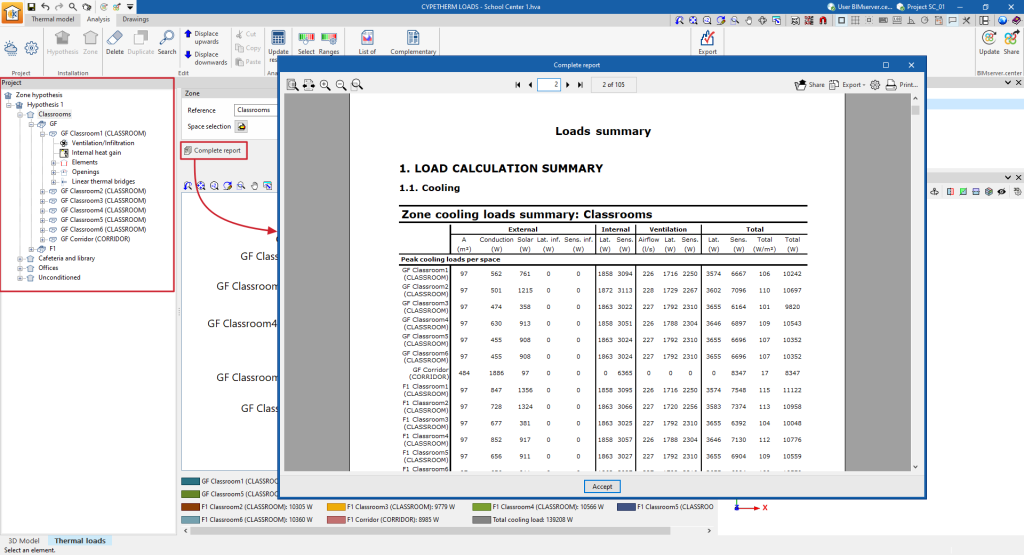
The program generates reports with results for the zone hypotheses and zones, including the data calculated in all the spaces included in each of them. To do this, select the corresponding level in the project tree of the "Analysis" tab, either "Hypothesis" or "Zone", and click on the "Complete report" option.
Thermal load report and additional reports
Using the options in the "Reports" group of the main toolbar of the "Analysis" tab, in the "Thermal loads" tab, the following reports can be generated. The program allows you to print them directly or to generate HTML, PDF, TXT, RTF or DOCX files with their contents.
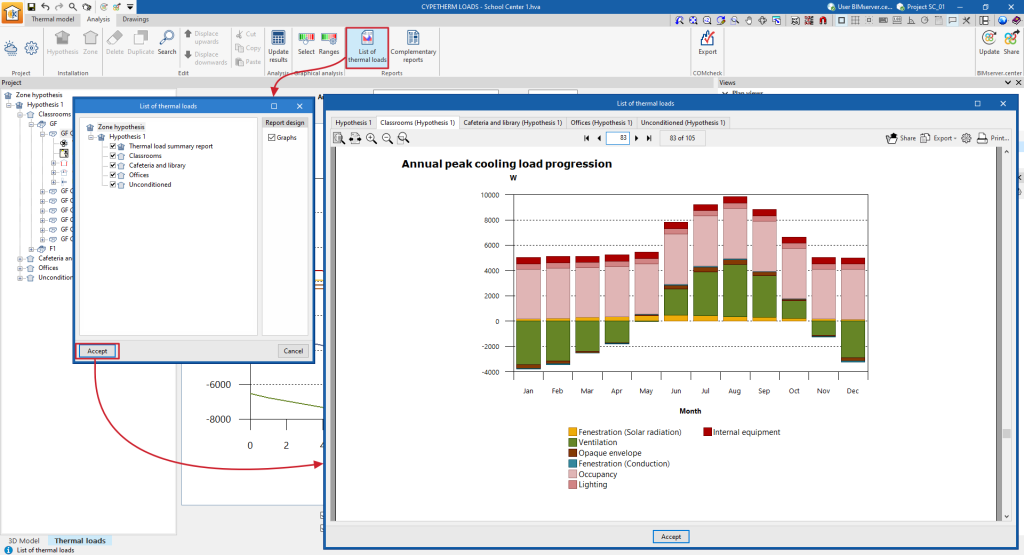
Thermal loads report
The program can be used to select the hypothesis and the zones to be listed, as well as to configure whether the load graphs are to be included. Once accepted, a multi-tab display is generated with the different cooling and/or heating thermal load reports, which include the calculated data for each of the hypotheses and the selected zones, and for each of the associated spaces.
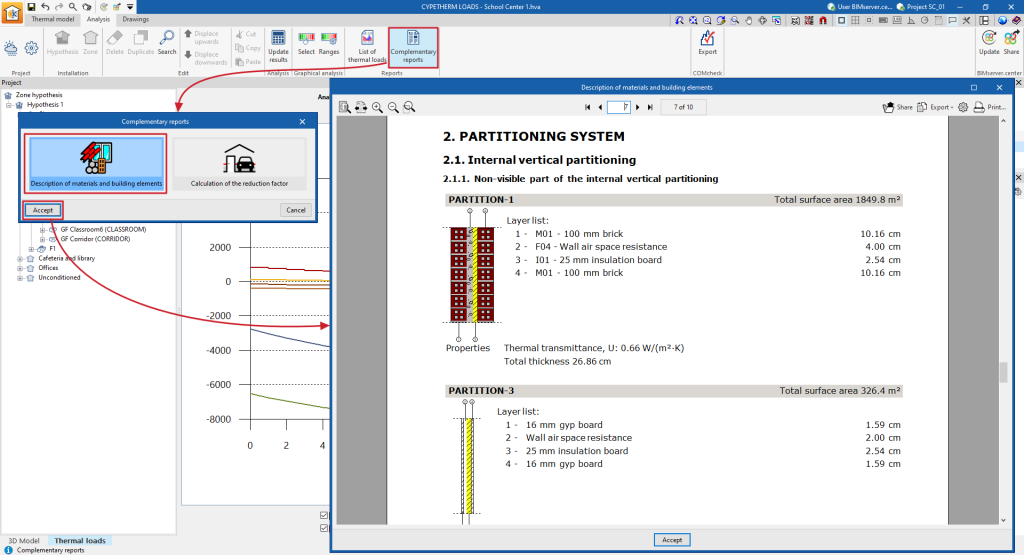
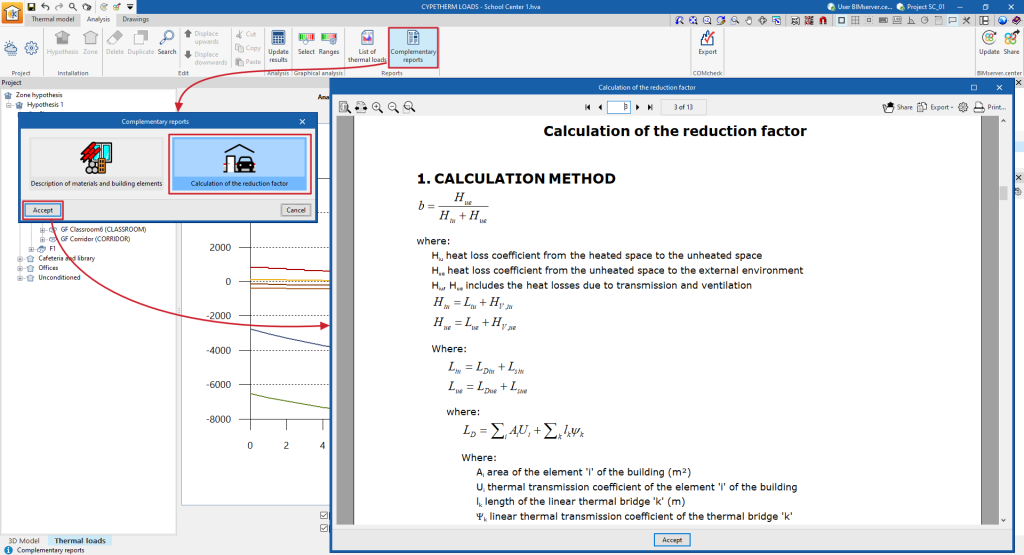
Complementary reports
- Description of materials and building elements
This report describes the building elements that make up the building envelope and the partitioning system (such as slab-on-ground floors, façades, roofs, vertical and horizontal interior partitions), including the definition of the layers of materials they are comprised of.
It also lists the technical properties of the materials used, such as their density, thermal resistance, thermal conductivity or specific heat.
The program uses the ISO 6946, ISO 10077, ISO 13370 and ISO 10456 standards to compile this data.
- Calculation of the reduction factor
This report describes the calculation of the reduction factor b, which regulates the heat losses from heated spaces to the outside through unheated spaces, according to ISO 13789, as well as the calculated values for each space.
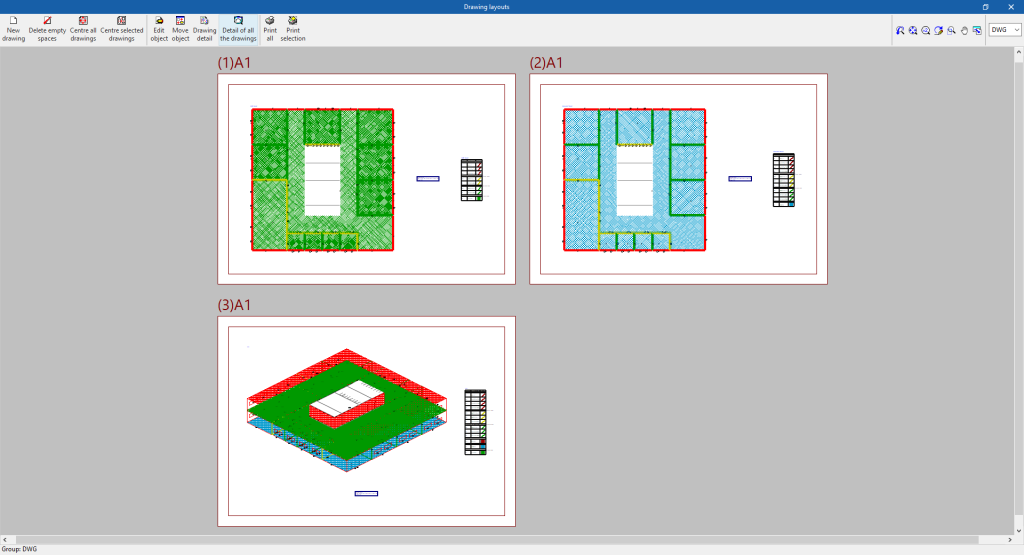
Drawings in DWG, DXF or PDF format
The program can print the drawings of the job on any graphic peripheral configured on the computer, or create DWG, DXF or PDF files.
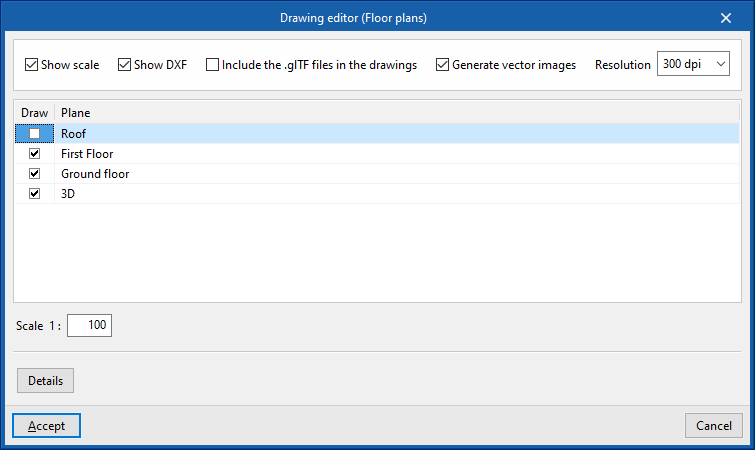
The following options can be configured when editing the drawing:
- Show scale (optional)
- Show DXF (optional)
- Include the .glTF files in the drawings (optional)
- Generate vector images (optional)
- Resolution (96 ppp / 150 ppp / 300 ppp / 600 ppp)
- Views to be drawn
- Scale
- Details
Drawings can be obtained via the "Drawings" option at the top of the interface or via the "Drawings" option in the "File" menu.
