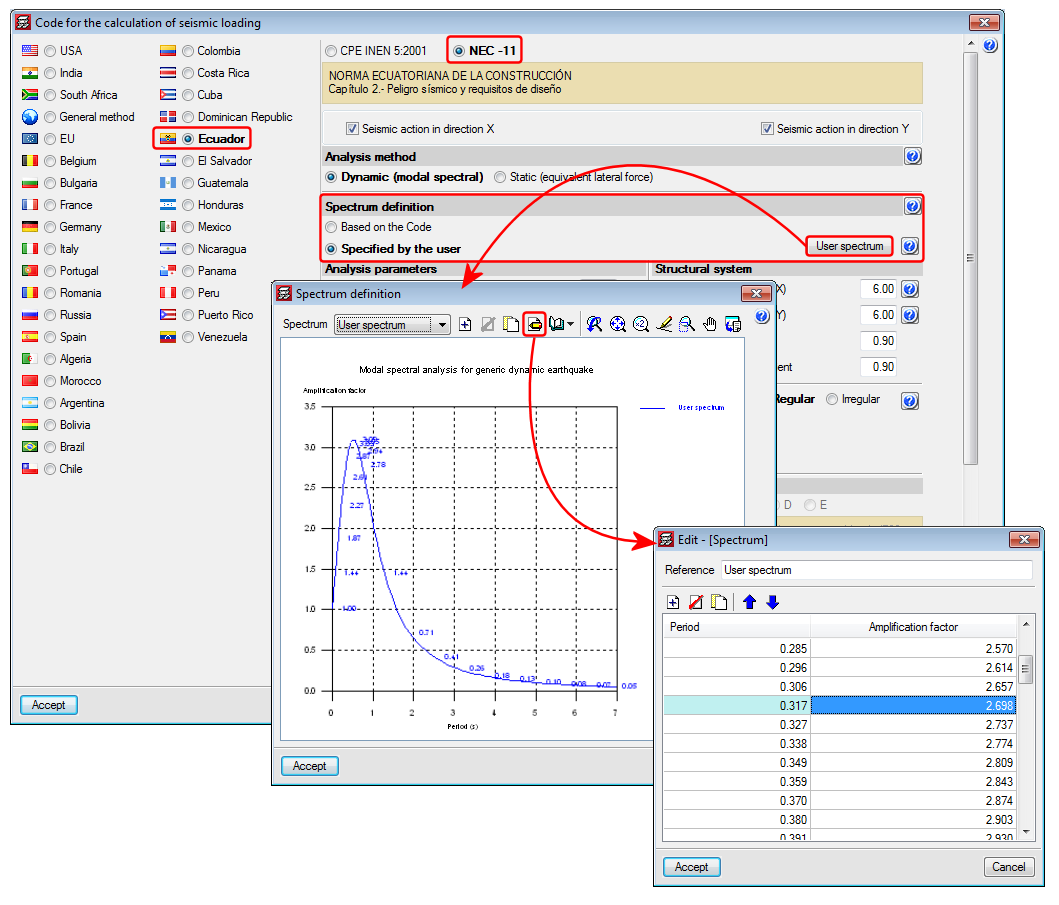
Update history​​

CYPE 3D

  • NEC-11 (Ecuador)
    Norma Ecuatoriana de la Construcción. Capítulo 2.- Peligro sísmico y requisitos de diseño.
  • Norma Técnica E.030 (Peru)
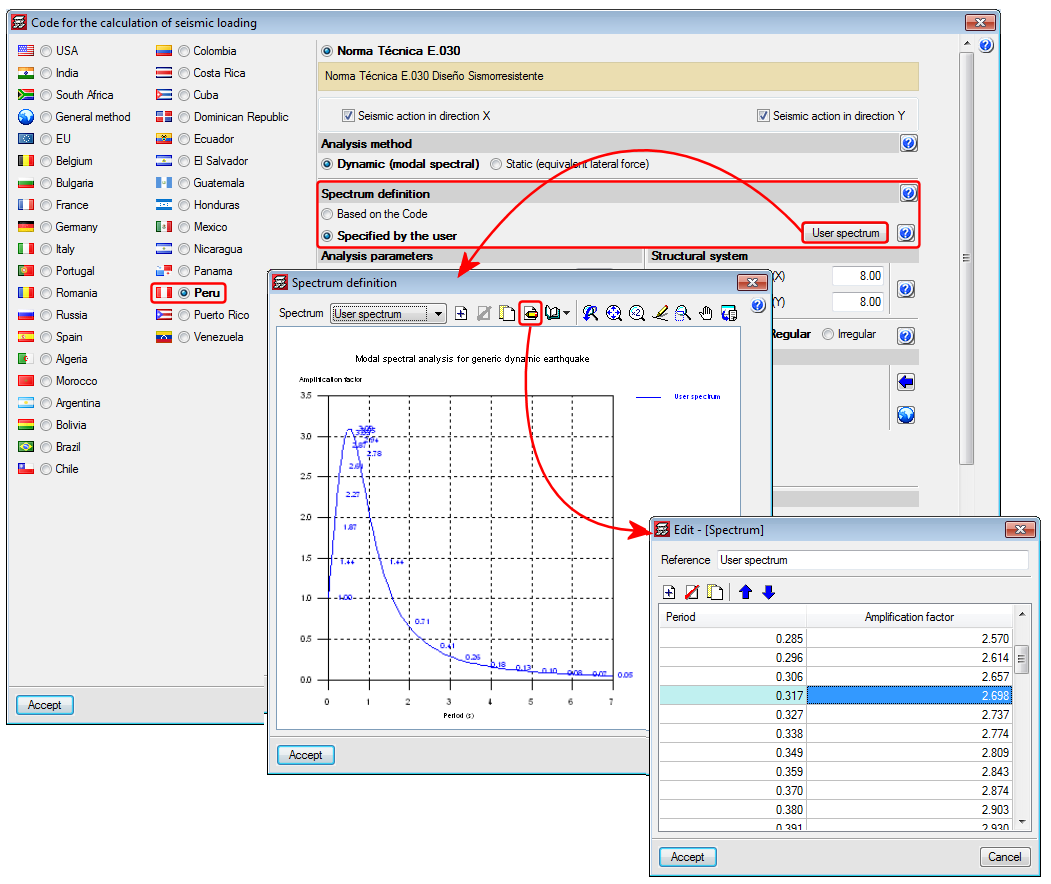
    Norma Técnica E.030 Diseño Sismorresistente.

These codes were already implemented in an earlier version of CYPECAD and CYPE 3D. Now, in the 2015.h version, users can define the seismic spectrum.

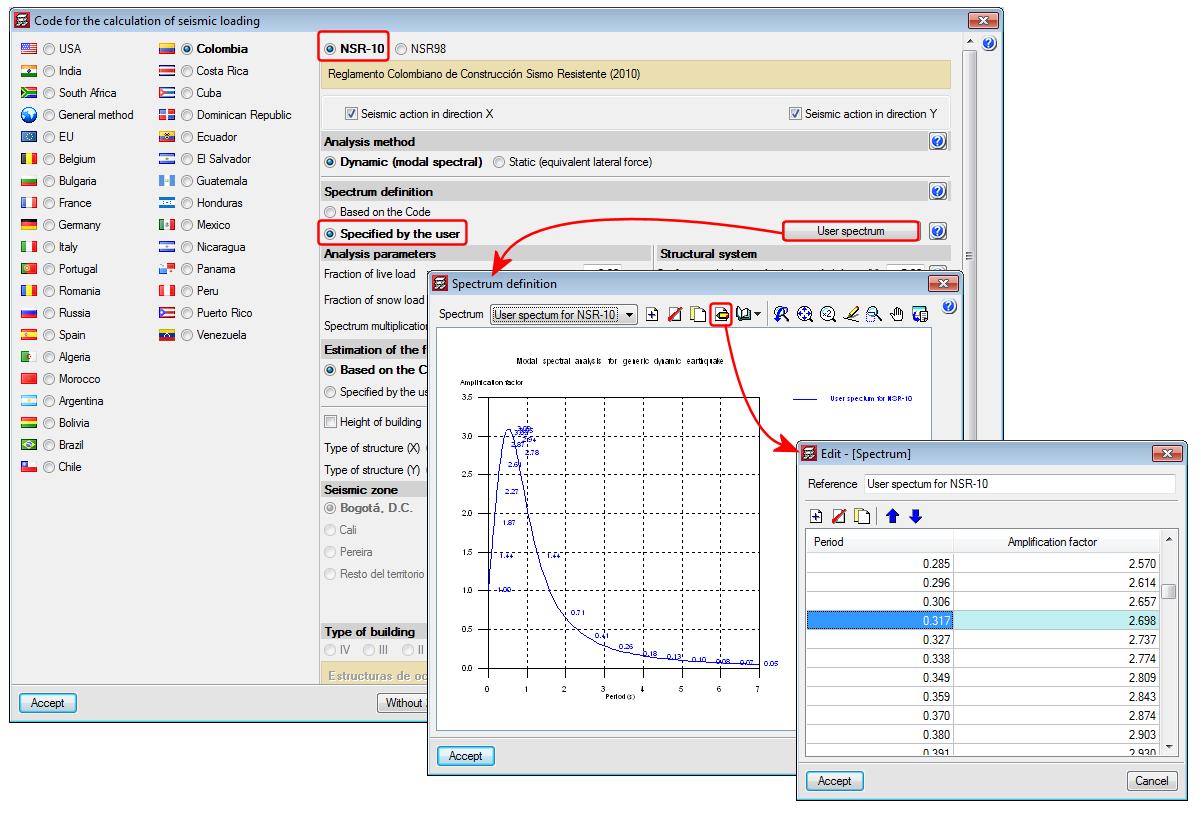
A design spectrum must be defined for the seismic analysis of the structure. Each seismic code provides the criteria to be followed, within a specific territory, when considering seismic action in the project. Nevertheless, the project designer may adopt, under his/her responsibility, different criteria to that established in the code. The program provides users with the tools to be able to contemplate this possibility for the selected codes. The design seismic spectrum can be:

  • Calculated according to that specified in the seismic code to be applied
  • Specified by users based on their own criteria

More information on which codes allow users to define a customised design spectrum can be found in the Seismic spectrum specified by users section in the CYPECAD page.ermiten esta posibilidad.

As of the 2015.f version, some types of welded and bolted I-section beam-beam and beam-column connections can be designed and checked in CYPE 3D and in CYPE-Connect when beams reach the web of the other beam, or to the flange or web of columns and are not at a right angle on plan.

The maximum permitted angle will depend on whether the connection can be executed (space available to place bolts) and on design standard limitations (effective weld angle).

Below are the types of connections for which this angle can be used (for both welded and bolted connections):

  • Beam – column flange moment connections
  • Beam – column web moment connections
  • Beam – column flange simple connection
  • Beam – Column web simple connection
  • Beam – beam simple connection

The connection details drawing includes an on-plan view, the angle of the beams with respect to the plane orthogonal to the surface connecting to the column or beam.

As of the 2015.f version, welded and bolted I-section column-lintel connections designed and checked in CYPE 3D and CYPE-Connect, can have slightly eccentrically aligned webs. Both programs can design these connections whilst the projections of the webs of the column and lintel overlap in a plane perpendicular to that of the webs’.

In the 2015.f version, checking bars is an analysis option, and so, users can analyse the structure with or without checking bars. In previous versions, when the job was analysed, bars were checked and users did not have the option to analyse to simply obtain forces.

As of the 2015.f version, results which depend on bars having been checked will not be available if the option “Check bars” has not been activated. By including this option, the use of the program has been optimised especially in the early design stages of the structure where users do not wish to check sections but rather know how the structure behaves and how the forces are distributed.

As of the 2015.f version, when a panel is copied (Job > Copy elements) , all the surface loads applied on the copied panel are also copied automatically. In previous versions, copying a panel did not imply that its surface loads would also be copied, unless the option to copy the surface loads was activated.

As of previous versions, users can create windows to work with all the structure in 3D, part of the structure in 3D included in an orthogonal parallelepiped defined by its diagonal, or in 2D corresponding to selected planes.

As of the 2015.f version, users can create 3D windows of a selection of elements (Window > Open new > 3D view of a selection of elements). Upon selecting this option, users can select nodes, bars and shells; one element at a time or using a capture window. As well as selected bars, the following elements will also appear in 3D windows created in this manner:

  • Bars, even though they have not been selected, whose initial or final node also belong to the selected bars.
  • Bars which have been introduced in the 3D window.

As occurs in any 3D or 2D window, bars that are introduced in 3D windows of a selection of elements generate intermediate nodes at intersection points with other bars only if the option: “Generate nodes at intersection points” (Bar menu); even if these bars are not included in the window.

3D windows created using a selection of elements allows users to work in an isolated manner on part of the structure without having to view the complete structure.

In previous versions, integration strips defined on shells to consult forces could not be represented on drawings neither was a reference or information on the width of each strip available.

As of the 2015.f version, the integration strips can be added in the shell drawings. These integration strips will appear with their reference in the strip editing window, on drawings and in tooltips. Furthermore, information regarding the width of each strip has been added in the forces report.

The speed with which the bars and diagrams are drawn in the program has been optimised. This improvement is more noticeable with large structures, where in previous versions, the image slowed down when it was moved, zoomed into or out of, in the active window.

The following options have been included in the View options section in the Drawing preferences dialogue box (Job > Drawing preferences):

  • Display element information
    Activates and deactivated the tooltip which appears providing information on the element, associated with the active option, on which the cursor is placed (e.g. “Describe section” in the Bar menu).
  • Display texts on the elements
    Activates and deactivates texts being drawn on-screen over the elements.
  • Display the local axes of the elements
    Activates and deactivates the local axes of the elements being drawn on-screen.

Until the 2015.f version, the local axes of the bars or shells, the indicative texts on the elements and information tooltips on bars with specific program options, appeared automatically without the option to hide them. Occasionally, due to overlapping, these items hindered the view of the structure. As of the 2015.f version, users can activate and deactivate these views and so improve their perception of the structure.

The option: Draw stress using contour lines has been included in the new Forces dialogue box of the Analysis menu. This option appears in the “Forces” dialogue box when the “Envelopes” option in the same dialogue box has been activated, and once it has been activated, its effects can be seen when the option “Stress/Use” in the same dialogue box is selected.

By activating the “Draw stress using contour lines” option (meeting the conditions indicated in the previous paragraph) the stress or use factor of the bars is represented on-screen using a colour scale varying from green to red. This representation is carried out for all the bars of the structure if the option “All bars” is activated or only on the selected bars if the option “Draw stress using contour lines” is activated.

Bar spans that do not meet the stress requirements are displayed with a more intense red without differing them from those whose use factor is at 100%. In either case, to see which bars fail the stress requirements, the option: “Draw stress using contour lines” should be activated, which will display the stress distribution of each bar and show those in green whose the use factor does not exceed 100% and in red those that do.

This graphical representation using a colour scale provides a quicker results interface for user to view the use factors of the bars of the structure.

The force viewing tools available in earlier versions of CYPE 3D (Analyse > Forces, Envelopes, Forces at a point and Envelopes at a point) have been unified in a single option (Analyse > Forces) and opens the Forces dialogue box.

The new “Forces” dialogue box allows users to consult force diagrams and envelopes at the selected point and to view the maximum and minimum forces of bars. Values can be displayed at the selected point by moving the cursor along the bar. The “Selected bars only” and “Consult values” options must be selected beforehand.

This window also allows users to assign the scale the force diagrams are to be represented in and select the loadcase or loadcase combination for which the forces are to be displayed.

For users, this represents a substantial improvement regarding the time required to use the option, since there is no need to change tools depending on which type of consultation is to be done.

This code was already implemented in previous CYPECAD and CYPE 3D versions. Now, in the 2015.f version the possibility has been added to define a user seismic spectrum.

A design spectrum must be defined to carry out a seismic analysis of the structure. Each earthquake-resistant code provides the criteria that are to be applied within a specific territory when considering seismic action in a project. Nonetheless, users may opt to, under their responsibility, apply other criteria to those established in the code. The program offers, for this seismic code, different ways to proceed, to contemplate both possibilities. The seismic spectrum can be:

  • Calculated in accordance with that specified in the seismic code to be applied.
  • Specified by users based on their own criteria.
CYPE Mentor