Interface for carrying out the "Energy simulation"
If you have selected "Energy simulation", the program interface displays two tabs at the bottom of the main window, each with a different workspace: "3D Model" and "Energy simulation".
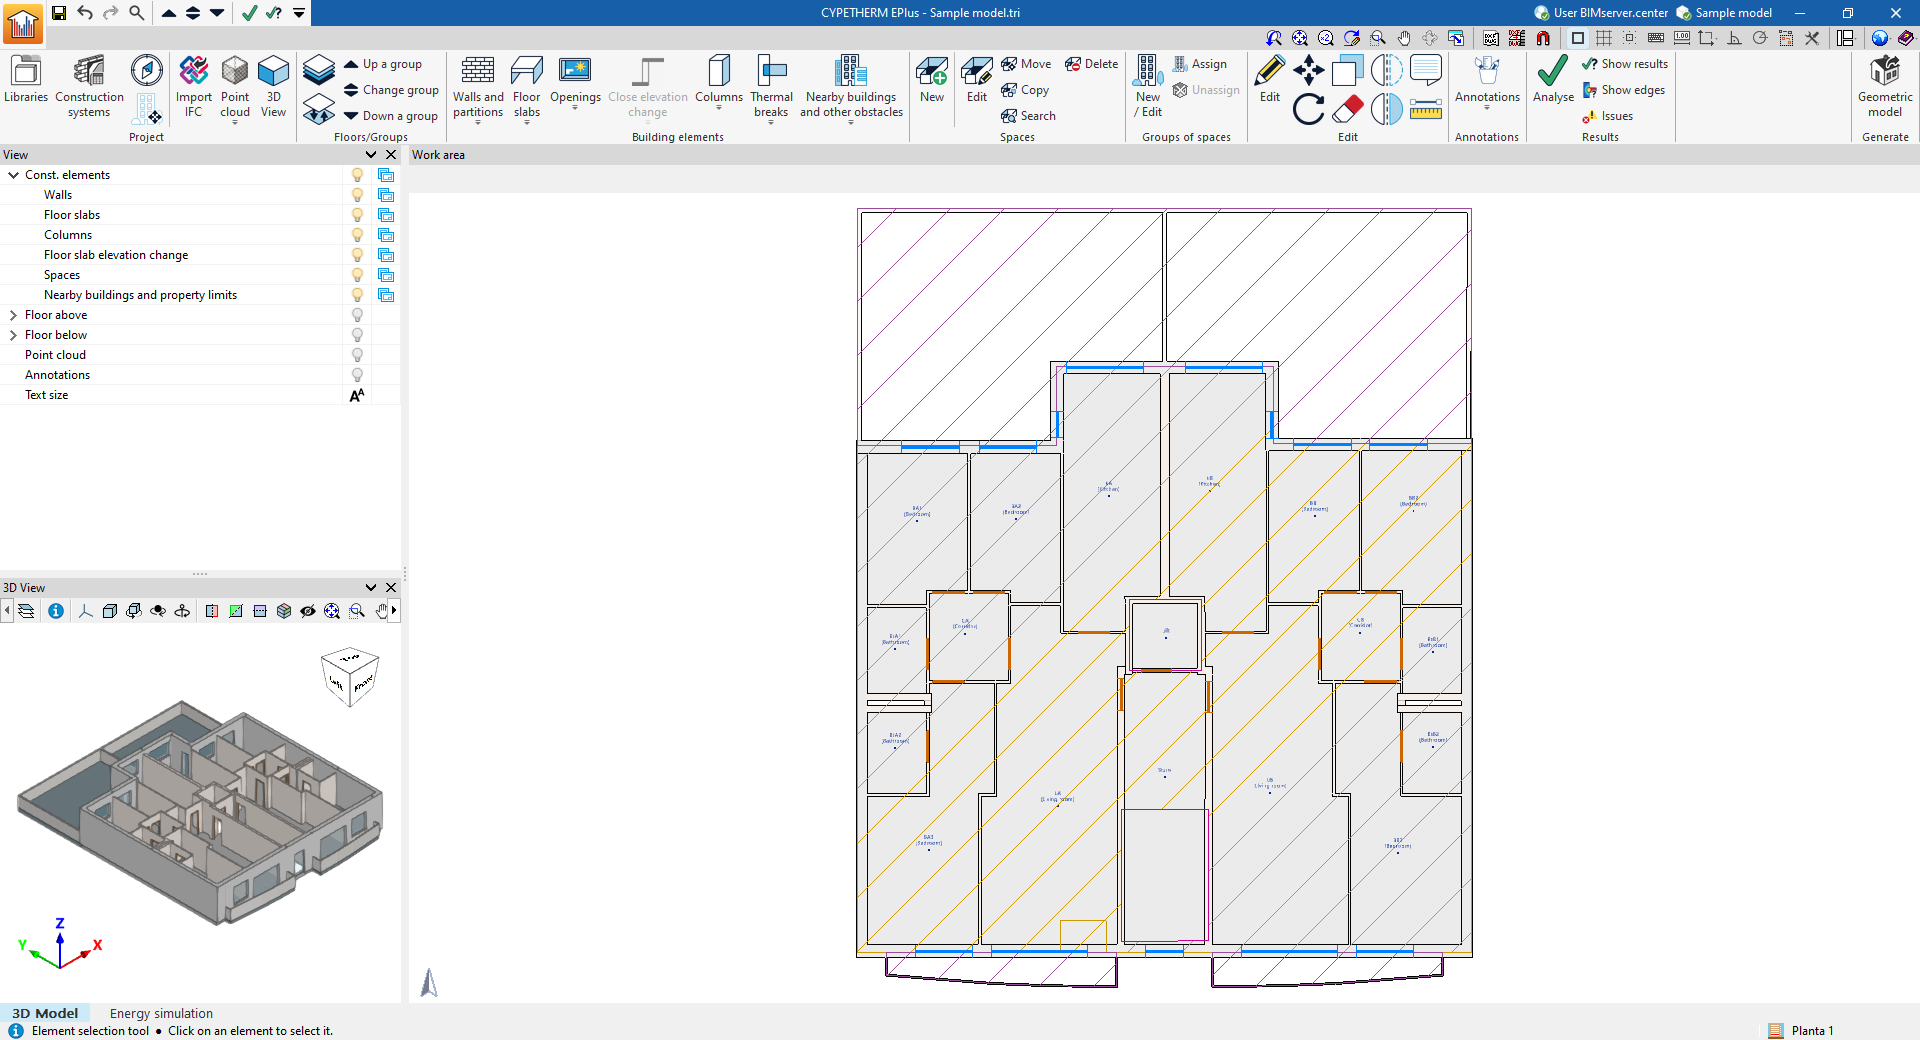
"3D Model" tab
The "3D Model" tab contains tools that allow you to design the geometric or architectural model of the building within CYPETHERM EPlus. It is also possible to define the construction methods.
This tab contains features equivalent to those of the standalone IFC Builder program. Further information can be found on its details page:
| Note: |
|---|
| If the model has been designed in an external program and imported into CYPETHERM EPlus by selecting the option "Import thermal model from project" when creating a new project, the "3D Model" tab will not appear, as there will be no need to use its features. The program will display only the "Energy simulation" tab. |
"Energy simulation" tab
The "Energy simulation" tab contains the tools that allow you to adjust the geometric and structural description of the building and its systems, run the energy simulation and obtain the analysis results.
This tab is further divided into three sub-tabs at the top of the main window: "Building", "Analysis" and "Drawings".
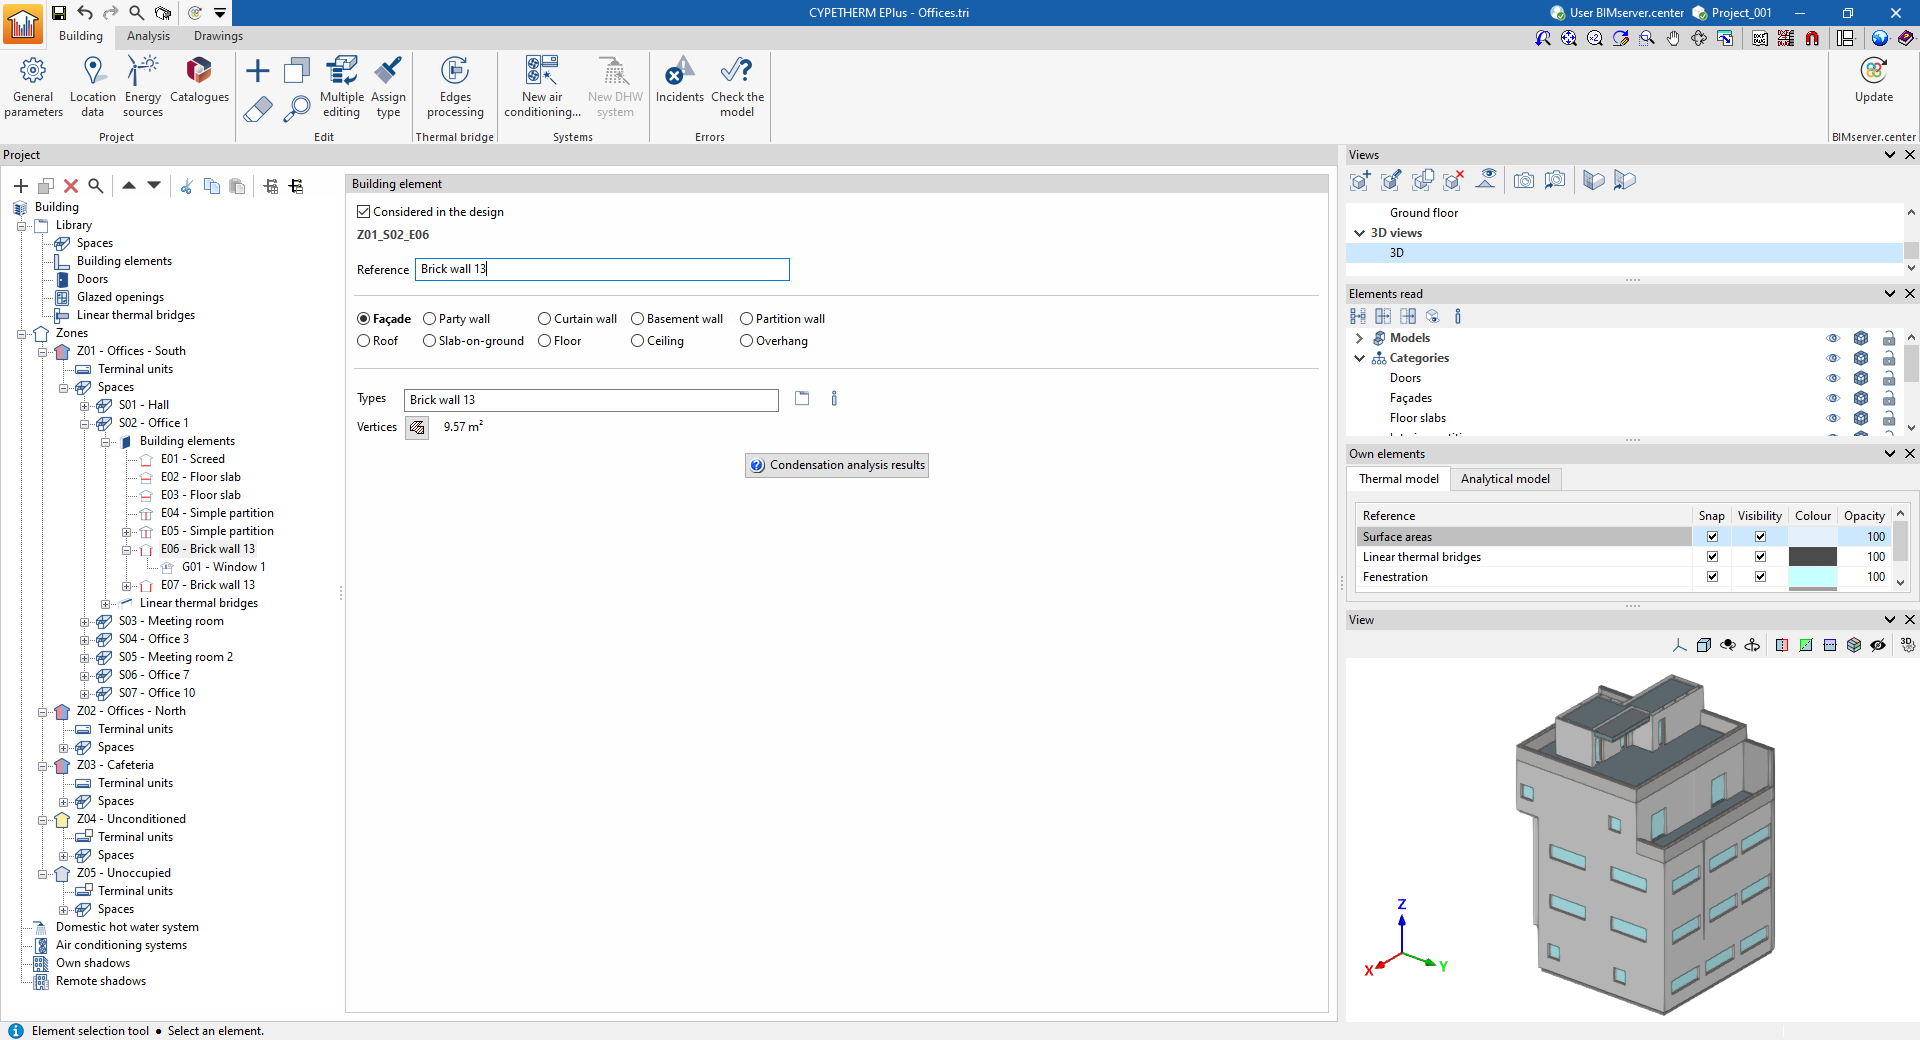
"Building" tab
The "Building" tab is used to define the general parameters, site details and building model.
The interface of this tab is divided into the following sections.
- Toolbar. It is located at the top and contains the program’s main tools.
- Tree diagram of the building. It is located at the top of the left-hand side and contains the elements that make up the analysis model.
- Main editing area. This is located in the centre-right section and allows you to edit the properties of the element selected in the project tree.
- Management of views, imported elements and native elements. The panels on the right-hand side allow you to manage the views of the 3D model and control the display of imported elements from models incorporated into the BIMserver.center project, as well as native elements from the program’s thermal and analytical models.
- 3D model viewer. It is located at the bottom of the right-hand side and allows you to view the position of the element selected in the tree or in the main area within the 3D model.
- Validation pane. This appears at the bottom of the main editing area and displays any warnings or errors encountered when the model is validated.
Further information on the model definition process can be found under the "Building" tab via the following link:
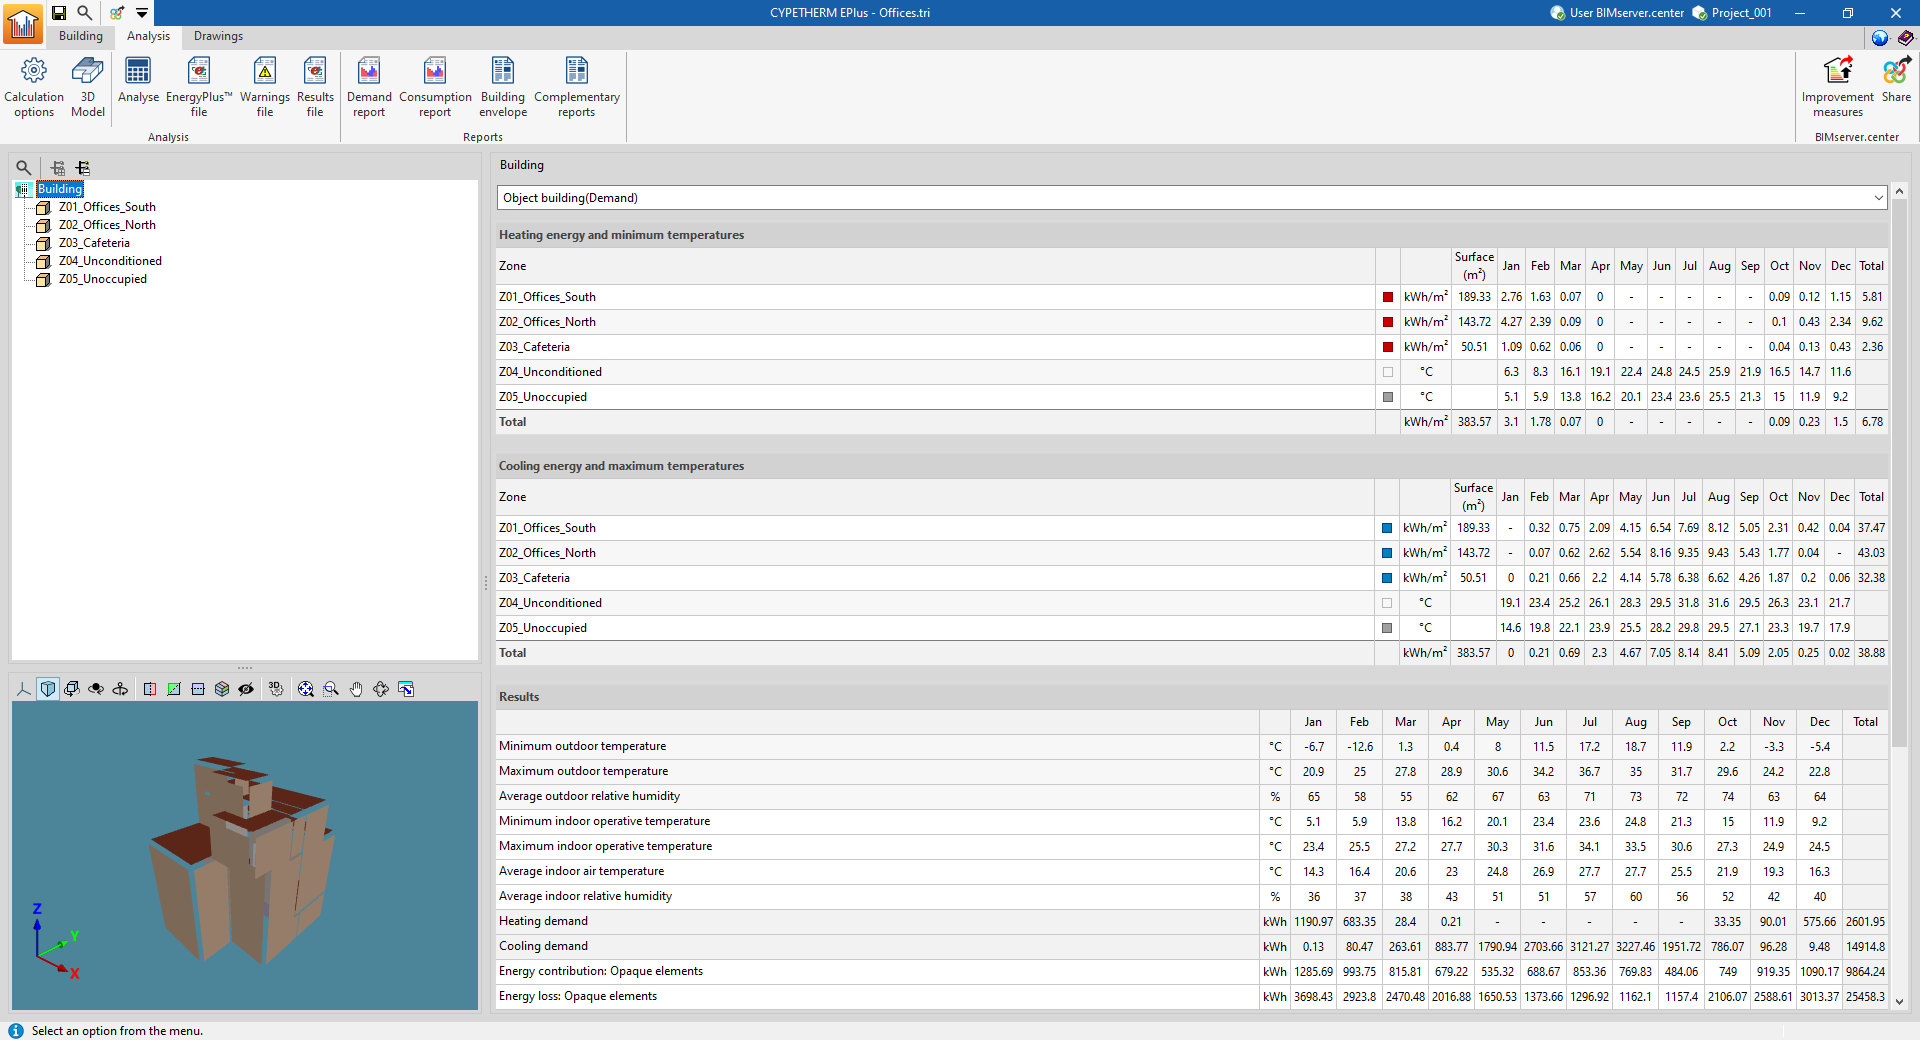
"Analysis" tab
The simulation is run in the "Analysis" tab, and the calculation results are displayed and retrieved.
If the project has not been analysed, a message will appear on screen to this effect. Once the project has been analysed, the results will be displayed in the main window, and the buttons for generating the reports will be highlighted.
The interface of this tab is divided into the following sections.
- Toolbar. This is located at the top of the screen and contains the tools needed to configure and perform the analysis, as well as to access files and lists of results.
- Diagram of the building's thermal zones. It is located at the top of the left-hand side and shows the building's thermal zones.
- Main results display area. This is located in the central area on the right and shows the results for the section selected in the diagram, whether it be the entire building or a thermal zone. The simulation results are displayed in detail on a month-by-month basis, according to the selection made in the diagram. The drop-down menu at the top allows you to view the results of the various simulations carried out (demand or consumption).
- 3D model viewer. It is located at the bottom of the left-hand side and displays the building model sent to the analysis engine; it can also be accessed via the "3D Model" button.
Further information on analyses, checks and the display of results can be found under the "Analysis" tab at the following link:
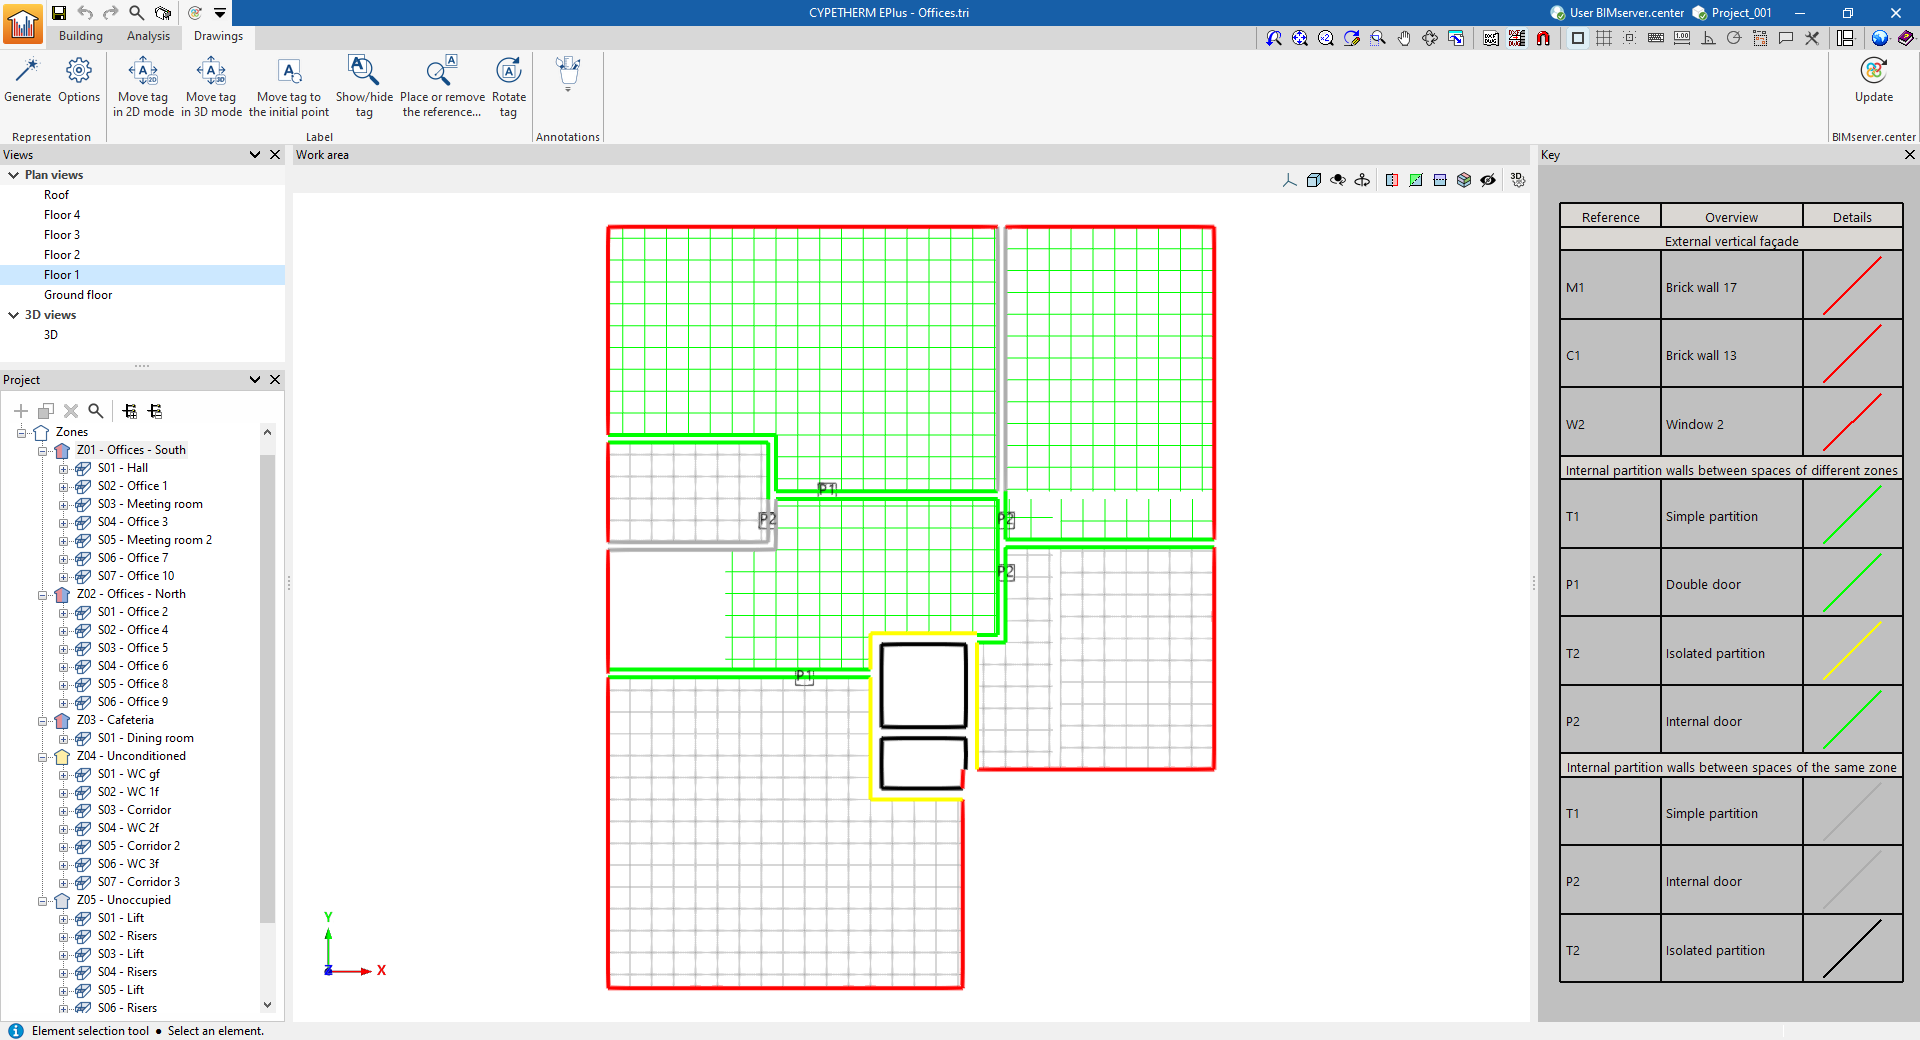
"Plans" tab
The "Drawings" tab contains the building plans (including floor plans), which show the structural elements that make up the building.
The interface of this tab is divided into the following sections.
- Toolbar. It is located at the top and contains tools for editing model elements and configuring the results view.
- View pane. This is located at the top of the left-hand side and allows you to select the view to be displayed in the workspace, including floor plans.
- Project tree diagram. It is located in the centre of the left-hand side and shows the elements that make up the model.
- Workspace. In the workspace, at the centre of the interface, the model is displayed according to the selected view. The elements are coloured according to the legend provided.
- Legend. This area, located on the right, displays the map legend, which shows the details of the graphic representation used for each feature, its reference number and its description.
Further information on the options available under the "Drawings" tab can be found at the following link: