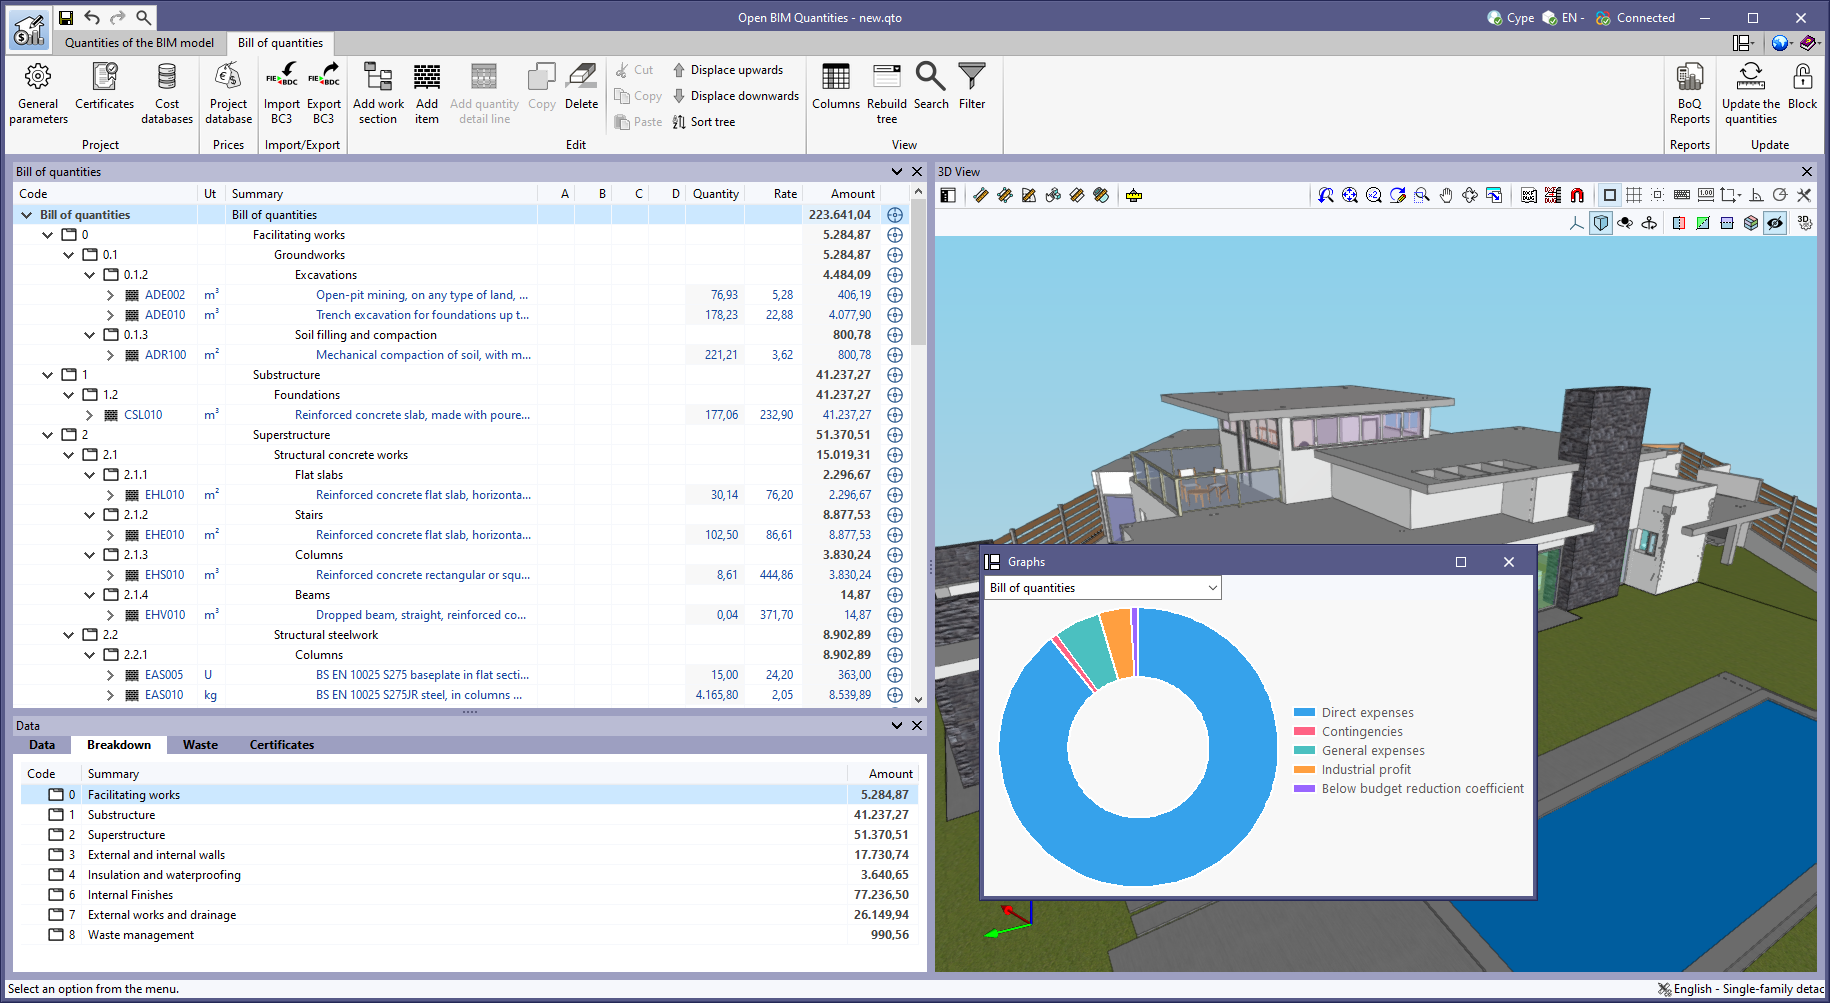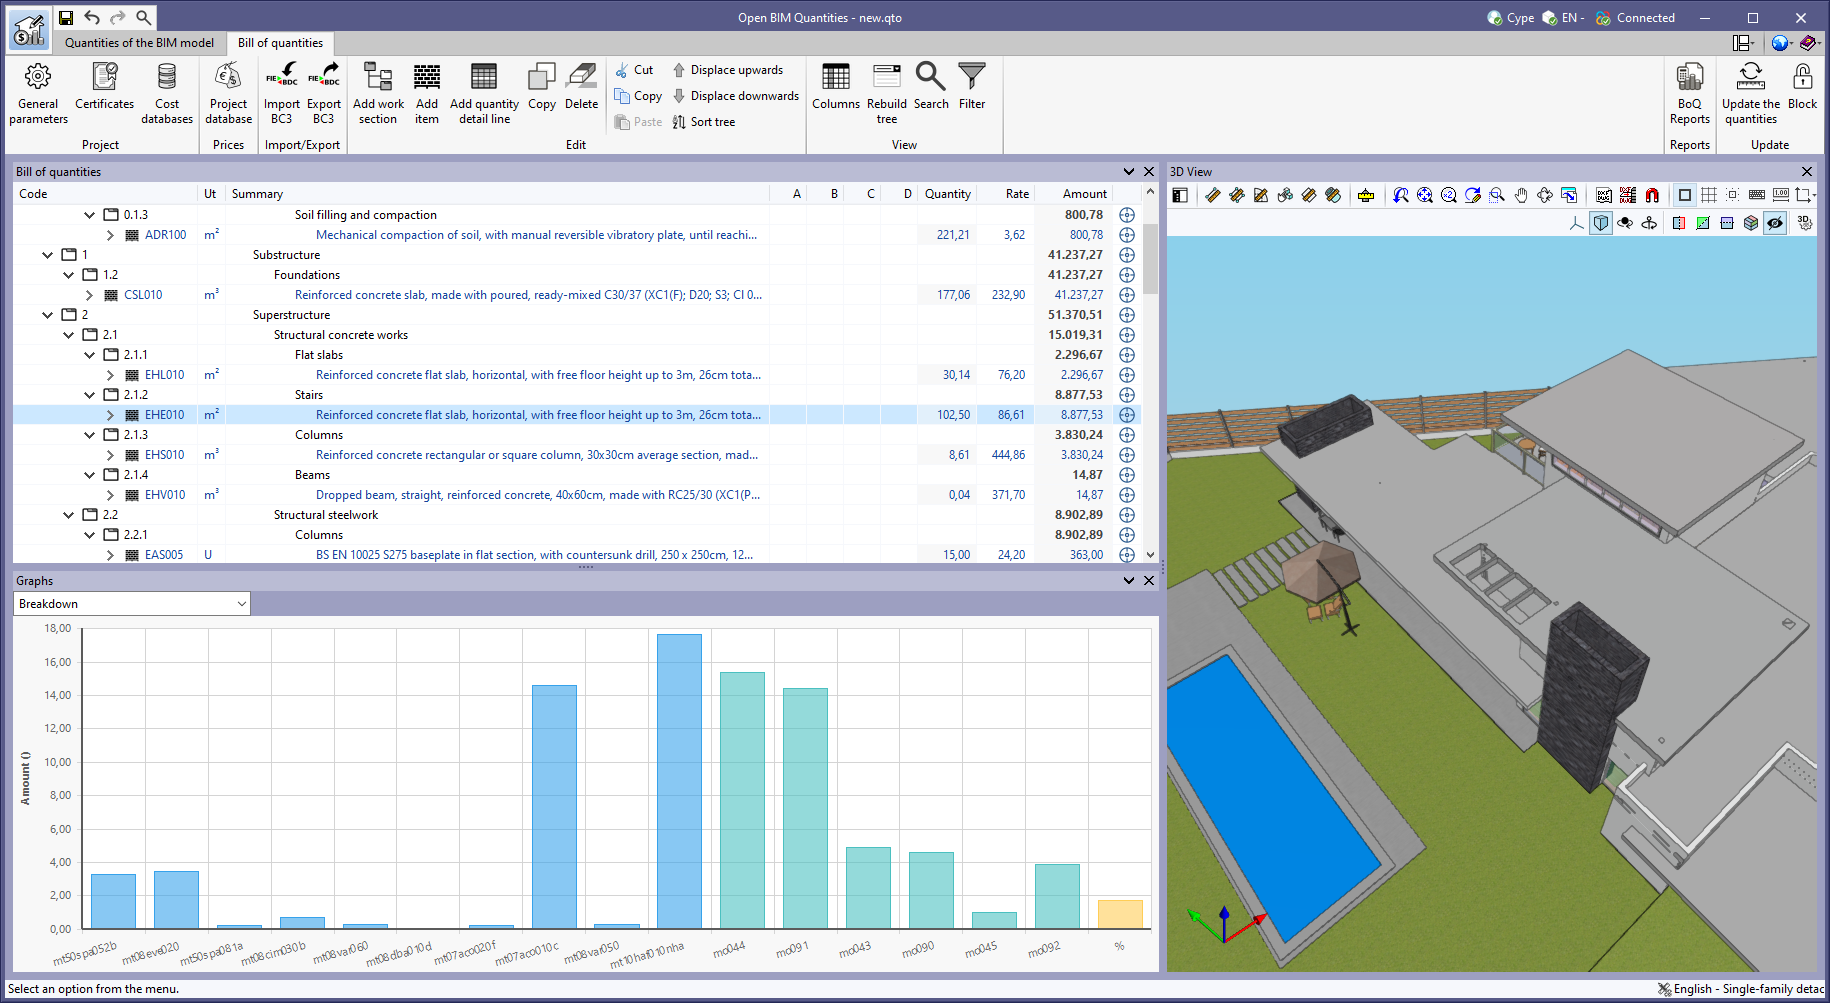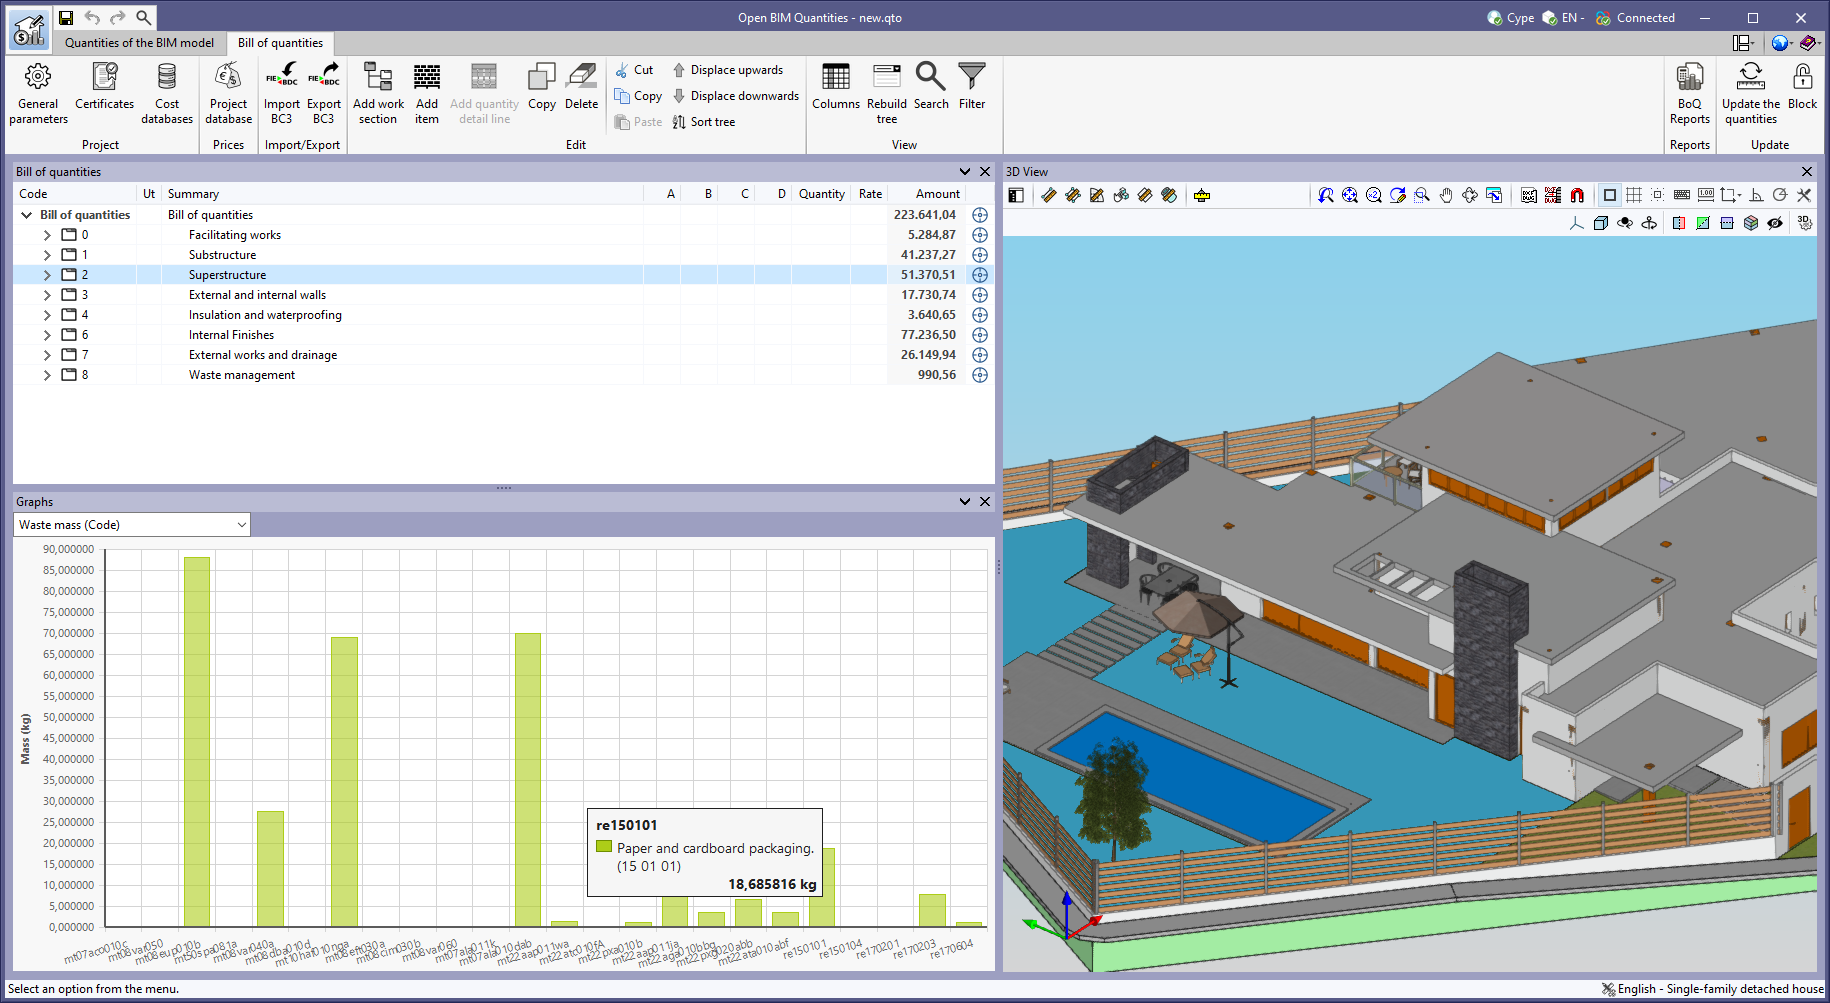


As of version 2023.g, the bill of quantities data can now be displayed graphically. For this purpose, the "Graphs" window has been added to the "Bill of quantities" tab. This window contains a drop-down list for selecting the graph to be displayed. In this version, the graphical representations (columns, circles, lines, etc.) of the following concepts are available:
- Bill of quantities
- Breakdown
- Breakdown (with/without BIM link)
- Energy cost
- CO2 emissions
- Waste mass (Type)
- Waste volume (Type)
- Waste mass (Code)
- Waste volume (Code)
- Certificates (Amount)
- Certificates (Quantity)
The graph generated depends on the component of the bill of quantities table that has been selected. It is important to note that the available graphs depend on the type of element (work section, item or quantity detail line). By hovering the cursor over a section of the graph, a box will appear with the parameter reference and its value, allowing users to have a better understanding of the data shown.
Graphs with a key allow data sets to be hidden by left-clicking on their reference. When a set is not visible, its reference is crossed out and can be reactivated by clicking on it.