Introduction
The CYPETHERM EPlus program offers a dedicated interface for managing building improvement measures or design alternatives, enabling users to generate a report on these measures that includes an energy and cost analysis for each one, and to calculate the payback period using static or dynamic analysis methods (Net Present Value).
In this specific interface, the program displays the building’s energy performance indicators for the various design options (such as the initial baseline situation and the situations resulting from the implementation of each improvement measure), and allows users to enter a description and the associated costs.
The energy performance indicators are imported from the simulations carried out in the program’s main analysis interface and previously shared with the BIMserver.center project to which the building is linked.
Workflows compatible with the program
CYPETHERM EPlus provides the following workflow in its interface for analysing "Improvement measures".
Data entry
- Importing the results of energy simulations carried out in CYPETHERM EPlus (via the "Energy simulation" option) and shared within the same project on the BIMserver.center platform.
This enables the generation of various design alternatives (such as the initial condition of the existing building and the conditions resulting from the application of different sets of improvement measures) and the import of performance indicators for each design alternative.
Data output
Once details such as the description and costs of the various imported design alternatives have been entered, the program offers the following data output options:
- Exporting the list of economic and energy assessments for the improvement measures to HTML, DOCX, PDF, RTF and TXT formats.
- Exportinging data generated using CYPETHERM EPlus to the BIMserver.center platform.
Work environment
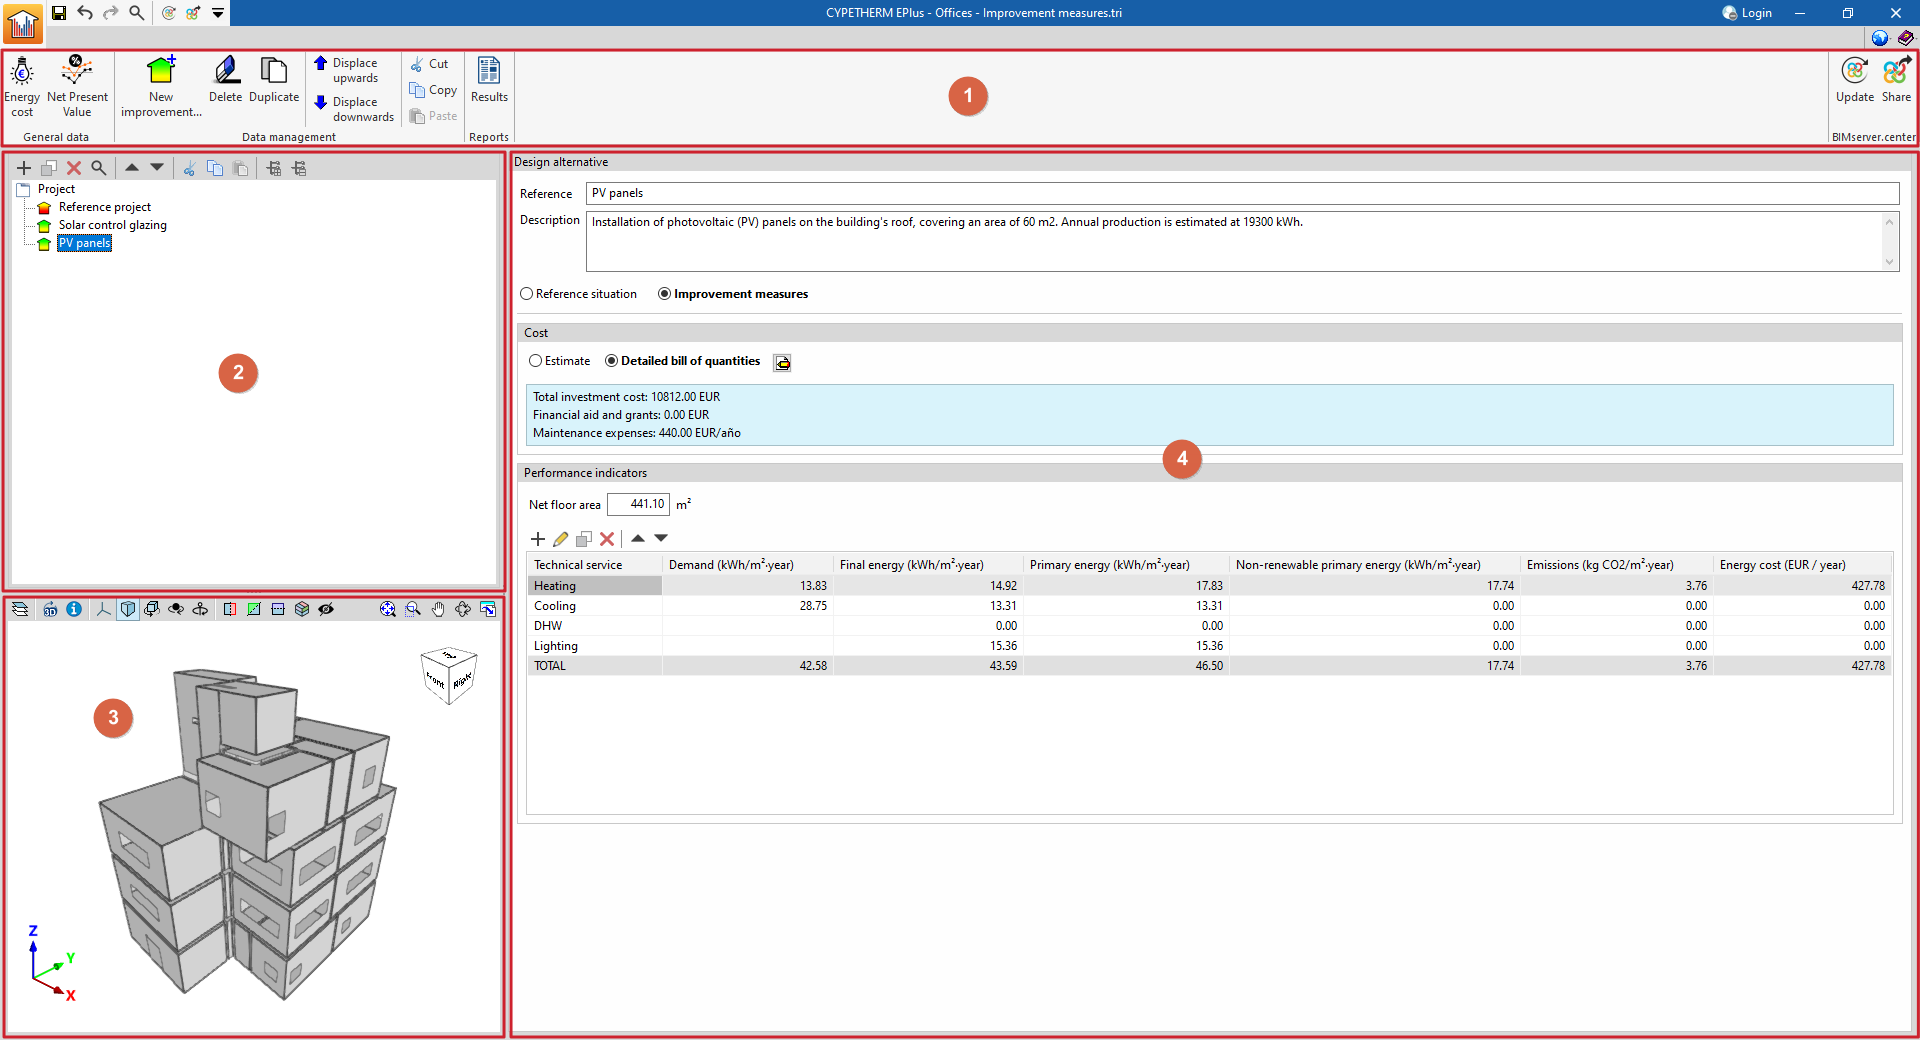
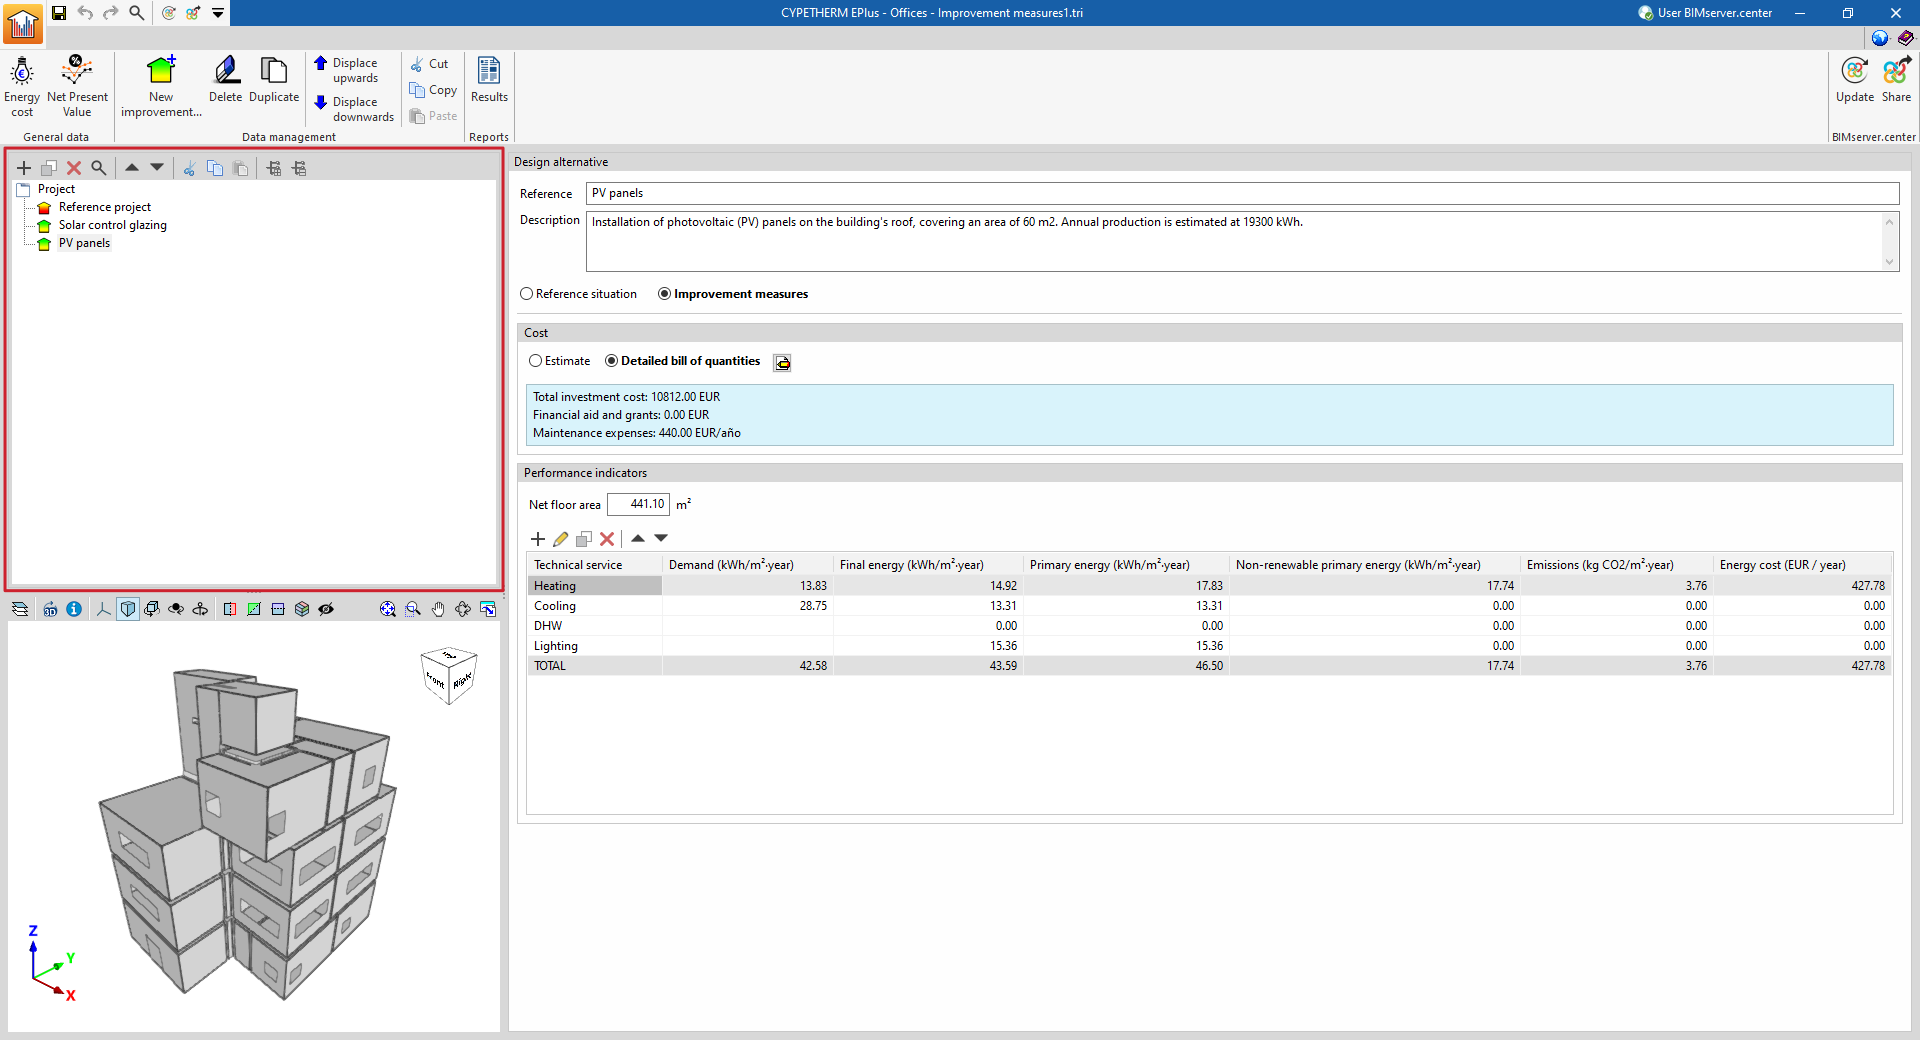
The work environment for managing improvement measures or design alternatives in CYPETHERM EPlus features a user-friendly interface comprising the following sections:
- The top toolbar (1) contains tools for defining general project data, managing data relating to the improvement measures tree, building scenarios or design alternatives, generating reports, and connecting to BIMserver.center.
- The tree-like structure (2) on the left-hand side of the screen allows you to define the various improvement measures, situations or design alternatives to be considered in the calculations, such as the following:
- The baseline condition of the building under assessment, which describes its energy performance in its initial state.
- The building improvement measures, including the energy performance achieved as a result of implementing them, together with a description of the measures and the associated costs.
- The 3D viewer (3), located at the bottom left of the interface, displays the models hosted on the BIMserver.center project to which the project has been linked.
- The data editing panel (4) on the right-hand side of the screen displays and allows you to enter the data associated with the design situation or alternatives selected in the tree.
Data input and output sequence for the analysis of improvement measures or design alternatives
Data can be imported and managed within the program to carry out the economic and energy analysis of improvement measures or design alternatives, using the following sequence of data input and output.
- Create a new project (from "File", "New") and select the "Improvement measures" option.
- (Optional) Link to BIMserver.center and import the data for the previously shared design alternatives into the BIMserver.center project.
- Review and adjustment of the various design scenarios or alternatives:
- If the project has been linked to BIMserver.center, several design alternatives will have been generated automatically.
- In any case, if the project has not been linked to BIMserver.center, you can manually create new improvement measures or design alternatives using the "New improvement measure" option in the "Data management" section.
- Review and adjustment of data for different design scenarios or alternatives, including the "Description" and "Costs" (by selecting each situation from the tree on the left-hand side of the interface and entering the required data on the right):
- If the project has been linked to BIMserver.center, the "Performance indicators" data will have been generated automatically.
- In any case, if the project has not been linked to BIMserver.center, the data for the "Performance indicators" can be entered and edited manually.
- Configure the general data (under "Project", "General data") if you wish to carry out an economic analysis of the design alternatives.
- Retrieve the report on improvement measures, including its economic and energy analysis (from the "Reports" section).
- Export to BIMserver.center (from "BIMserver.center", "Share").
Creating a new job, linking to a project and importing data
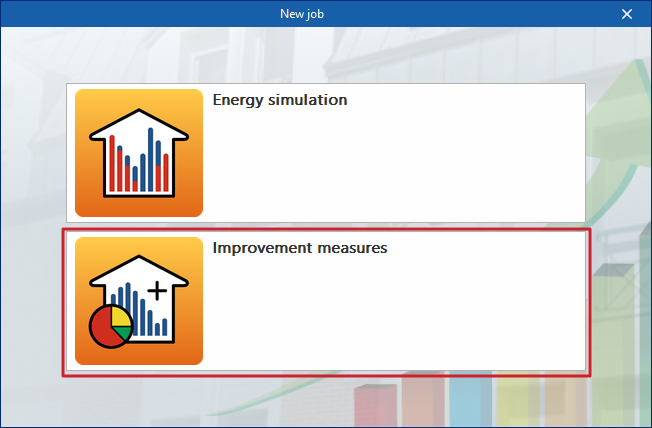
When you launch the application and click on "New", you are given the option to create a "New job". First, enter the "File name" and its "Description".
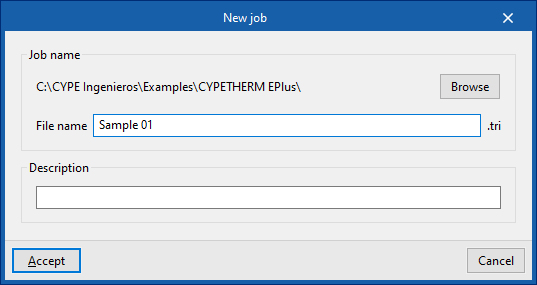
Next, you must specify whether the purpose of the work is to carry out an "Energy simulation", or to conduct a study of "Improvement measures" or design alternatives for the building project.
You should select this second option to access the interface specifically designed for analysing improvement measures.
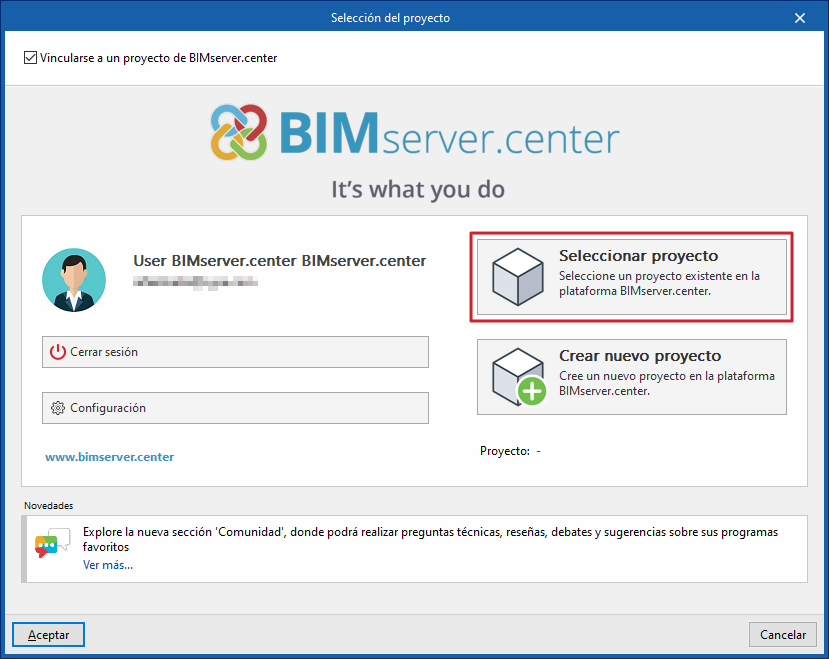
The project can then be linked to an existing project on BIMserver.center.
This is done in the "Project selection" window, ensuring that the "Link to a BIMserver.center project" checkbox remains ticked. This window offers the following options:
- On the left-hand side, you can log in using a BIMserver.center account.
- On the right, use the "Select project" option to choose an existing project.
Later on, at any stage of the project, you can share or import project files via the "BIMserver.center" section of the main interface.
Importing BIM models
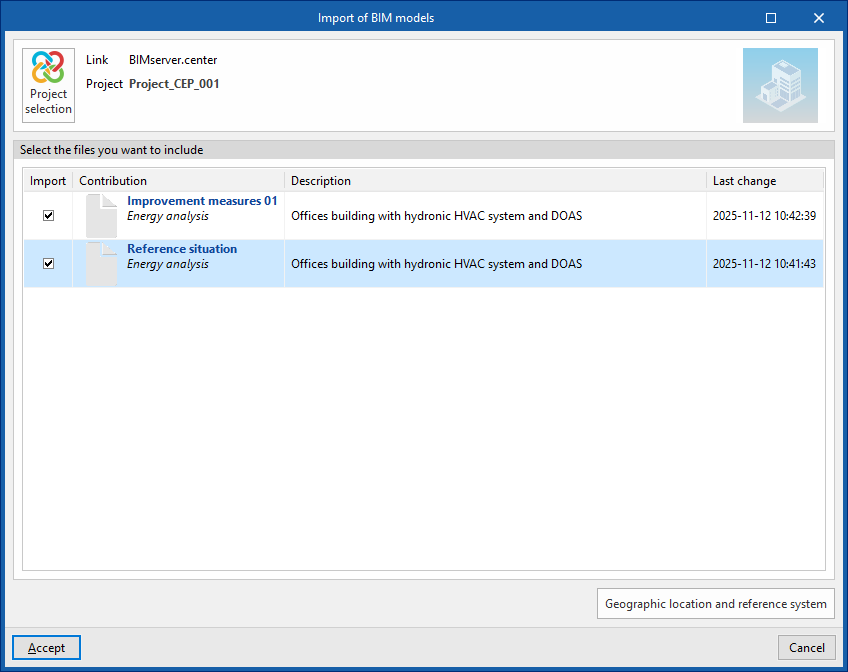
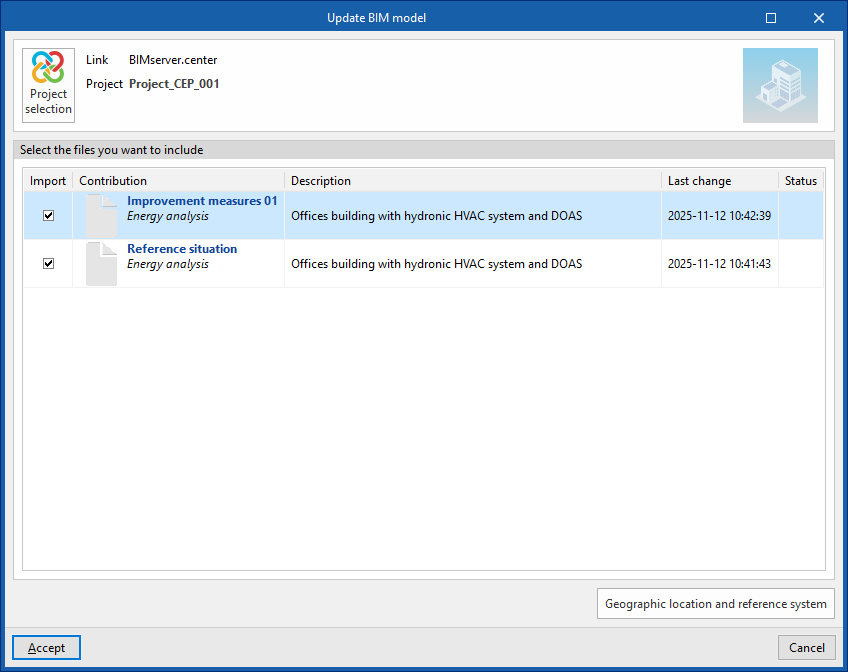
After selecting a project hosted on the BIMserver.center platform via "Select project" and confirming your choice, the "Import BIM models" window appears, displaying the files contained in that project in IFC format.
The application allows you to include one or more of the existing models in that project. To do this, tick the "Import" box and confirm.
These models must have been previously exported from a CYPETHERM EPlus simulation file (using the "Energy simulation" option during the new build creation process) and represent different scenarios or design alternatives.
Import results
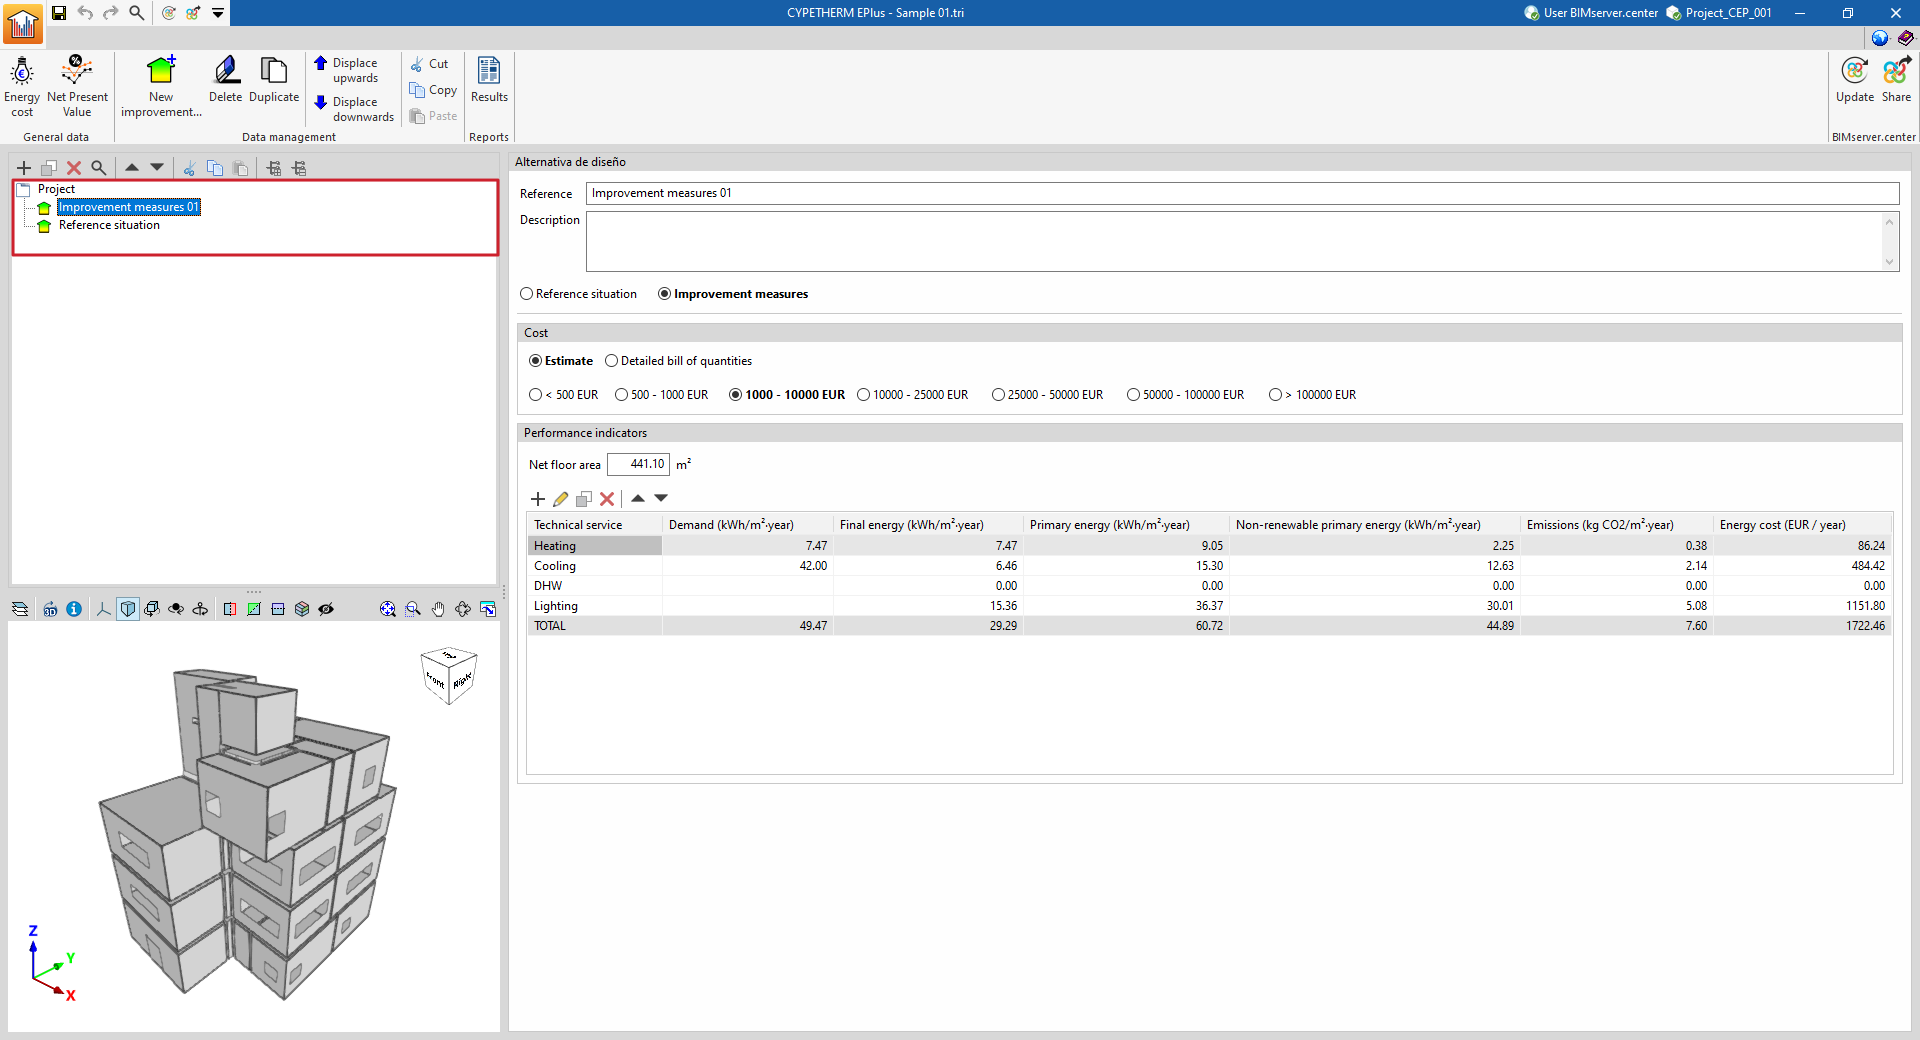
The "Project" tree, on the left-hand side of the main interface, will then display the alternatives imported during the project creation process. In any case, new improvement measures or design alternatives can also be created manually.
When you select each one, the imported "Performance Indicators" will be displayed. You can add further indicators, edit or delete the imported ones. To continue, you will need to add information to each imported option, such as its description and associated costs.
Defining the general project details
The "General data" section of the main toolbar contains the tools for defining the following aspects relating to the cost analysis of improvement measures or alternative building designs.

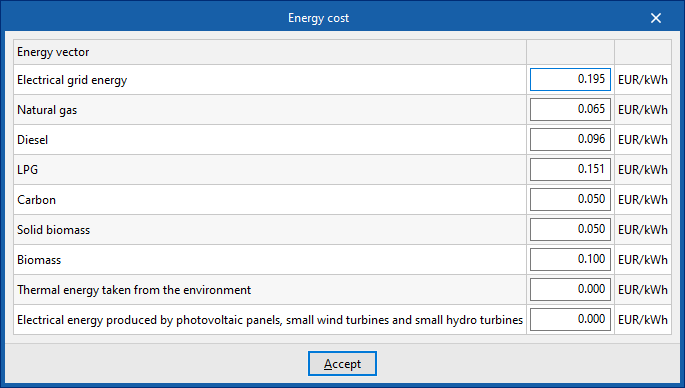
Energy costs
Defines the cost of energy by energy source, in units of the selected currency per unit of energy. This information is used in the economic analysis carried out by the program.
The energy vectors for which this configuration can be applied are as follows:
- Electrical grid energy
- Natural gas
- Diesel
- LPG
- Carbon
- Solid biomass
- Biomass
- Thermal energy taken from the environment (including solar thermal energy)
- Electricity generated by photovoltaic panels, small wind turbines and small hydro turbines
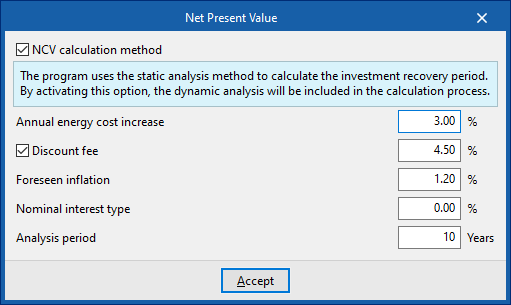
Net Present Value
Enables the Net Present Value (NPV) calculation method to carry out a more detailed analysis of the payback period associated with the various improvement measures entered, and to configure its parameters.
- NPV calculation method (optional)
The method used by the program to calculate the payback period is static analysis. If this option is enabled, dynamic analysis is included in the calculation.
The parameters to be defined when this calculation is enabled are as follows:
- Annual energy cost increase (%)
- Discount fee (optional) (%)
- Forseen inflation (%)
- Nominal interest type (%)
- Analysis period (years)
Managing design alternative data
Data relating to the various design situations or alternatives (such as the building’s initial condition and situations involving each set of proposed improvement measures) is managed via the "Project" tree displayed on the left-hand side of the interface, which expands to show the levels corresponding to each situation.
In addition, you can use the options in the "Data management" section of the main toolbar to delete or reorder situations.
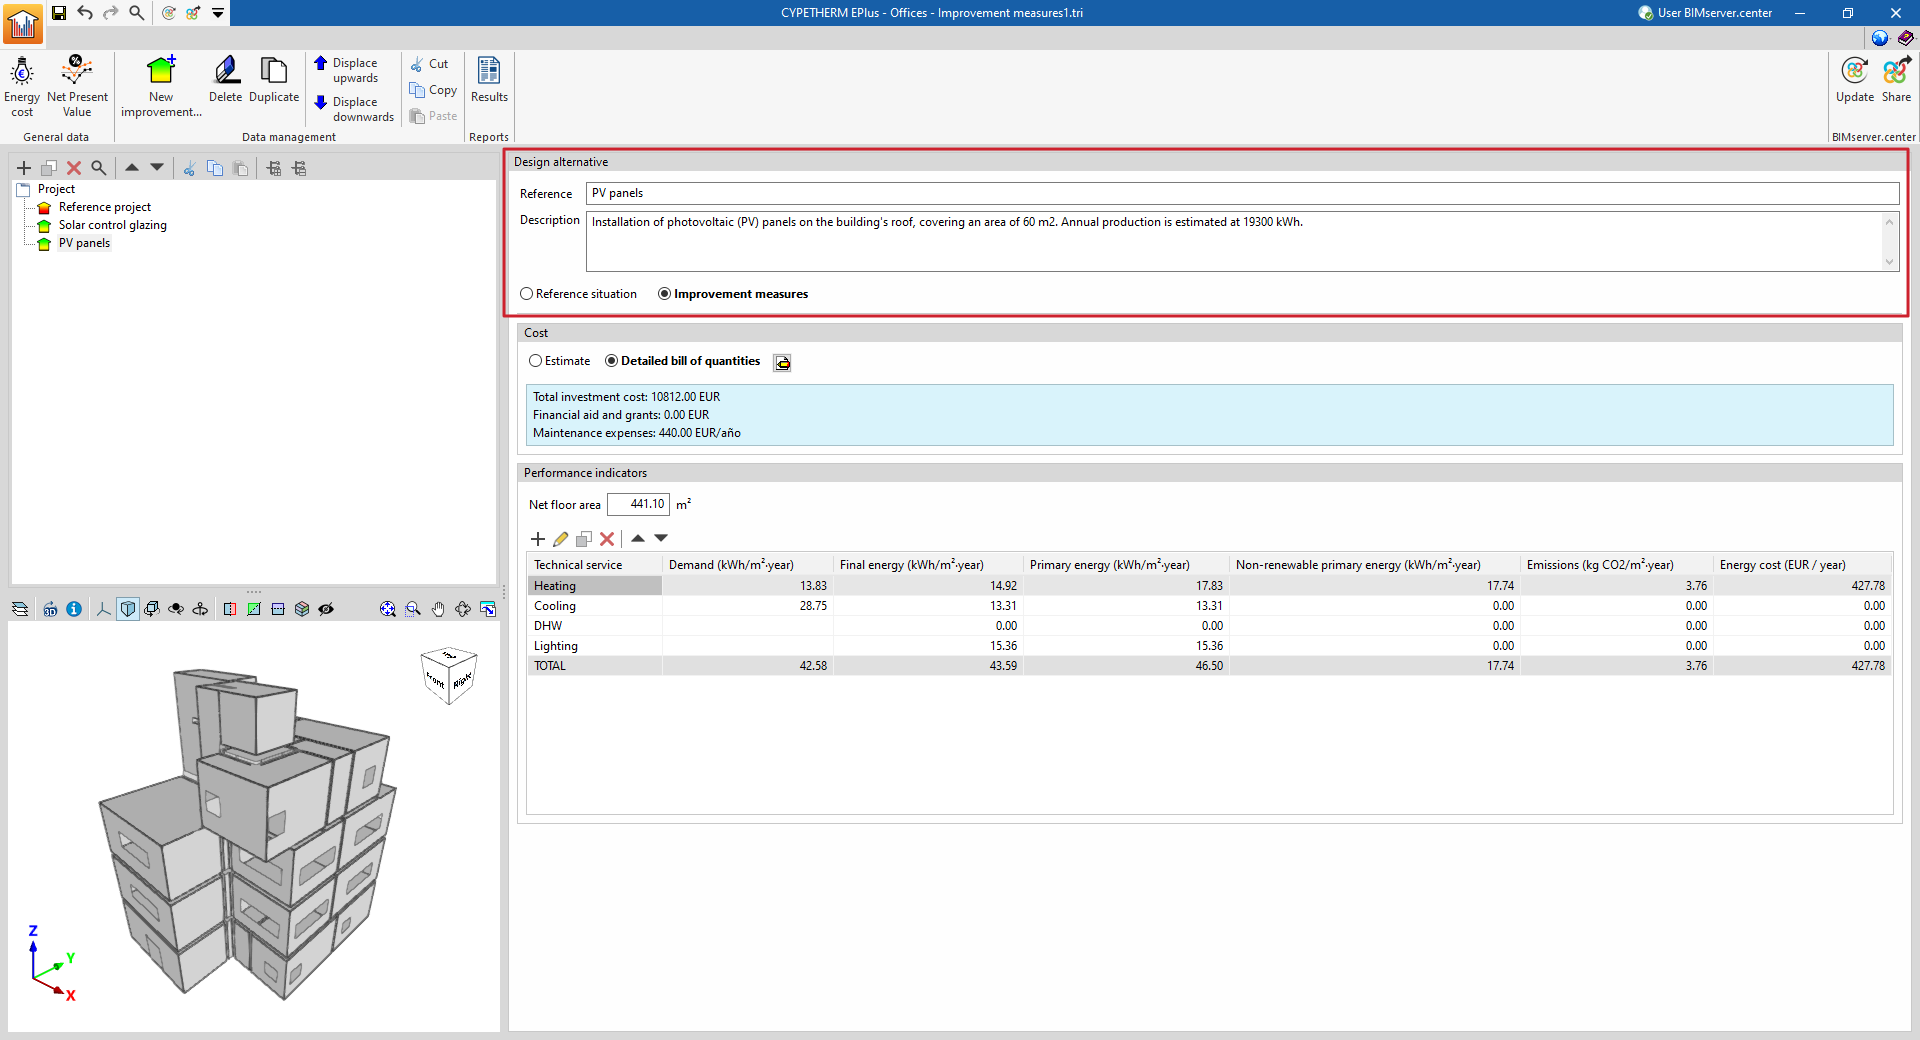
Defining design situations or alternatives
Each level in the "Project" tree represents a design situation or alternative. For each one, the following details must be defined:
- Reference
Reference to the selected situation or design option. - Description
This field must contain a full description of the chosen design option, detailing its main technical and construction features. - Additional information
This allows you to enter any other relevant information about the selected design option.
The "Reference situation" option allows you to specify that the selected design alternative is the reference situation against which the economic or energy analysis comparisons will be made.
The "Improvement measures" option allows you to indicate that the element selected in the tree represents a design alternative to the reference situation, such as the condition of the building following the implementation of a specific set of improvement measures (such as replacing parts of the building envelope or building services with refurbished ones).
Ticking the "Reference situation with cost" box indicates that this situation represents a design alternative for the building project with a specific cost. In this way, the payback period will be calculated based on the difference between the costs of the other design alternatives and that of this reference situation. In the case of the current situation of the existing building, this box will remain unchecked, as no cost is associated with it.
| Objective | Definition in the program |
| A comparison between the initial condition of the existing building and various improved situations resulting from the implementation of different sets of improvement measures | - A "Reference situation" is defined with the "Reference situation with cost" checkbox deselected - "Improvement measure" alternatives are defined for each set of improvement measures to be considered, and the cost of each is specified. |
| Comparison of different design options for the project | - A "Reference situation" is defined with the "Reference situation with cost" box ticked, specifying its cost - "Improvement measure" alternatives are defined for each project design alternative to be considered, and the cost of each is specified. |
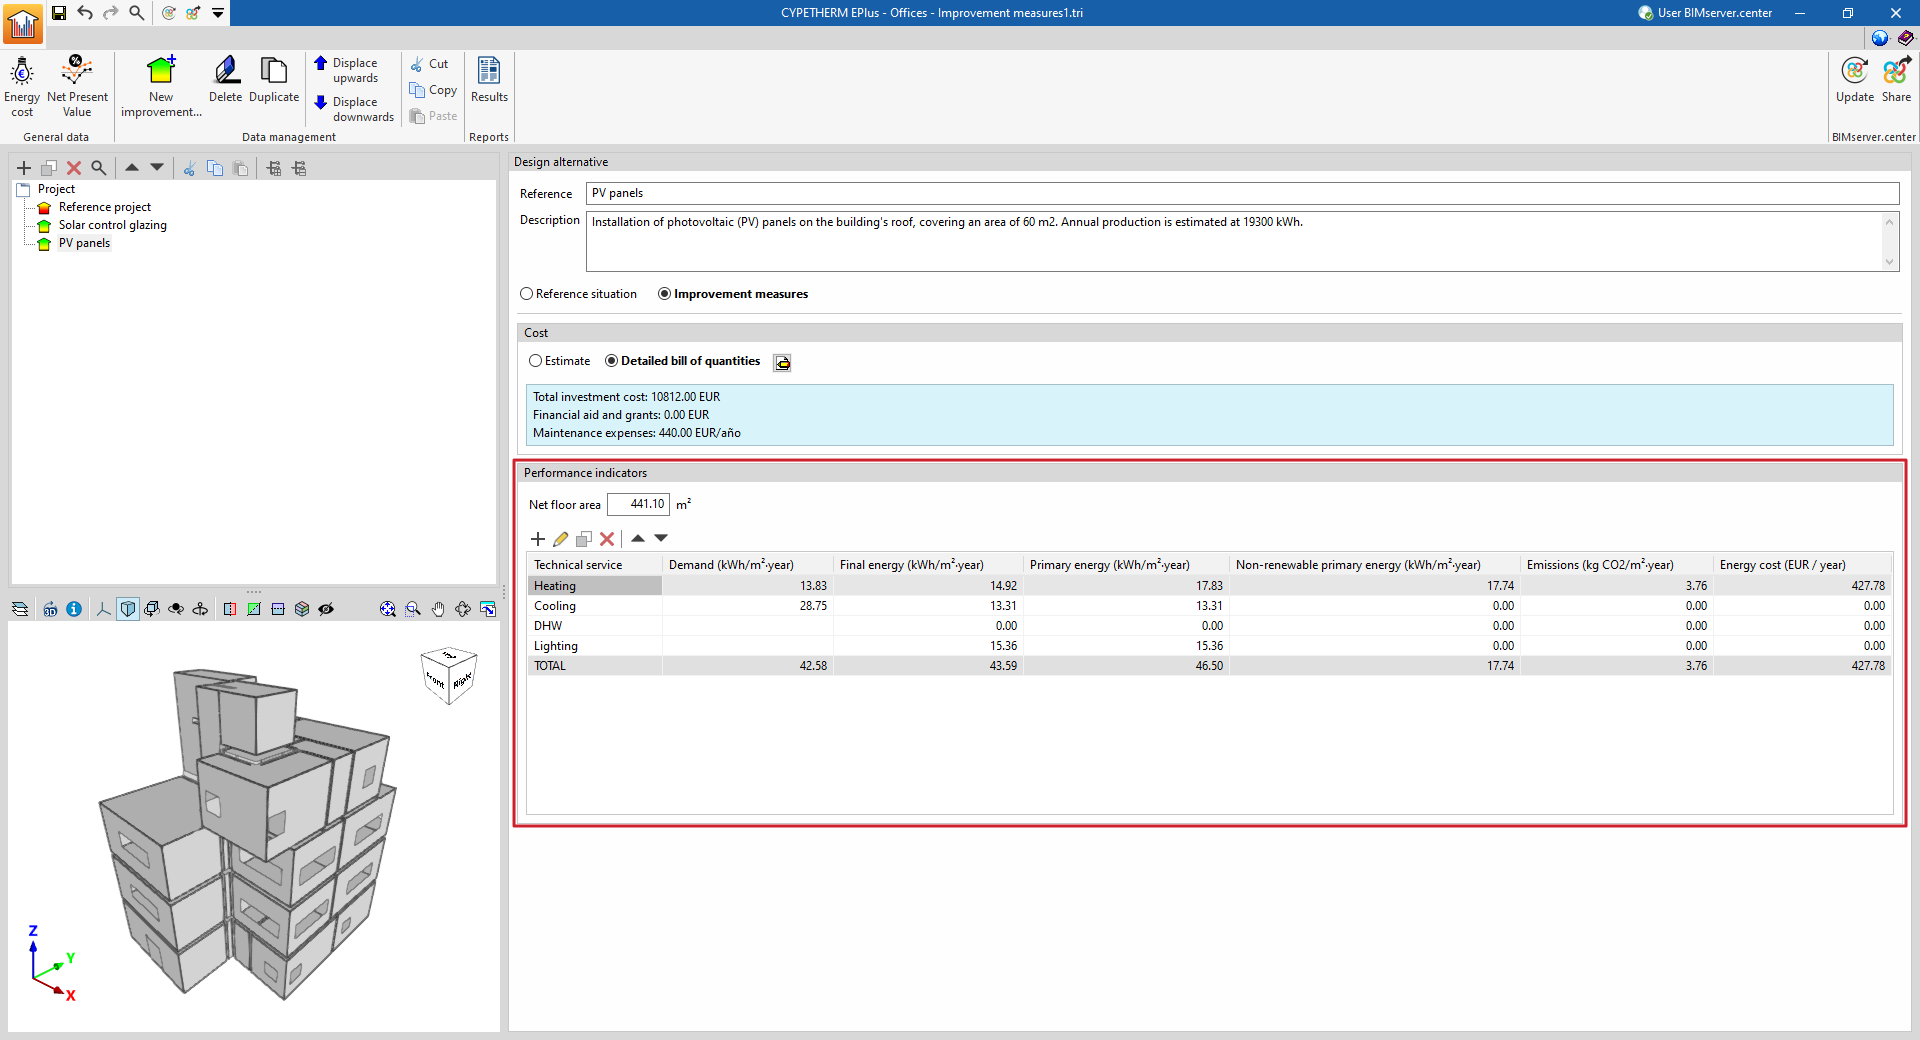
Performance indicators
Performance indicators can be added and completed manually or imported from data provided by simulations previously carried out using the software and shared with the BIM model. They are as follows, for each of the technical services and for the building as a whole:
- Demand (kWh/m²·year)
- Final energy consumption (kWh/m²·year)
- Primary energy (kWh/m²·year)
- Non-renewable primary energy (kWh/m²·year)
- Emissions (kg CO₂/m²·year)
- Energy costs (selected currency / year)
This section also displays and allows you to modify the 'usable floor area' of the building included in the analysis.
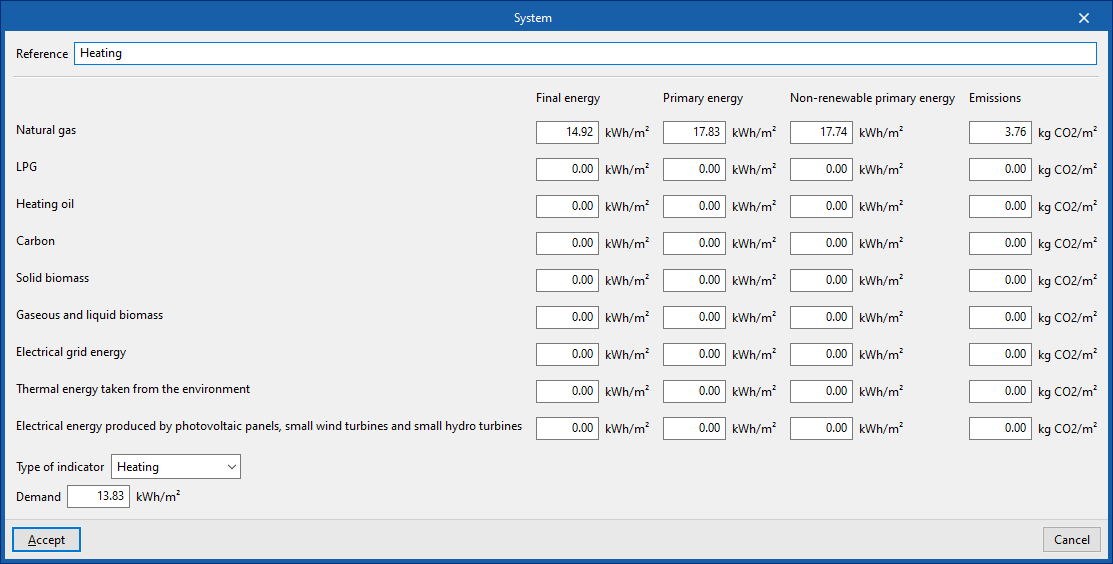
When adding or editing a performance indicator, you must define:
- The "Reference";
- Energy and emissions figures (“Final energy”, “Primary energy”, “Non-renewable primary energy” and “Emissions”) broken down by energy source (“Natural gas”, “LPG”, “Heating oil”, “Carbon”, “Solid biomass”, “Gaseous and liquid biomass”, "Electrical grid energy", "Thermal energy taken from the environment" and/or "Electricity energy produced by photovoltaic panels, small wind turbines and small hydro turbines");
- and the "Indicator type" (whether "Heating", "Cooling", "DHW", "Ventilation", "Lighting", "Transport", "Humidity control" or "Other").
Costs
The "Costs" section allows you to describe the costs associated with each design alternative selected in the "Project" tree. Costs can be defined if the design alternative is defined as an "Improvement measure" or as a "Reference situation" with the "Reference situation with costs" option enabled.
Costs can be defined as an "Estimated" cost or via a "Detailed bill of quantities":
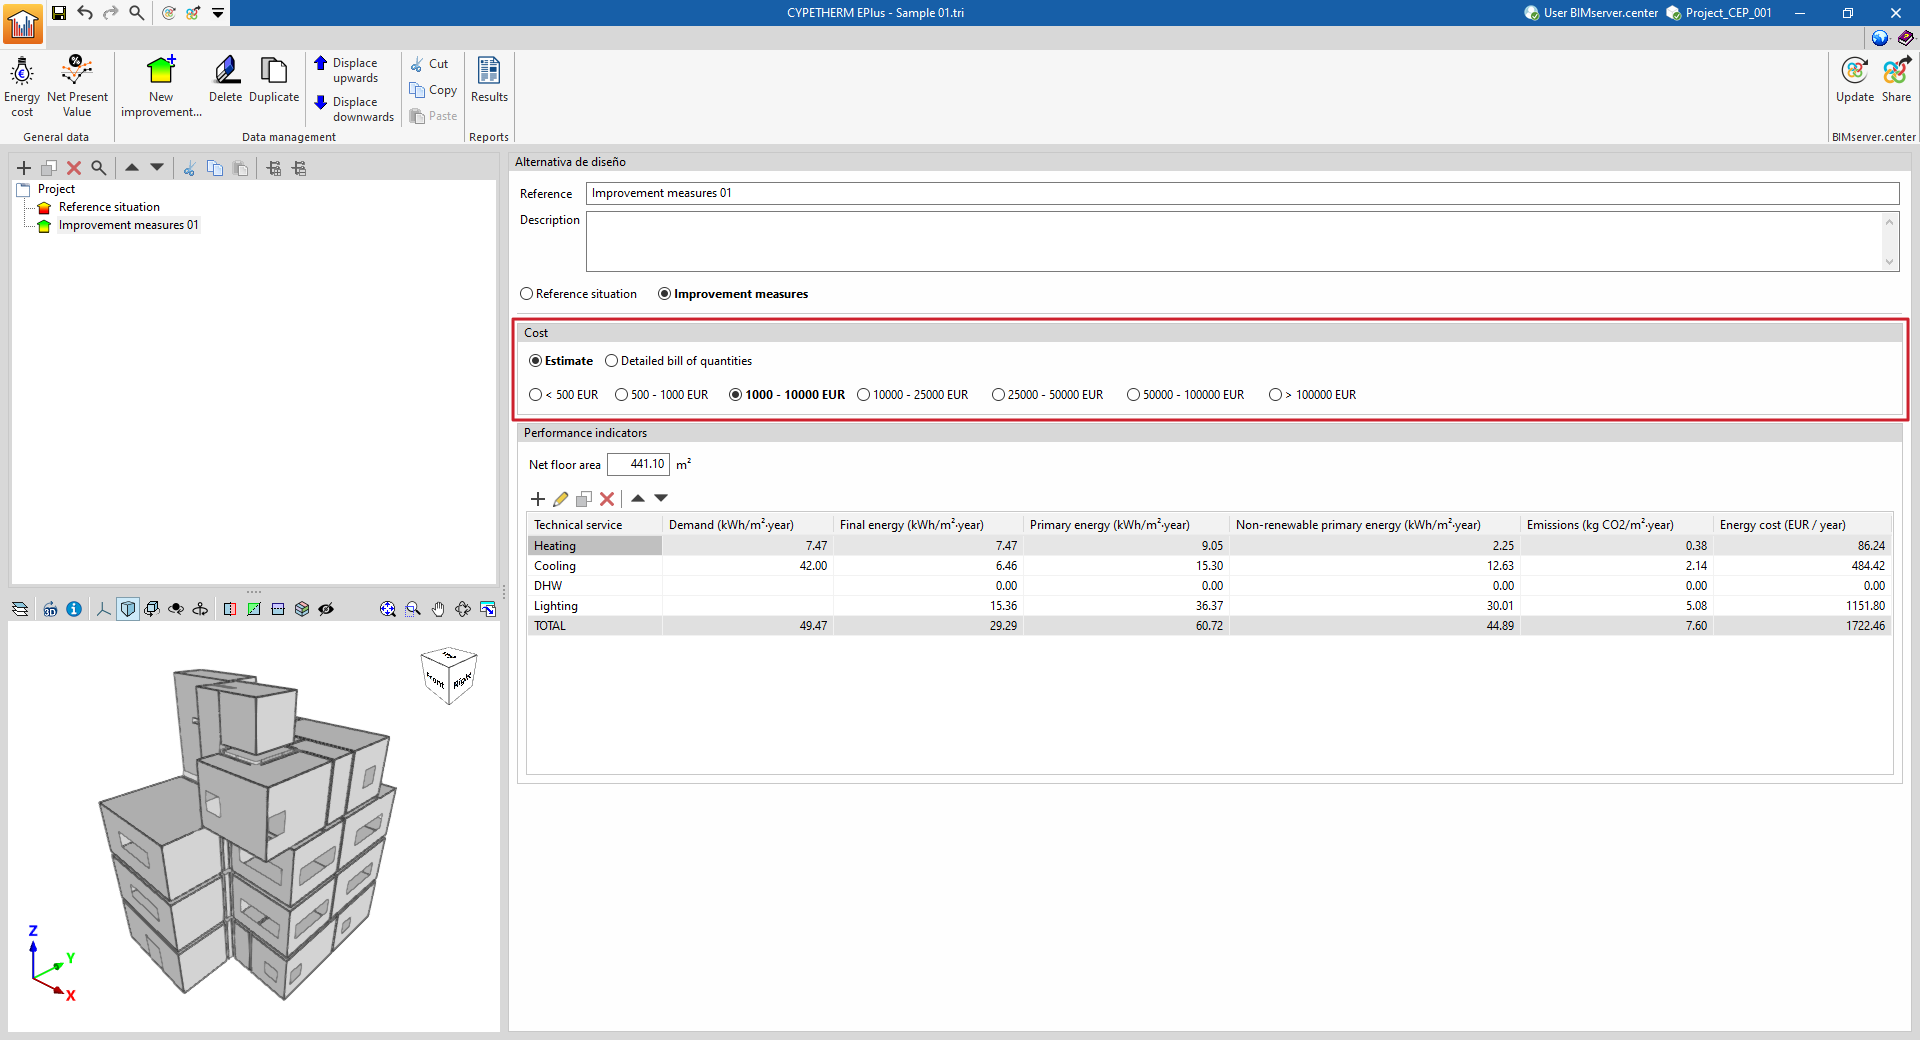
Estimate
Defines the cost of the improvement measure or design alternative in a simplified manner, by selecting one of the following ranges (in the selected currency units):
- < 500
- 500–1,000
- 1,000–10,000
- 10,000–25,000
- 25,000–50,000
- 50,000–100,000
- > 100,000
The program will calculate the average of the selected range when performing the economic analysis.
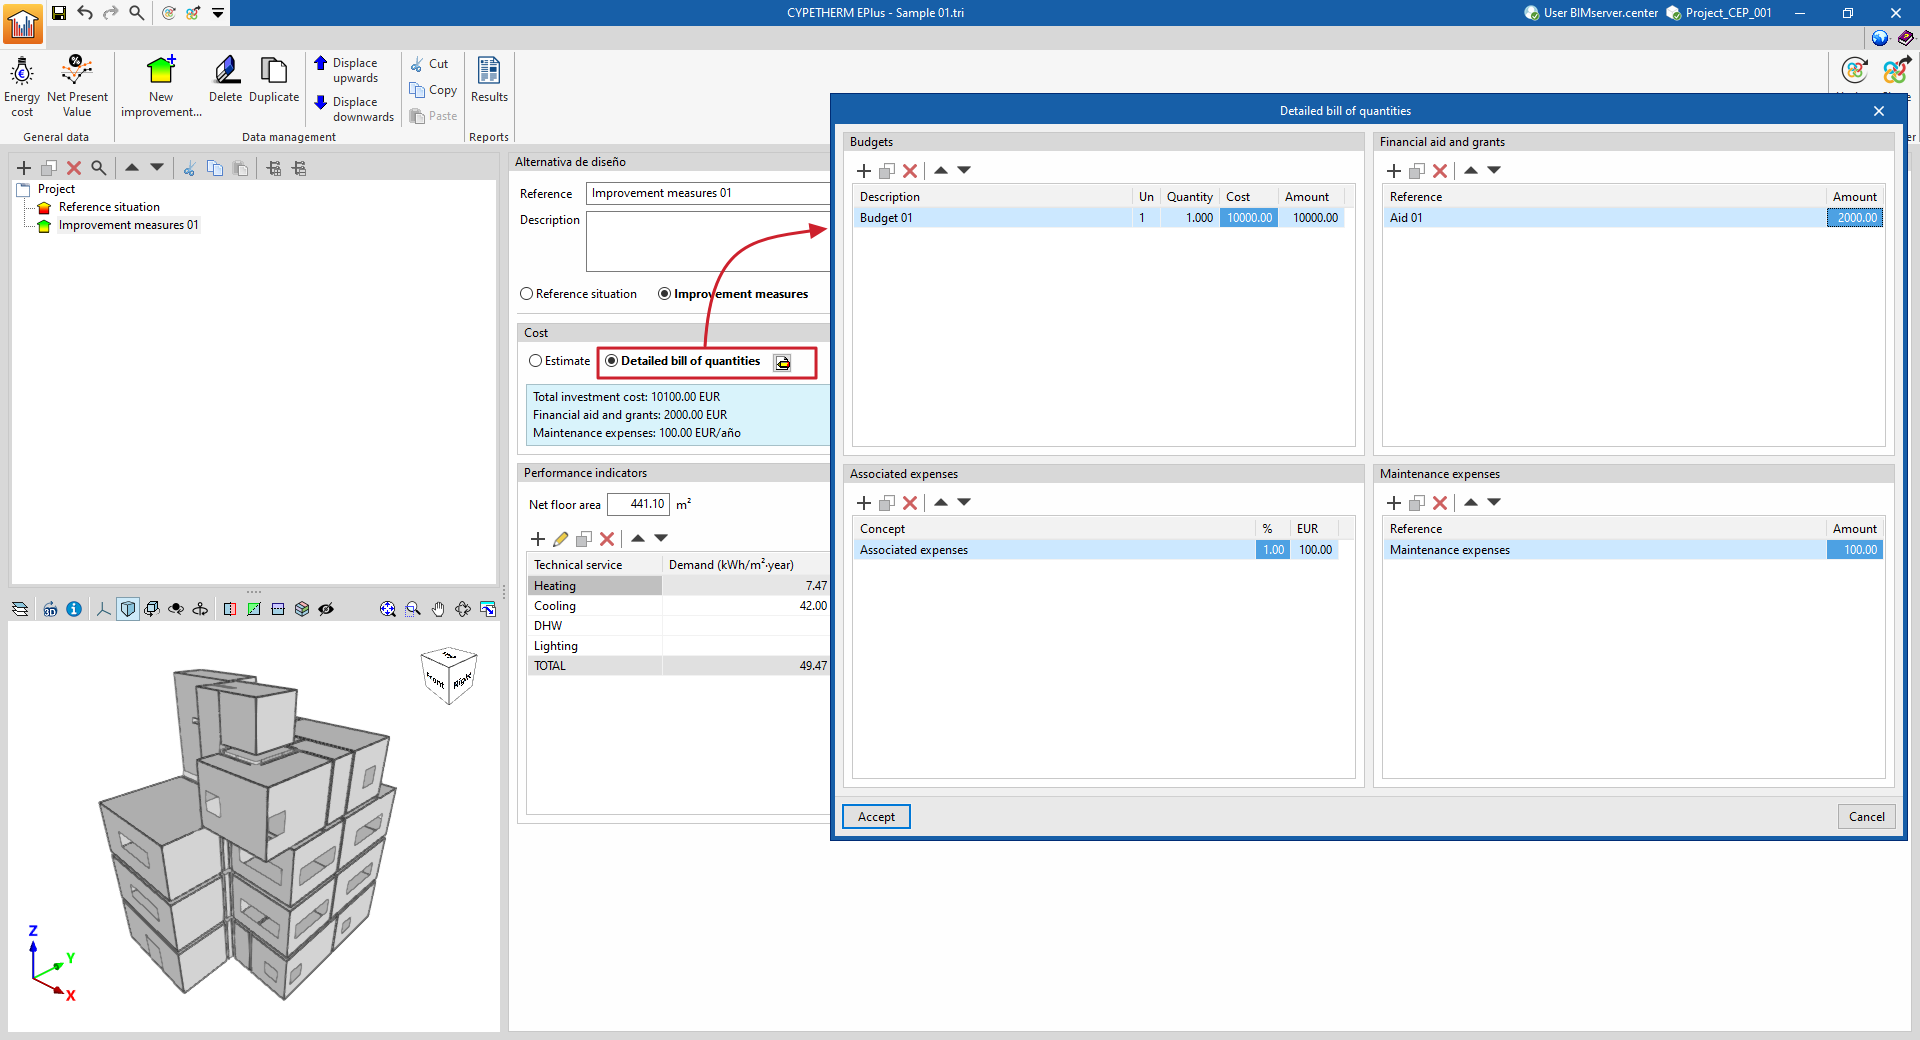
Detailed bill of quantities
The "Detailed bill of quantities" option allows you to break down the cost of the improvement measure or design alternative in detail. To do this, clicking the edit button opens a pop-up window where you can define the bill of quantities, associated costs and maintenance costs, as well as any grants and subsidies associated with the selected improvement measure or design alternative. This data enables you to complete the economic analysis and adjust the payback period:
- Bbill of quantities
- Description
- Units
- Quantity
- Cost
- Amount
- Financial aid and grants
- Reference
- Amount
- Related costs
- Concept
- %
- Currency units (default: euros)
- Maintenance costs
- Reference
- Amount
Options in the "Data management" group
The "Data management" section of the top toolbar contains the following options:

- New improvement measure
Adds a new improvement measure or design alternative to the "Project" tree. - Delete
Deletes the selected design option. - Move up / Move down
Reorders the layout options in the tree. - Cut / Copy / Paste
These options allow you to cut, copy or paste design elements in the tree.
Reports
In the "Reports" section of the main toolbar, you will find the option to view the following report.

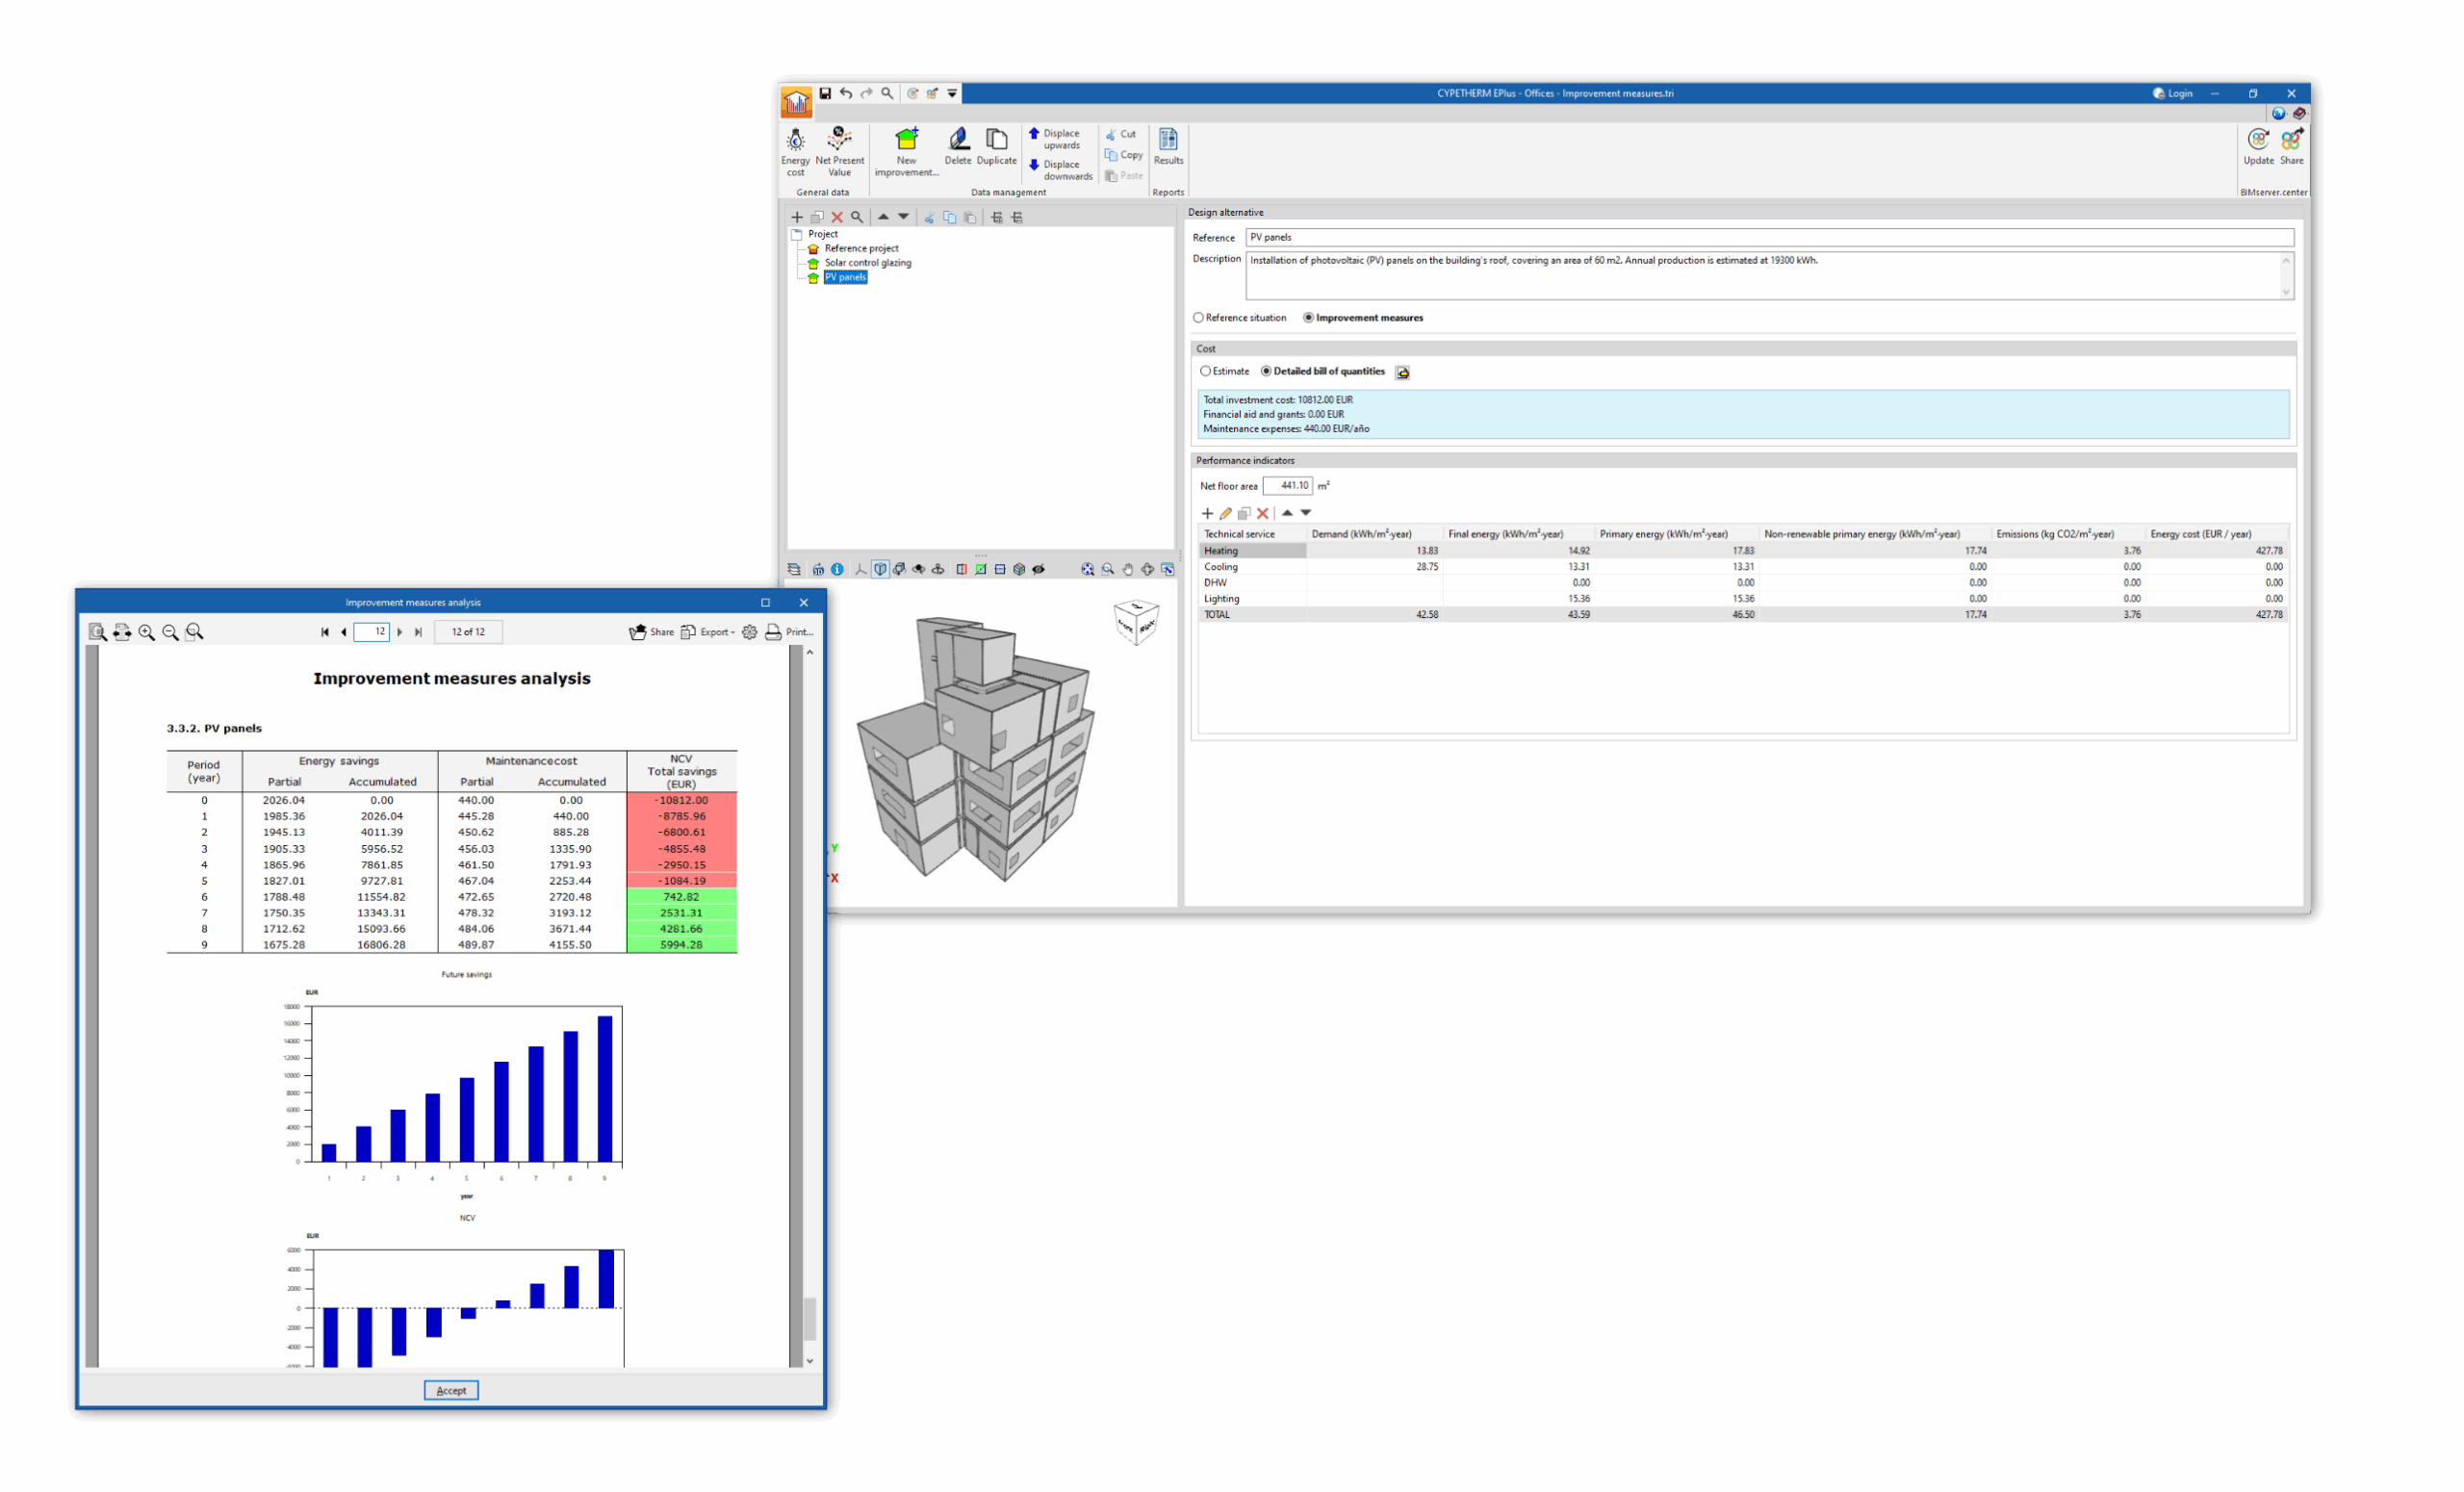
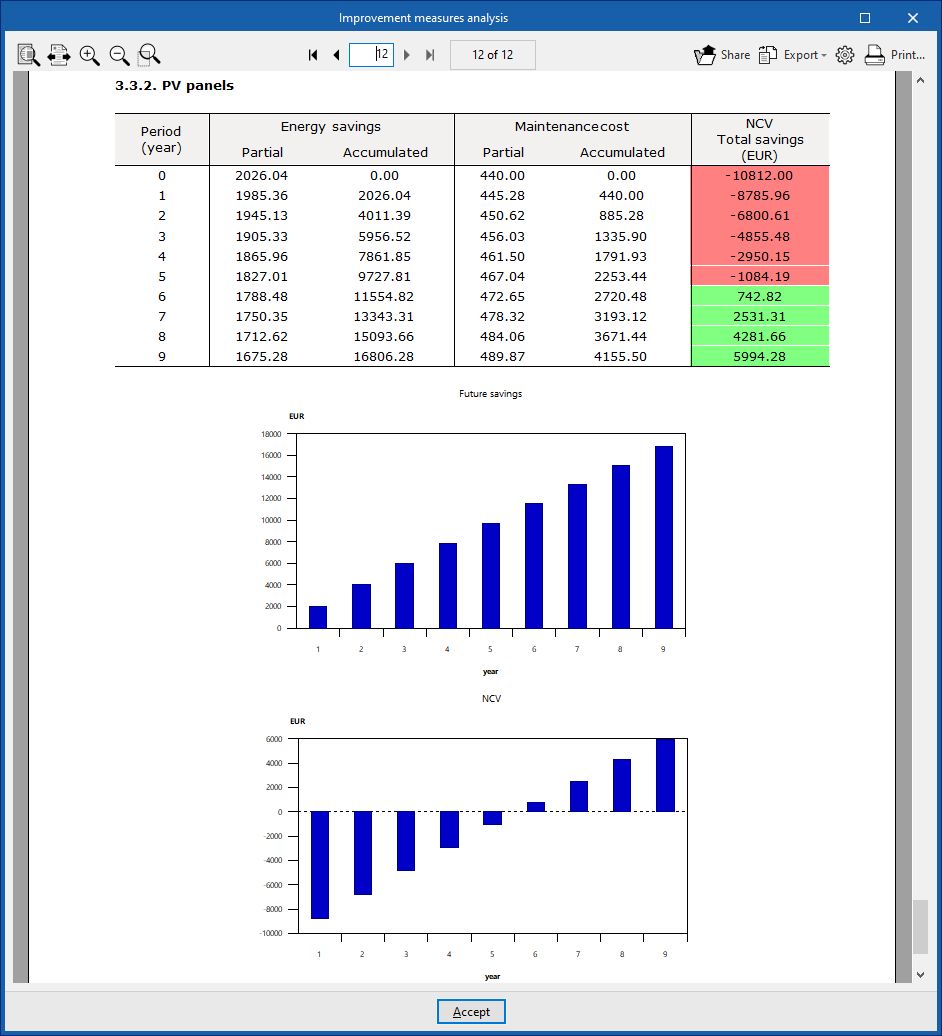
Improvement measures analysis
By clicking on the "Results" option, you can obtain an "Improvement measures analysis" containing an energy and cost analysis of each measure compared to the reference situation, calculating the payback period using static or dynamic analysis methods (provided the relevant parameters have been defined under the "Net Present Value" option).
A summary of the results and an energy and economic analysis (cost-benefit analysis) of each measure are provided. The latter includes:
- Ccosts and subsidies;
- A static analysis of return on investment;
- And, if the relevant option has been selected under "Net Present Value" in the "General data" section, a dynamic return on investment analysis.
The program allows you to print this report directly or generate files in HTML, PDF, TXT, RTF or DOCX format using the relevant options in the top right-hand corner of the viewer.
Integration into the BIMserver.center platform
Many of CYPE's programs are connected to the BIMserver.center platform and allow collaborative work to be carried out via the exchange of files in formats based on open standards.
Please note that, to work on BIMserver.center, users can register on the platform free of charge and create a profile.
When accessing a program connected to the platform, the program connects to a project in BIMserver.center. This way, the files of the projects that have been developed collaboratively in BIMserver.center are kept up to date.

| More information: |
|---|
| For further details related to using CYPE software via the BIMserver.center platform, please click on this link. |
Options for connecting to BIMserver.center
The “BIMserver.center” section of the main toolbar contains the features needed to use the program alongside other BIMserver.center tools.

Update
Update the information contained in the models previously imported into the project, or import new models if required.
Share
Export the installation data generated by the program to BIMserver.center so that you can share it with other users.
During the export process, you can specify the details relating to the contribution to be generated:
- Name
- Description
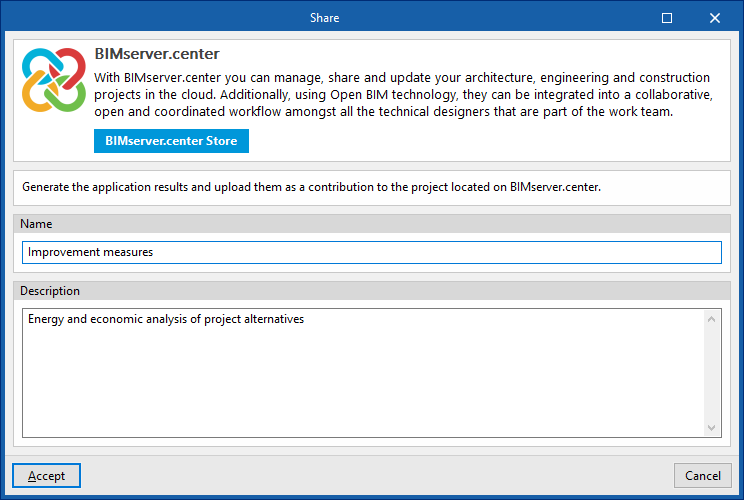
Table of contents
Complete your tour of CYPETHERM EPlus by exploring the other sections available: