
Examples of buckling analysis in structures
Below are several examples of structures where the buckling analysis performed by the program can be applied, along with the sequence of steps for defining, analysing and viewing the results:
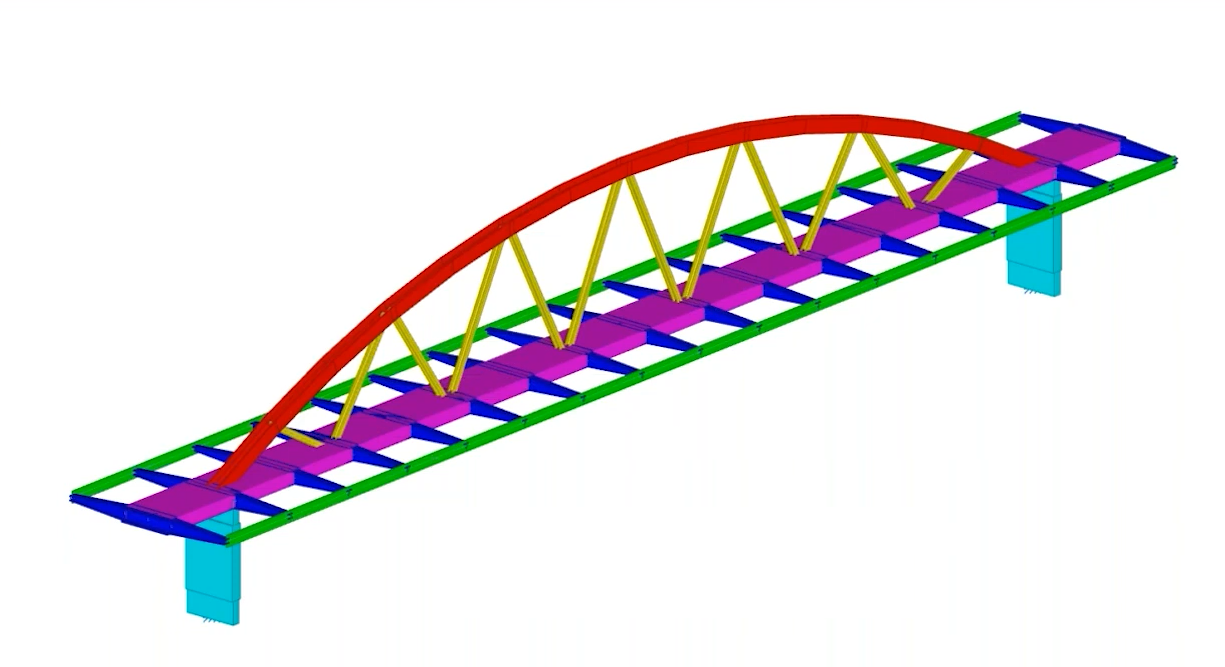
Arched steel walkway with a compressed top chord
The objective is to obtain and assign the buckling coefficients for the bars forming the compressed upper chord of the arch in a steel footbridge. This involves the following:
- The buckling analysis takes into account both the top chord bars and the lattice bars that brace them.
- The buckling analysis is carried out.
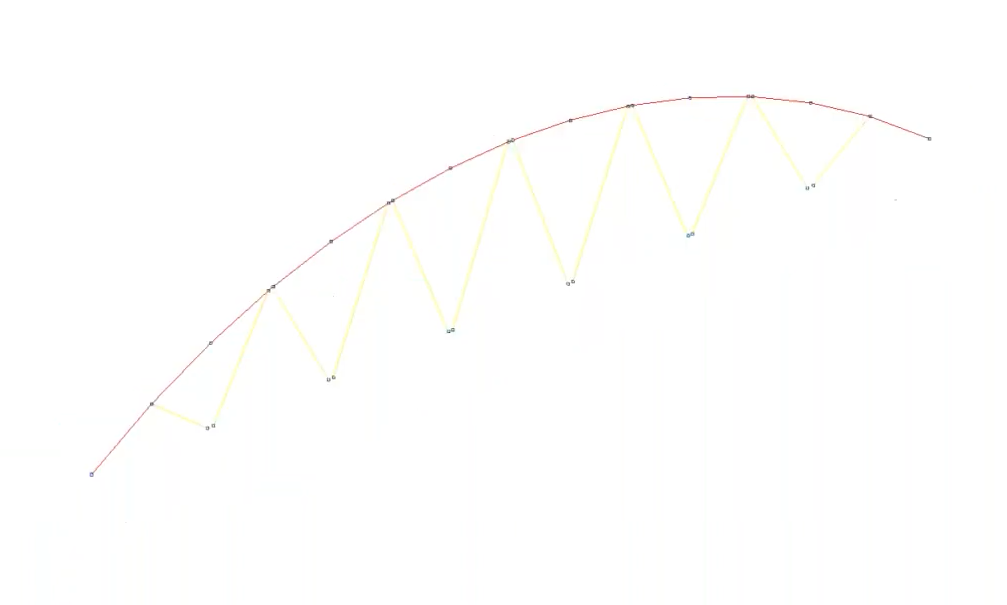
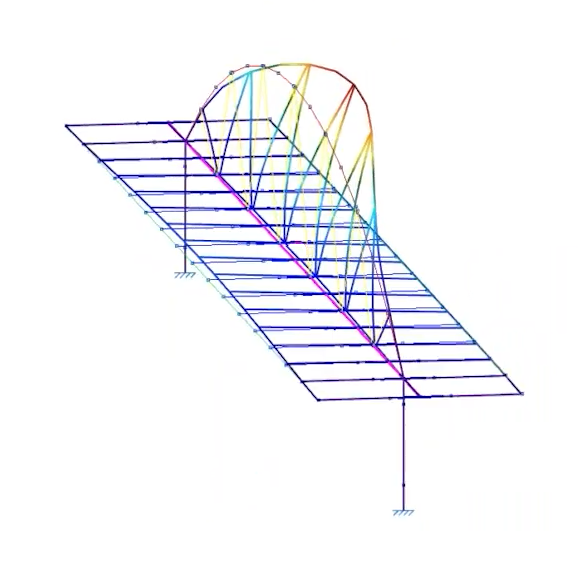
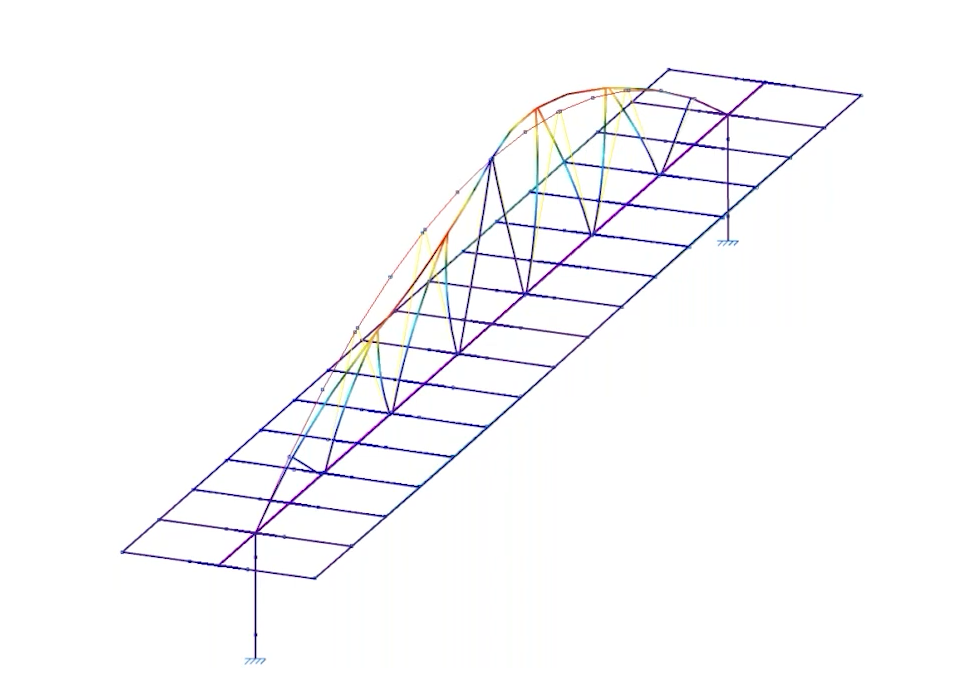
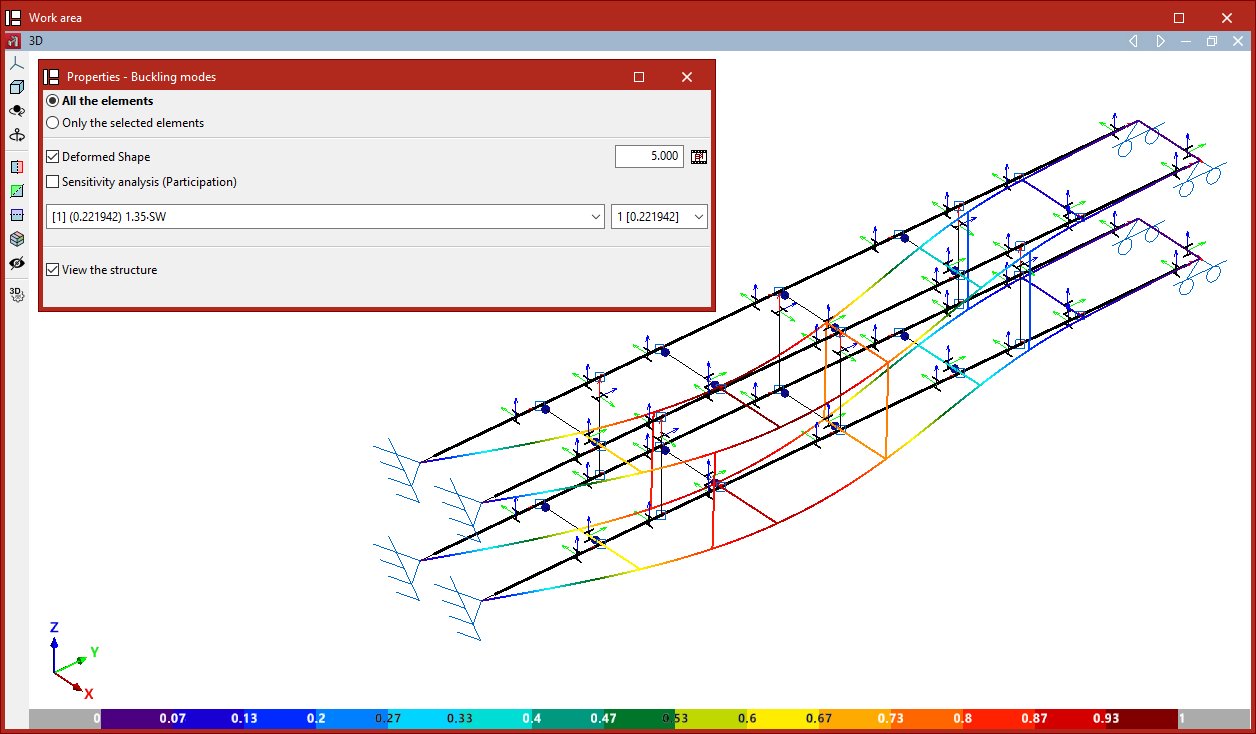
- Once the analysis has been completed, the deformation can be viewed for the various load combinations and buckling modes, along with the critical load factors obtained. Furthermore, a sensitivity analysis can be used to examine the participation coefficient of the bars in each combination and each mode. In this case, we can see that the bars in the upper chord account for the largest proportion; consequently, they are buckling.
- Buckling coefficients in both planes are assigned to the upper chord bars.
- In any of the checks carried out (such as the "Compressive strength" or "Slenderness limit" checks), the analysed buckling coefficient is taken into account.
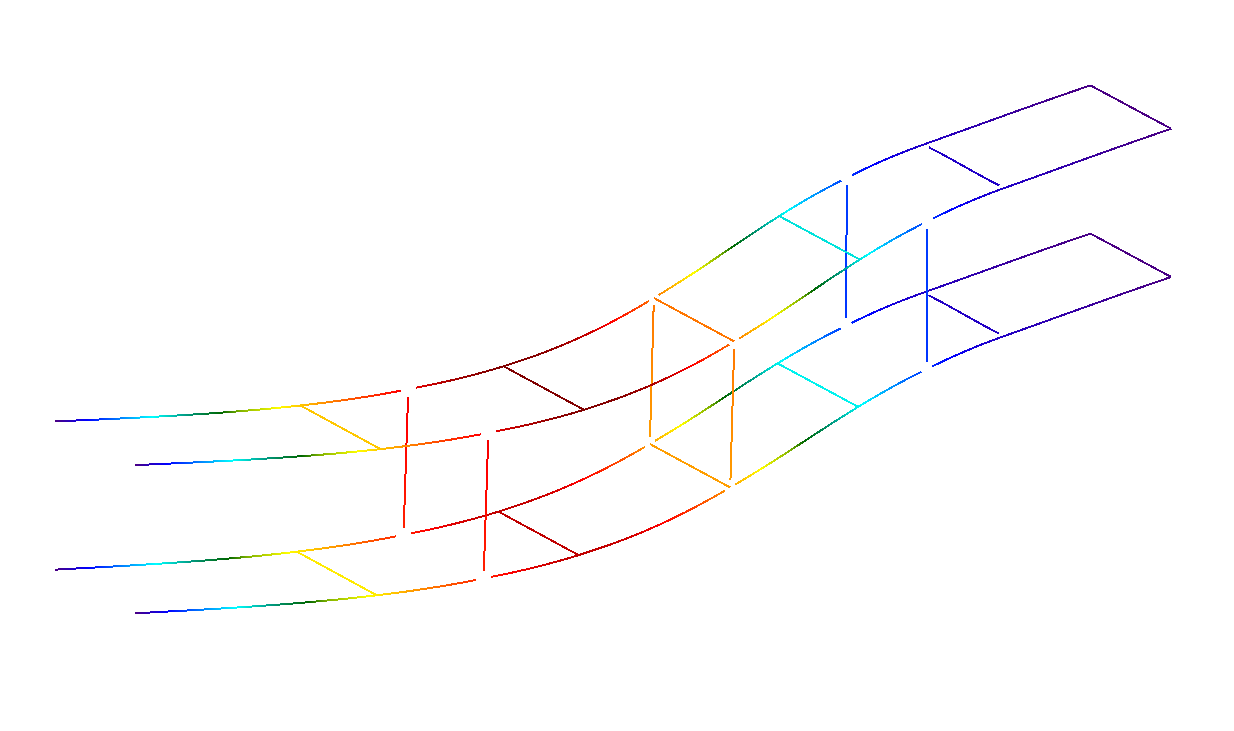
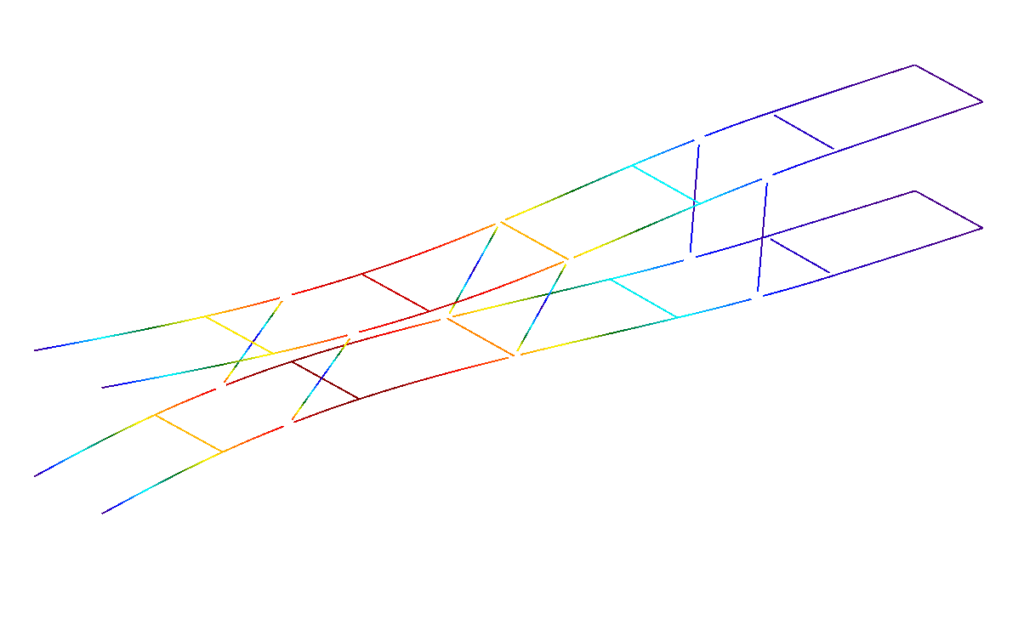
Strut between two retaining walls
The structure of this strut is subjected to compressive forces due to its position between two retaining walls.
The aim is to compare the structural performance of the components before and after carrying out the buckling analysis. To this end:
- The structure of the strut shown is defined by applying a buckling coefficient of 1 to the bars, thereby ensuring compliance with the regulations.
- From this point onwards, the buckling analysis begins. Firstly, ensure that all bars of the structure shown are included in the buckling analysis.
- The buckling analysis is carried out.
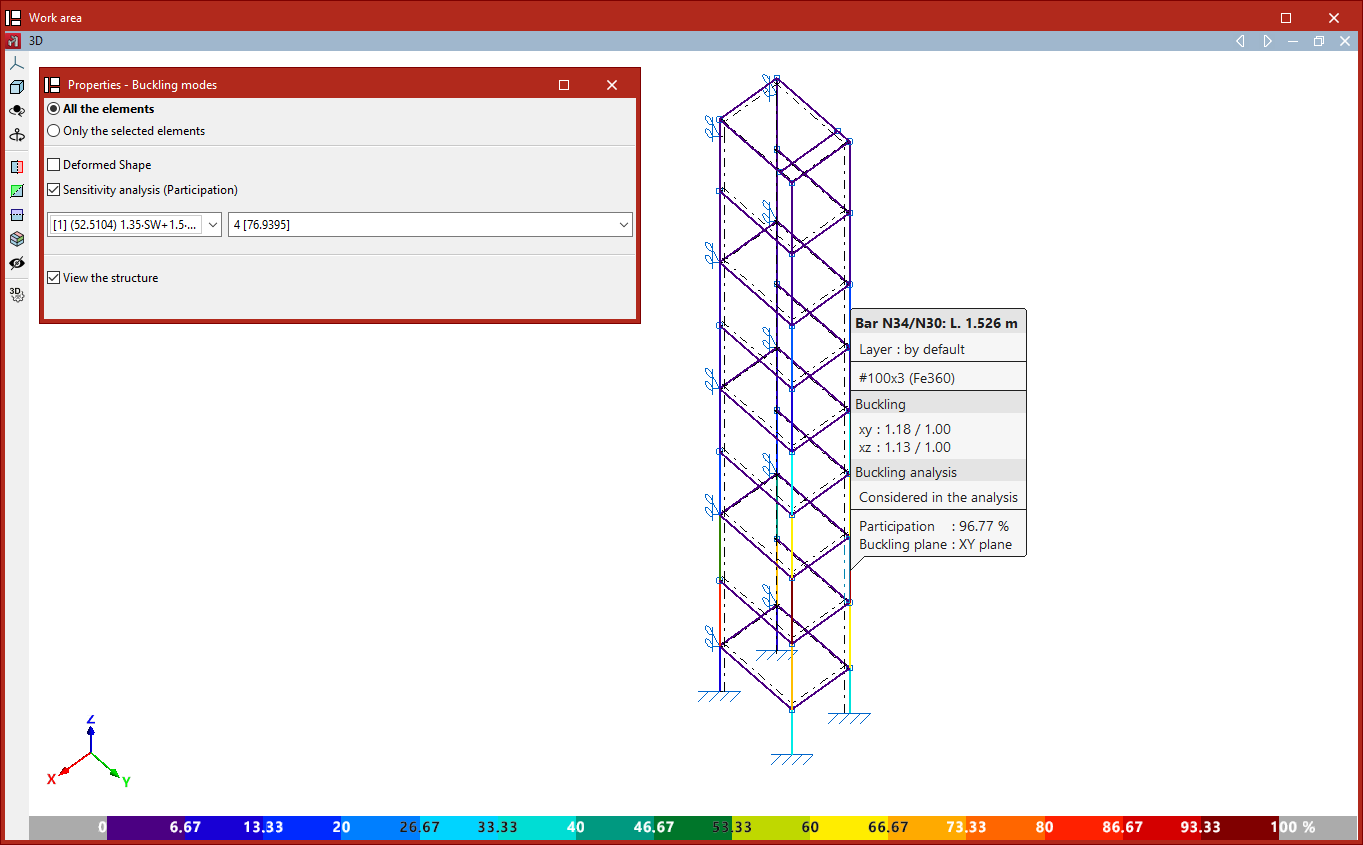
- Once the analysis has been completed, you can view the deformation, the critical load factors obtained and the contribution factor for each bar in every loadcase and mode.
- Buckling coefficients in both planes are assigned to the structural bars.
- The new buckling coefficients analysed may compromise the validity of the checks carried out on the bars before the buckling analysis.

Buckling modes
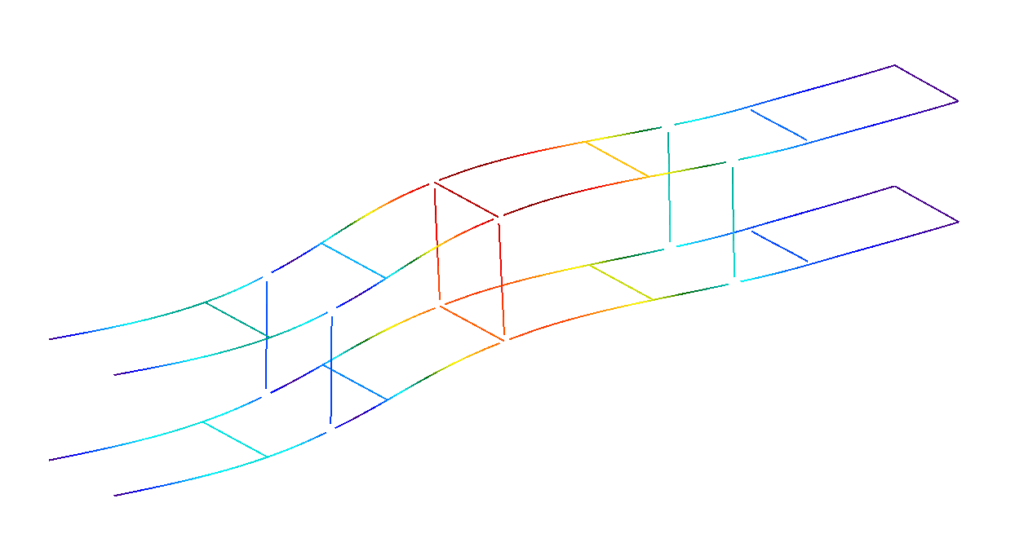
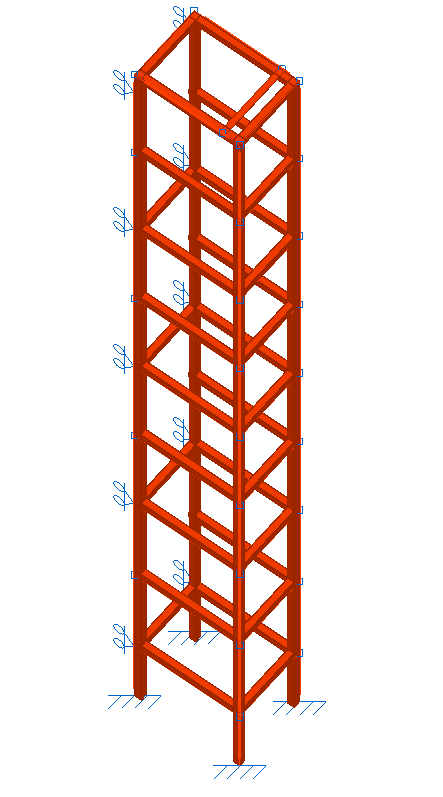
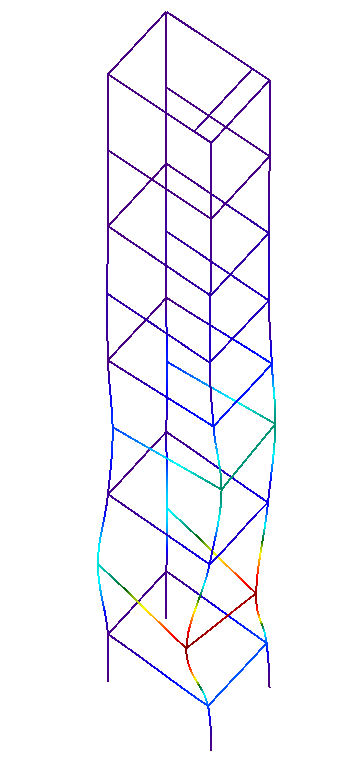
Lift structure
Much like the previous case, the aim here is to compare the structural performance of a lift before and after carrying out a buckling analysis. To do this:
- The lift structure shown is defined by applying a buckling coefficient of 1 to the bars, thereby ensuring compliance with the relevant standards.
- From this point onwards, the buckling analysis begins. Firstly, ensure that all bars of the structure shown are included in the buckling analysis.
- The buckling analysis is carried out.
- Once the analysis has been completed, you can view the deformed shape, the critical load factors obtained and the contribution factor for each bar in every loadcase and mode.
- Buckling coefficients in both planes are assigned to the bars in the structure.
- The new buckling coefficients analysed may compromise the validity of the checks carried out on the bars before the buckling analysis.
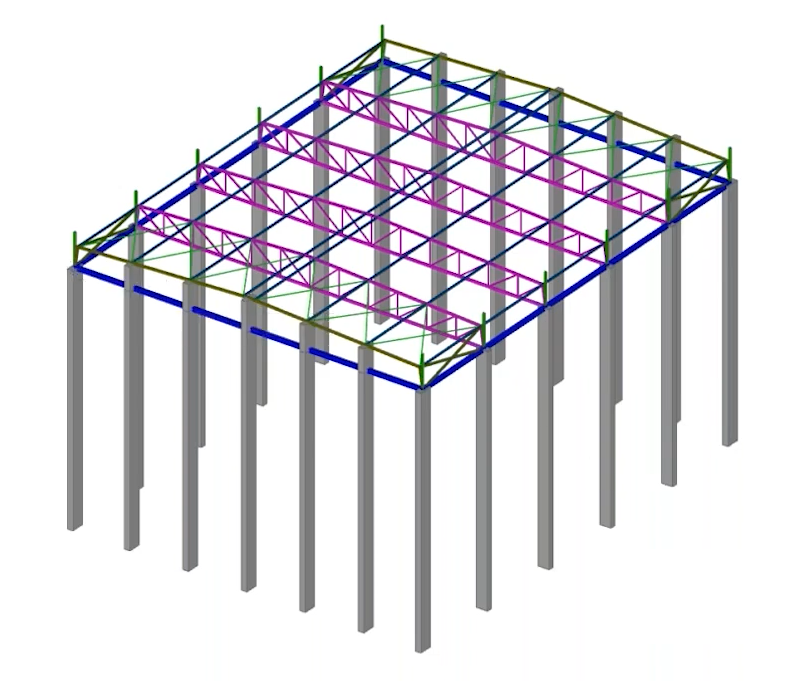
Industrial building with tall concrete columns
The objective is to determine and assign buckling coefficients for the concrete columns forming the side walls of an industrial building, which are of considerable height (over 30 metres). To this end:
- In this case, two analysis groups are defined: the group comprising the side columns and the group comprising the roof purlins. This ensures that the analysis of the elements in both groups is carried out independently, so that they do not interfere with one another. The remaining structural elements are not included in any other analysis group.
- The buckling analysis is carried out.
- Buckling coefficients in both planes are assigned to the columns.
- In any of the checks carried out on the columns (such as the check for the "Ultimate limit state under normal stresses"), the slenderness ratio obtained from the buckling coefficient analysed by the program is taken into account.
Buckling analysis groups
Linear buckling analysis groups can be created and edited using the "Analysis groups" option, which is available in the "Buckling" section of the top toolbar, within the "Analysis" tab (under the "Structure" tab).

The purpose of defining buckling analysis groups is to analyse the buckling behaviour of different sets of structural bars independently.
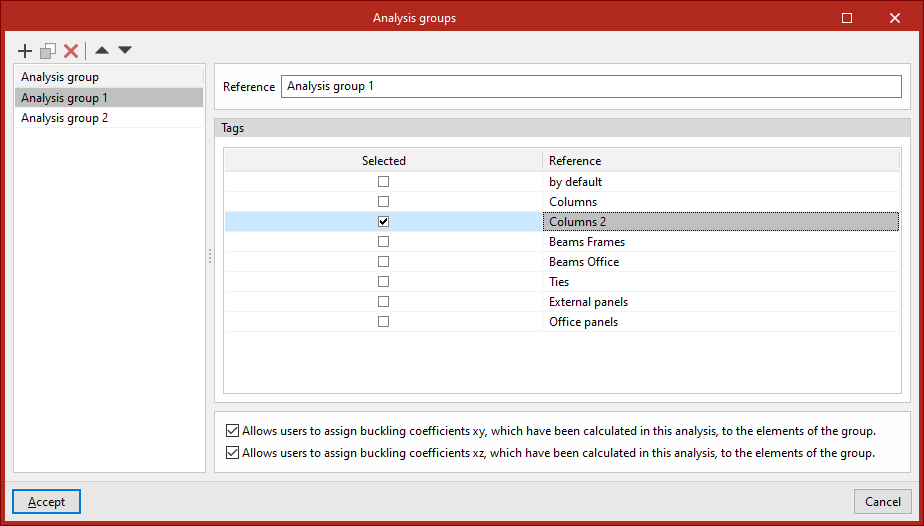
Analysis groups
A buckling analysis group defines a subset of model elements for which a buckling analysis will be performed, such that the buckling modes obtained involve only the elements in the group.
When clicking on this option, the program opens a window where you can add analysis groups to the list on the left-hand side. When adding a group, you must enter its "Reference". You must then specify the "Tags" of the elements you wish to include in the group by ticking the relevant boxes.
Finally, for each analysis group, selecting the following options at the bottom allows the buckling coefficients in each plane calculated in this analysis to be assigned to the elements in the group:
- Allows users to assign buckling coefficients xy, which have been calculated in this analysis, to the elements of the group (optional)
- Allows users to assign buckling coefficients xz, which have been calculated in this analysis, to the elements of the group(optional)
Defining buckling analysis groups is optional:
- If no groups are defined, the program will perform a single analysis taking into account all bars and shells in the model that are marked with the "Include in buckling analysis" option (under the "Properties" tab, in the "Bar" and/or "Shells" sections, "Buckling" option).
- If one or more buckling analysis groups are defined, the buckling analysis for each group will take into account all bars marked with the "Consider in buckling analysis" option and which also have one of the tags selected in the group definition assigned to them.
If a beam belongs to more than one group and its buckling coefficient is assigned automatically in the XY plane, the XZ plane, or both, it will be assigned the highest of all the coefficients calculated in the buckling analyses for the groups to which it belongs.
The buckling analysis results are displayed for the selected analysis group.
| Note: |
|---|
| Tags are defined and assigned in advance to the various elements of the structure via the "Tags" panel, which is located by default on the left-hand side of the main interface. |
Combinations for buckling analysis
Load combinations used in buckling analysis can be entered, generated and/or edited using the following option, which is available in the "Buckling" section of the top toolbar, within the "Analysis" tab (under the "Structure" tab).

Combinations
The structural stability must be analysed using load combinations. The "Combinations" option allows you to define the combinations you wish to analyse.
As with non-linear analysis, load combinations are defined based on the loadcases specified in the "General data" section for the structure.
Clicking on the option opens the "Buckling combinations" window.
The program allows you to define the combinations to be analysed in three ways:
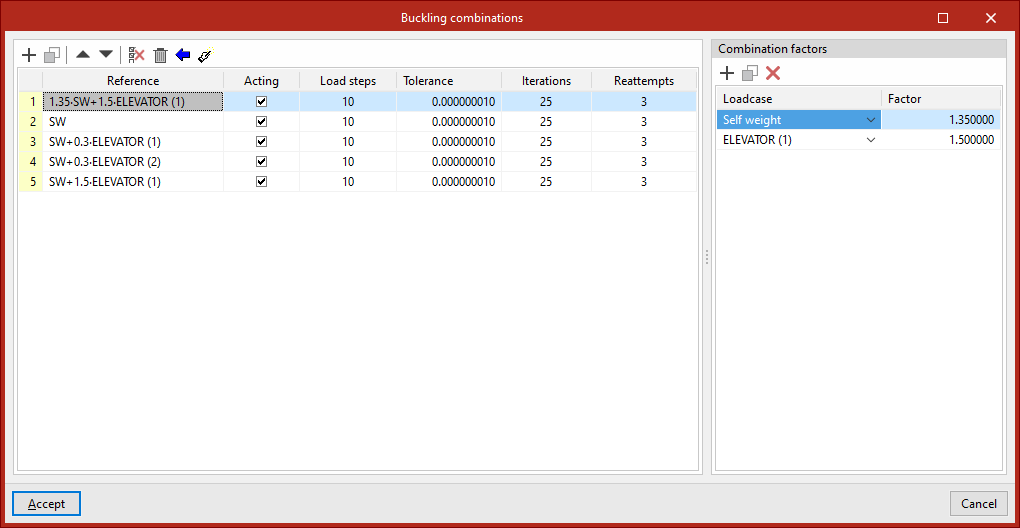
Entering combinations manually
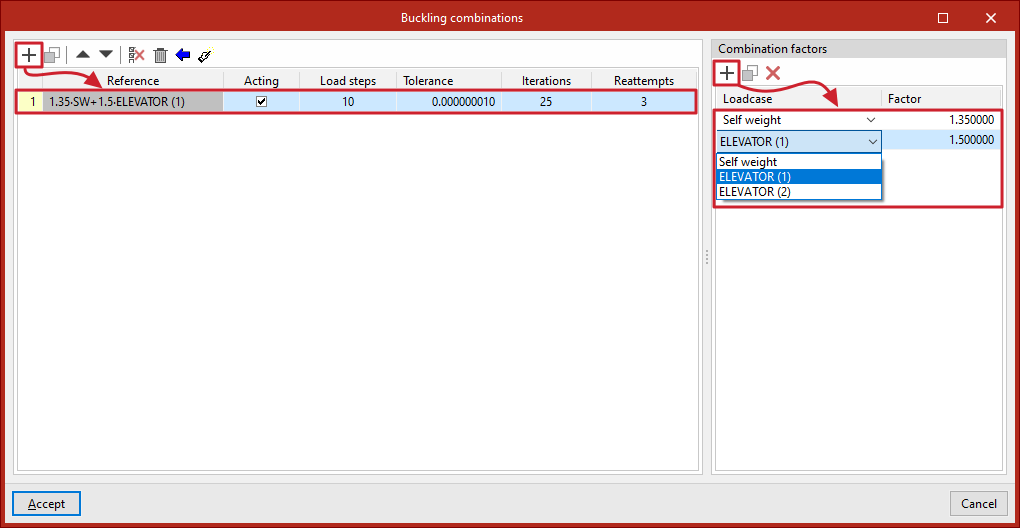
Load combinations for buckling analysis can be added manually to the list on the left-hand side using the options on the top toolbar.
Each combination is defined as follows:
- The "Reference" is generated automatically based on the loadcases and combination factors defined below
- You can indicate whether the combination is '"Acting" or not by ticking the box in the next column
- and the number of "Load steps", the "Tolerance" value, the number of "Iterations" used in the analysis, and the number of "Reattempts" are defined.
Next, on the right-hand side, for each combination entered in the list, the "Combination factors" are defined by entering the value of the "Factor" for each "Loadcase" of the model selected from the drop-down menu.
Generating combinations based on the loadcases defined in the project
It is possible to define combinations for the buckling analysis by automatically generating all possible combinations based on the conditions defined in the project.
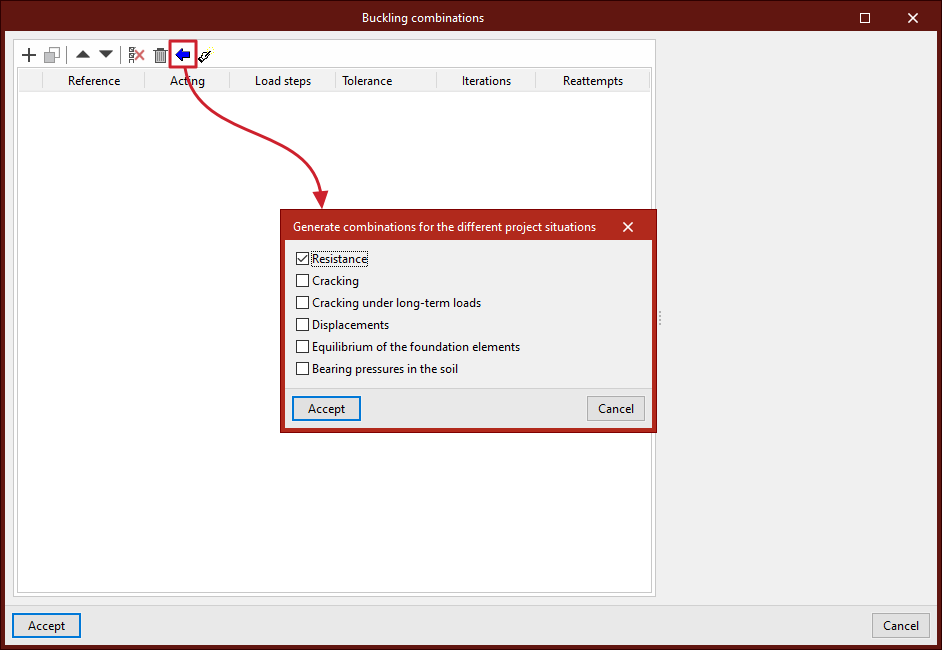
To do this, click the "Generate combinations for the different project situations" button at the top of the list of combinations. In the pop-up window, select the project loadcases from which you wish to retrieve the information, which include the following:
- Resistance (optional)
- Cracking (optional)
- Cracking under long-term loads (optional)
- Displacements (optional)
- Equilibrium of the foundation elements (optional)
- Bearing pressures in the soil (optional)
To apply the settings, click "Accept". The program will generate all combinations of the selected loadcases, automatically adding the necessary entries to the list and the corresponding combination factors.
Generating combinations based on the results of the linear analysis
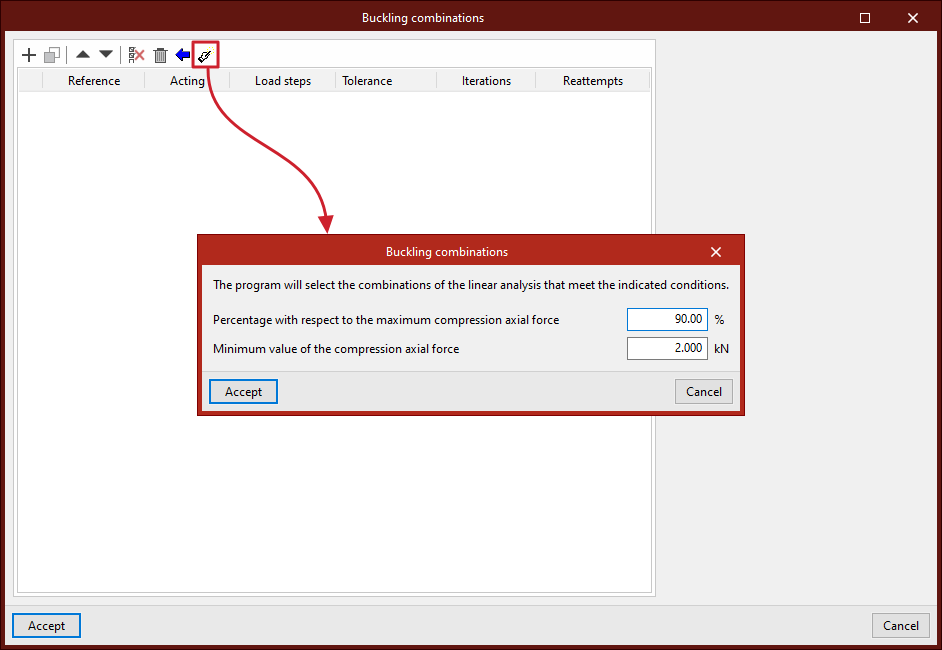
If the structure has been analysed, you can use the "Generate combinations from the results of the linear analysis" option at the top of the combination list. This option automatically adds to the list those combinations in which the largest axial compression forces occur in the structural bars, depending on the conditions defined by the user in the pop-up window.
The program will therefore filter the structural combinations and add to the list those that contain compressed bars with axial forces greater than the "Percentage with respect to the maximum compressive axial force" found in other combinations, and with a "Minimum value of the compressive axial force" expressed in the defined units of force.
To apply the settings, click "Accept". Of all the combinations generated based on the defined loadcases, the program will retain those that meet these requirements, adding the entries to the list along with the corresponding combination factors for each loadcase.
Buckling analysis: "Analysis" option
The buckling analysis is configured and run using the following option, available in the "Buckling" section of the top toolbar, within the "Analysis" tab (under the "Structure" tab).

Analysis
The "Analysis" option allows you to perform a buckling analysis. The window that appears when you click this option allows you to configure the following parameters.
These parameters must be entered for each buckling analysis group, if any have been defined. The analysis groups will appear on the left-hand side of the window. The program will perform the analysis for the groups where the "Analysis" box is ticked.
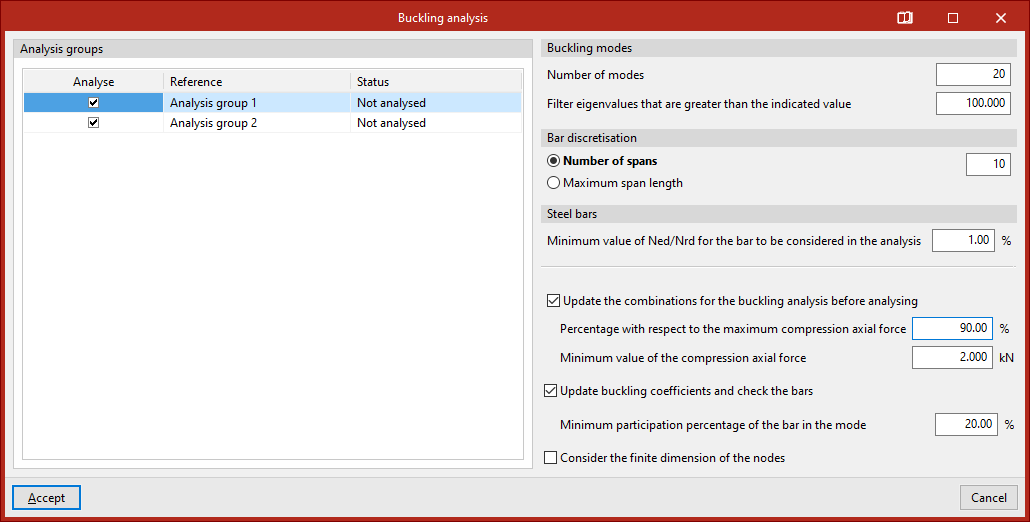
- Firstly, you can specify the number of "Buckling modes" to be analysed. If you select "Filter eigenvalues that are greater than the indicated value", modes in which the critical load factor is very high will not be displayed.
- "Bar discretisation" is also set, either by "Number of spans" or by "Maximum span length".
- Next, for "Steel bars", you can also apply a filter for bars with small compression axes by specifying the "Minimum Ned/Nrd value for a bar to be considered in the analysis". The program will not include bars with a compression axis smaller than the percentage specified in this section.
- If the structural analysis has been performed, the program displays a series of additional options for "Update the combinations for the buckling analysis before analysing", specifying the "Percentage with respect to the maximum compression axial force" and the "Minimum value of the compression axial force". This way, these combinations will be generated directly for the buckling analysis, without the need to do so beforehand via the "Combinations" option in the group.
- The program also allows you to "Update buckling coefficients and check the bars" as part of the same analysis process. To do this, you specify the "Minimum participation percentage of the bar in the mode" so that its buckling coefficient is updated. This means you will not need to use the "Assign coefficients" option in the same group.
- Finally, you can "Consider the finite dimension of the nodes" by selecting the last option.
Clicking "Accept" starts the buckling analysis.
Once completed, the program will display an "Information" message, which you must click "Accept" to confirm.
View results by buckling mode
The results obtained by mode in the linear buckling analysis can be viewed using the following option, available in the "Buckling" section of the top toolbar, within the "Analysis" tab (under the "Structure" tab).

Buckling modes
The "Buckling Modes" option allows you to view on screen the results obtained from the linear buckling analysis for the different buckling modes considered for each load combination.
In the "Properties - Buckling Modes" window that appears, you can choose to display "All elements" or "Only the selected elements".
You can then choose to display the "Deformed shape" view by entering a scaling factor for the deformation. Next to this, the button allows you to view an "Animation" of the selected buckling mode.
Use the drop-down menus below to select the load combination and buckling mode you wish to view:
- In the load combination selection drop-down menu, the mode number is shown in square brackets, and the critical load factor for that mode is shown in round brackets. The mode with the lowest factor in the list of modes is displayed.
- The buckling mode selection drop-down menu displays the mode number and, in brackets, its critical load factor.
The program can determine the buckling coefficients in each plane using the calculated values of the critical load factors obtained from the buckling analysis, and assign them to the bars by selecting the relevant option.
The calculated buckling coefficients are displayed in an information box that appears when you hover the cursor over the bars.
| Note: |
|---|
| The critical load axis (Ncr) is obtained by multiplying the critical load factor (αcr) of the buckling mode by the load-bearing axis of that load combination (Ned): Ncr = Ned * αcr Using Euler’s critical load formula, the buckling beta coefficient (β) for each member can be determined: Ncr = π²*EI / (βL)² β = (π/L)*(EI/(Ned * αcr))¹/² |
Sensitivity analysis
The program can carry out a sensitivity analysis based on the deformation energy, thereby determining whether each buckling mode affects or is relevant to each bar.
Ticking the "Sensitivity analysis" box displays the percentage contribution of each bar to the total using a colour-coded scale.
The bar that is most filled in will show a percentage of 100%. The other bars will show a percentage between 0 and 100%.
| Note: |
|---|
| If a bar has a very low percentage of participation in a given combination and mode, the bar will not sway, or will sway only very slightly. |
Checking buckling contour plots
Isovalues for buckling analysis can be viewed using the following option, available in the "Buckling" section of the top toolbar, within the "Analysis" tab (under the "Structure" tab).

Contour plots
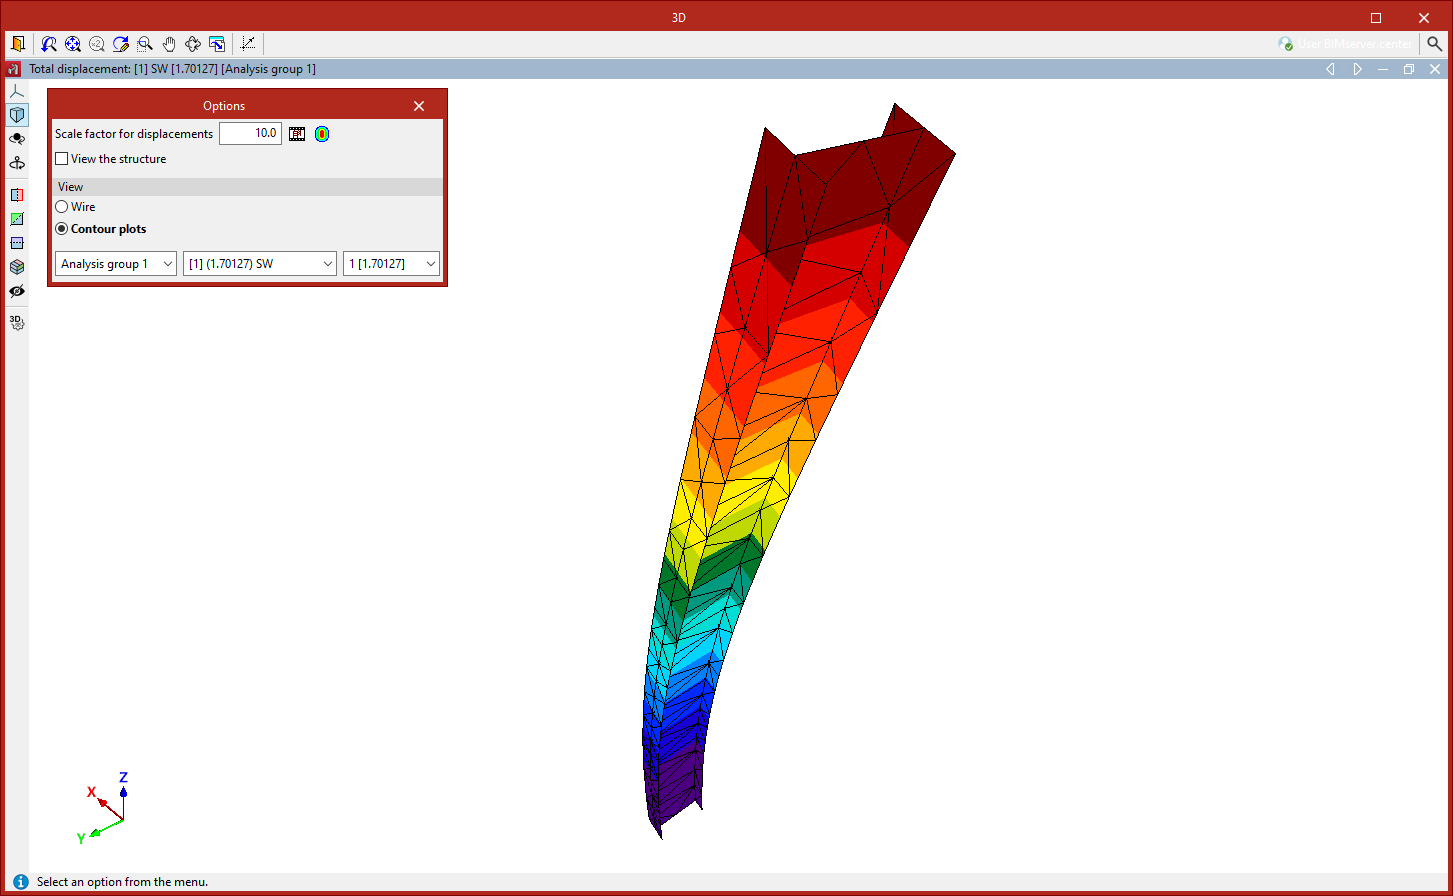
The program enables the analysis of buckling in shells.
Using the "Buckling" option in the "Shells" section of the "Properties" tab, you can select the sheets to be included in the linear buckling analysis.
Once the buckling analysis has been carried out, the "Contour plots" option in the "Analysis" tab allows you to view the contour plots of the deflection for the different buckling modes in a pop-up window.
A pop-up dialogue box appears in this window to configure various "Options":
- Firstly, you can adjust the "Scale factor for displacements" and the "Colours for the representation of contour maps", as well as view an "Animation" of the deformed shape.
- The "View structure" option allows you to display the original geometry of the structure on screen.
- You can select the "Display" option in "Wire" mode, which shows only the outlines of the mesh elements, or "Contour plots" mode, which colours the elements in full.
- Use the drop-down menus at the bottom to select the analysis group, load combination and vibration mode you wish to view. The value of the calculated critical load factor is shown in brackets.
Assigning buckling coefficients
Buckling coefficients can be assigned either during the analysis or using the following option, available in the "Buckling" section of the top toolbar, within the "Analysis" tab (under the "Structure" tab).

Assignment of buckling coefficients
The program automatically calculates the buckling coefficients for each bar included in the buckling analysis based on the critical load factors and the stressed axis.
The coefficients obtained can be allocated in two ways:
- In the same buckling analysis process launched using the "Analysis" option, by selecting the "Update buckling coefficients and check the bars" option,
- Or by using the "Assign buckling coefficients" option in the "Buckling" group at a later stage of the analysis.
The sensitivity analysis allows us to determine which buckling modes affect each bar, to calculate and assign buckling coefficients. To this end, in either of the two cases described above, the "Minimum participation percentage of the bar in the mode" is specified so that its buckling coefficient can be updated.
The program will assign the buckling coefficients obtained to the bars that were included in the buckling analysis and that have a contribution to the dominant mode equal to or greater than the specified value.
| Note: |
|---|
| If a bar's buckling percentage exceeds the specified value, the bar is considered to be buckling in that buckling mode, and its associated critical load factor should therefore be used. Using the list of axes and the critical load factors for each member under each load combination, it is possible to determine the highest buckling coefficient for each plane. |
At the bottom of the window that appears when you click on "Assign buckling coefficients", the program allows you to select one or more of the "Analysis groups" for which the analysis has been performed. The program will assign to each bar the highest of all the coefficients calculated in the buckling analyses of the groups to which it belongs.
Clicking "Accept" applies the buckling coefficients.
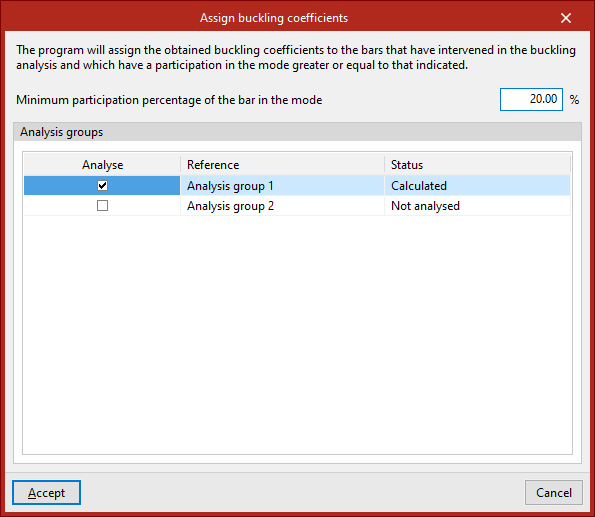
Table of contents
Complete your CYPE 3D journey by exploring the other available sections:
- Introduction
- Start: creating new projects, workflows, and examples
- Setting the work environment
- Setting the job data
- Defining the structure’s geometry
- Editing the properties of structural elements
- Entering and editing loads on the structure
- Designing and analysing connections
- Analyses, checks, and results
- Defining and editing reinforcement
- Designing and analysing foundation
- Printing documents and exporting data